Issue Brief June 2013
www.act.org/research-policy
STEM Educator Pipeline:
Doing the Math on Recruiting
Math and Science Teachers
Science, technology, engineering, and math (STEM) occupations are expected to grow at a much higher rate than non-STEM occupations (17.0 percent from 2008 to 2018 compared to 9.8 percent1), and employers claim that there are
shortages of qualified workers.2Now, according to
the National Science Board, “all students [must] develop their capabilities in STEM to levels much beyond what was considered acceptable in the past,”3 even for previously low-skilled jobs. The
STEM pipeline needs to be expanded, and most efforts are focused on increasing the number of STEM graduates. Yet an essential component of this pipeline is the need for more high-quality science and math teachers.4
Since the mid-2000s, there have been proposals to increase the total number and quality of K–12 STEM educators.5 During the 2006 State of the
Union Address, President Bush proposed as part of the American Competitiveness Initiative a plan to produce 100,000 high-quality math and science teachers by 2015.6 The plan was included
in the America COMPETES Act as introduced to Congress in May 2007,7 but ultimately it was not
a part of the enacted legislation. Four years later, the President’s Council of Advisors on Science and Technology (PCAST) revived the initiative, recommending that “the Federal Government . . . set a goal of ensuring the recruitment, preparation, and induction support of at least 100,000 new STEM teachers over the next decade.”8 The
PCAST report, citing research by Richard Ingersoll, acknowledged that the 10,000-STEM-teacher-per-year goal was insufficient to address the
annual demand of approximately 25,000 STEM teachers per year,9 but that the quality of the new
STEM teachers was critical. Instead of focusing solely on increasing the number of STEM teachers, PCAST recommended trying to increase the number of quality STEM teachers.
To address the shortage of qualified math and science teachers, President Obama adopted the PCAST recommendation and proposed an $80 million investment as part of a public-private partnership to prepare 100,000 new math and science teachers over the next decade (10,000 per year).10 The STEM Teacher Pathways detailed
in the President’s Fiscal Year 2014 Budget would expand pathways to teacher certification as well as develop new recruiting strategies to place “talented recent college graduates and mid-career professionals in the STEM fields in high-need schools.”11 The emphasis of the STEM Teacher
Pathways is that the teachers are new, highly effective teachers. Likewise, the private analog, “100Kin10,” stresses that the need is not simply for new teachers, but for “100,000 new, excellent science, technology, engineering, and math (STEM) teachers in 10 years.”12
The persistence of the 100,000-STEM-teachers-in-a-decade goal illustrates that there is a need for these high-quality teachers but that it is a challenging undertaking. This paper uses data from the ACT® college readiness assessment to
examine the feasibility of reaching the 100,000- quality-STEM-teachers-in-a-decade goal. So, how difficult will it be to achieve this goal?
Benchmarks in math and science.18 The
College Readiness Benchmarks are subject-specific scores representing the level of achievement required for students to have a 50% chance of obtaining a B or higher in first-year, credit-bearing college courses. The College Readiness Benchmarks provide a useful tool in determining whether the student will be successful in the college-level math and science courses that would serve as the foundation for teaching at the K–12 level.19 For this report, STEM-Capable
Students are those who met the Math or Science College Readiness Benchmarks but have not expressed interest in majoring in education.
The next section explores the feasibility of reaching the 4,000-per-year target using the above definitions.
STEM-Interested Students
Of the 1.3 million ACT-tested graduates who tested in 2012 during either their junior or senior year and were either “fairly sure” or “very sure” of their potential career occupation, 6% (n=76,375) reported that they wanted to be education majors (Table 2). Only 0.25% (n=3,146) identified that they wanted to be math teachers and 0.06% (n=731) wanted to be science teachers. Although these percentages seem negligible, when totaled they culminate in 3,877 interested math or science teachers, which is very near the 4,000 target. The numbers have risen sharply over the last five years but demonstrate an annual average shortage of approximately 700 teachers from the 4,000-per-year goal over that period (Table 2). While encouraging, the next question that must be asked is: How many of these STEM-interested students are ready for the college-level math and science courseworkBreaking Down the
Annual Target
Assessing the goal’s feasibility requires a couple of assumptions.13 The first relates
to the annual target. Although the federal goal is 100,000 high-quality STEM teachers in a decade, not all 10,000 per year will be comprised solely of recent college graduates. Not all science and math teachers are certified to teach through the traditional pathways. Alternative pathways exist for recent college graduates who did not major in education and for midcareer STEM professionals interested in a career change. Recruitment from both groups is a component to the federal plan. In 2007, approximately 20% of math and science teachers entered teaching through alternative certification programs.14 Assuming this rate
continues, the annual target drops to 8,000 new STEM teachers per year to come from traditional certification routes (i.e., college teacher education majors).
On the college entrant side, each year approximately 3 million students take a college entrance exam. About half of the annual test-takers choose the ACT test, while the other half take the SAT.15 Assuming that
ACT and SAT test-takers have similar career interests, the target number of ACT-tested
aspiring math and science teachers is now just 4,000 per year (i.e., half of the 8,000 per year).
Defining STEM Interest and
Teaching Capability
To gauge the pliability of the STEM teacher pipeline, several definitions are needed (Table 1). First is interest in math and science teaching as indicated by the college major students provide when registering for the ACT. For this report, STEM-Interested Students are those who indicated math education or science education as their desired major in college. The analysis also considers students who expressed interest in education but without the math or science specialty. These students are considered STEM-Qualified Education Majors. Second, there are important qualities and characteristics that are necessary for effective teaching, such as behavior management, engaging students in learning, and effective communication with students.16
For math and science teaching, subject-matter expertise is essential to high-quality math and science teaching.17 Teachers
should have a thorough understanding of the content to teach it adeptly.
STEM capability is measured by whether the students meet the ACT College Readiness
Table 1. Summary of Definitions STEM-Interested
Students Students interested in majoring in math or science education STEM-Qualified
Education Majors Students interested in majoring in education generally STEM-Capable
necessary to teach K–12 math and science? The College Readiness Benchmark
performance of interested math and science teachers surpasses the national average. Seventy percent of students interested in being a math teacher met or exceeded ACT’s Math College Readiness Benchmark and 42% of potential science teachers met the Science College Readiness Benchmark (Figure 1). After removing the students unable to meet the College Readiness Benchmarks, 2,192 STEM-capable math teachers and 310 STEM-capable science teachers are left,20 which means a shortfall
of nearly 1,500 teachers from the annual target.21
To close this gap, there must be recruitment from other groups. One potential group of science and math teachers is those students interested in education generally. A second group is students who are capable of STEM majors but who have not expressed an interest in becoming a math or science teacher.
STEM-Qualified Education
Majors
In 2012, 76,375 students reported that they were “fairly sure” or “very sure” that they wanted to pursue an education major in a field other than math or science. Although the STEM-qualified education majors perform worse than the national average on College Readiness Benchmark performance, there are a sufficient number to meet the annual target (Figure 2). In 2012, there were 28,372 education majors who met the Math College Readiness Benchmark, 16,608 who met the Science College Readiness Benchmark, and 14,137 who met both. Of the 30,843 who met either the Math or Science College Readiness Benchmark, only 5% would need to be recruited in combination with those who expressed an interest in math and science teaching to meet the 4,000 goal.
Table 2. ACT Junior and Senior Students “Fairly Sure” or “Very Sure” of their College Major
2008 2009 2010 2011 2012 Avg.
Math Ed. 2,006 2,323 2,617 2,878 3,146 2,954
Science Ed. 640 731 786 806 731 739
Math & Sci. Ed. 2,646 3,054 3,403 3,684 3,877 3,333
General Ed. 77,173 82,576 86,163 83,781 76,375
National 1,116,013 1,116,739 1,177,803 1,227,117 1,280,153 1,183,565 Note: National is limited to students “fairly sure” or “very sure” of their college major and includes the aspiring math and science teachers.
Figure 1. Percent of STEM-Interested Students Meeting ACT Math and Science College Readiness Benchmarks
70% (n=2,192) 57% (n=419) 43% (n=551,853) 37% (n=1,178) 42% (n=310) 29% (n=367,141) 0 20 40 60 80 100
Math Ed. Science Ed. National Math Ed. Science Ed. National
Math Benchmarks Science Benchmarks
Percent
Note: Data are limited to students who are “fairly sure” or “very sure” of their college major. National data include data on math and science education majors.
Figure 2. Percent of STEM-Qualified Education Majors Meeting ACT Math and Science College Readiness Benchmarks
37% (n=28,372) 43% (n=551,853) 22% (n=16,802) 29% (n=367,141) 0 20 40 60 80 100
General Ed. National General Ed. National
Math Benchmarks Science Benchmarks
Percent
STEM-Capable Students
The other natural group for recruitment is students who are capable of STEM work. For this group of students, instead of looking at high school junior and senior students who were “fairly sure” or “very sure” of their potential major, we look at high school junior and senior students who met either the Math or Science College Readiness Benchmark and who did not express an interest in majoring in education.The college major choices of those STEM-capable students indicate that there may be an opportunity to recruit students into the teaching profession, as the second most popular major for students meeting either the math or science College Readiness Benchmark was “undecided” (Figure 3). If approximately 1% of those undecided students were recruited into education, there would be a sufficient number of math and science education majors in addition to those who already expressed an interest in math and science teaching.
Conclusion
The future labor force is one that will rely heavily on technology. Education must respond to both the need for STEM graduates and the teachers who will guide, grow, and inspire the next generation of STEM leaders. As President Obama stated in his second inaugural address, “no single person can train all the math and science teachers we’ll need to equip our children for the future.”22
The federal goal of 100,000 new, high-quality math and science teachers over the upcoming decade will require recruiting students who are not currently considering becoming math or science teachers as well as improving the math and science performance of many who desire to become teachers but may not now be capable of doing so. The 2012 ACT data illustrate that
Figure 3. Five Most Popular College Majors for Students Meeting Either the Math or Science College Readiness Benchmark Who Did Not Express an Interest in Majoring in Education
20% n=149,881 17% n=133,231 11% n=83,433 10% n=77,450 9% n=72,071 0 5 10 15 20 25 Health Sciences Technologies
Undecided Engineering Business Sciences: Bio and Physical
Percent
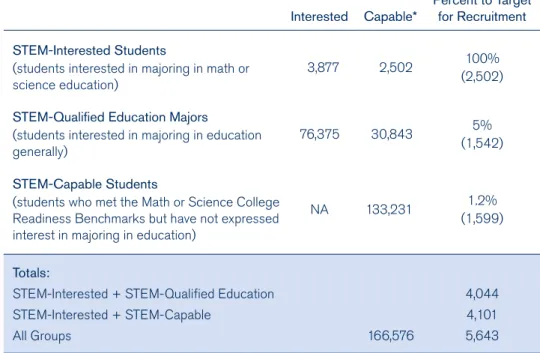
Table 3. Summary of Interest and Capability of K–12 Math and Science Teaching
Interested Capable*
Percent to Target for Recruitment STEM-Interested Students
(students interested in majoring in math or science education)
3,877 2,502 100%
(2,502)
STEM-Qualified Education Majors
(students interested in majoring in education generally)
76,375 30,843 5%
(1,542)
STEM-Capable Students
(students who met the Math or Science College Readiness Benchmarks but have not expressed interest in majoring in education)
NA 133,231 1.2%
(1,599)
Totals:
STEM-Interested + STEM-Qualified Education STEM-Interested + STEM-Capable
All Groups 166,576
4,044 4,101 5,643 *Capable is defined as meeting the ACT College Readiness Benchmarks in Math or Science.
many entering college students are currently equipped (e.g., they have met the ACT College Readiness Benchmarks for math or science) to teach science and math courses at the K–12 level, and some are interested in teaching. Unfortunately, too few are both interested and capable.
There are two potential groups to target for recruitment (see Table 3). The first are students who are interested in education generally but not STEM specifically. By and large, this group will be the easiest to recruit. They would be performing primarily the same job function (science or math teaching
would not only benefit the workforce in general but would also provide a larger pool from which to recruit high-quality math and science teachers.
High-quality teaching can have lasting effects on students.27 If state and federal
programs are able to attract and retain these talented math and science teachers, there is potential to greatly increase the quality of STEM education and students’ preparedness for careers. As more and more jobs require technical skills, it is crucial that students receive the necessary instruction to prepare them for and interest them in these careers. Existing federal and state programs to recruit more math and science teachers are the first step in helping prepare students for these careers, but as the above analysis shows, their reach should include those currently outside the STEM education field. Meeting the goal of 100,000 qualified math and science teachers within the decade is possible but will require innovative strategies for recruiting from nontraditional sources. for three years for 240 math and science
teachers.25 To recruit from the STEM fields,
teacher salaries need to be more competitive. Although the state programs are laudable, the resulting salary is still substantially less than what students could earn in nonteaching STEM occupations, and both initiatives are time restricted. In other words, today’s teacher recruitment problem is tomorrow’s retention challenge.
In addition to recruitment of students once they have entered college and beyond, there should also be efforts to expand the pipeline down to high school. For instance, high schools can offer career academies, which are small learning communities where the curricular emphasis is tied to a career theme. Career academies with a focus on STEM or education could foster an interest in STEM as well as provide the necessary content knowledge. Alternatively, bridge programs between high school and college can serve to provide remediation, build confidence, and increase interest in STEM fields.26 Increasing
STEM interest and ability at an earlier age vs. general education) at a similar rate of
pay. Efforts should be made within colleges of education to identify STEM-qualified students and encourage them to consider math and science teaching.
The second group, STEM-capable students, will be more difficult to recruit. The challenge is that STEM occupations outside of education pay substantially more than a math or science teacher earns. For example, a Payscale salary report finds the median starting salary for chemical engineering majors is $67,500, whereas the median starting salary for education majors is $37,200.23 Some states have undertaken
efforts to incent math and science teachers via temporary stipends. For instance,in Iowa, the proposed Teach Iowa Initiative would increase beginner teacher pay and provide tuition reimbursements of $4,000 a year for five years with a priority placed on math and science teachers.24 In New Jersey,
the Woodrow Wilson Teaching Fellowship Foundation will provide a $30,000 stipend to fill vacancies in hard-to-staff schools
18 Jeff Allen and Jim Sconing, Using ACT Assessment Scores to Set Benchmarks for College Readiness (Iowa City, IA: ACT, 2005). 19 However, like all benchmarks there is some
classification error. There are some students just below the Benchmark who may perform well in entry-level college classes, and there are some students just above the Benchmark who may not perform well.
20 The difference in the total number of qualified students is due to rounding.
21 As stated in note 13, this analysis assumes that all of the interested and capable students attend and graduate college.
22 “Obama’s Second Inaugural Speech,” New York Times, January 21, 2013.
23 “Majors That Pay You Back,” Payscale, accessed February 14, 2013, http://www.payscale.com/ college-salary-report-2013/majors-that-pay-you-back.
24 Iowa Department of Education, Building World-Class Schools for Iowa: A Legislative Brief (Des Moines, IA: Iowa Department of Education, 2013).
25 “Christie Announces Initiative to Address Shortage of Math, Science Teachers in N.J.,”
New Jersey Star Ledger,December 7, 2012. 26 Joan M. Raines, “FirstSTEP: A Preliminary
Review of the Effects of a Summer Bridge Program on Pre-College STEM Majors,”
Journal of STEM Education: Innovations and Research 13 (2012): 22–29; Jiang Zhe, Dennis Doverspike, Julie Zhao, Paul Liam, and Craig Menzemer, “High School Bridge Program: A Multidisciplinary STEM Research Program,”
Journal of STEM Education: Innovations and Research 11 (2010): 61–68.
27 Raj Chetty, John Friedman, and Jonah Rockoff, “The Long-Term Impacts of Teachers: Teacher-Value-Added and Student Outcomes in Adulthood,” NBER Working Paper No. 17699, (National Bureau of Economic Research, Cambridge, MA: December 2011). 10 White House, “President Obama to Host White
House Science Fair,” news release, February 6, 2012; President Obama’s Goals for America, http://www.barackobama.com/goals/. 11 White House, Fiscal Year 2014 Budget Summary and Background Information
(Washington, DC: The White House, 2013), http://www2.ed.gov/about/overview/budget/ budget14/summary/14summary.pdf. 12 “FAQ,” 100Kin10, http://www.100kin10.org/
page/faq; emphasis added.
13 An additional assumption is that all of these qualified STEM-interested students will attend college. Using data from the National Student Clearinghouse (NSC) for students who graduated in 2006 through 2010, approximately 84% enrolled in a postsecondary institution the fall after their senior year and 80% persist to the second year at a postsecondary institution. As not all institutions participate in NSC, and as tracking students who do not provide a social security number can be difficult, the enrollment and persistence rates are likely higher.
14 National Science Foundation, Science and Engineering Indicators 2012 (Arlington, VA: Author, 2012), http://www.nsf.gov/statistics/ seind12/c1/c1h.htm.
15 Justin Pope, “SAT Scores Edge Down, Just 43 Percent of Students College Ready As ACT More Popular Exam for First Time Ever,”
Huffington Post (blog), September 24, 2012, http://www.huffingtonpost.com/2012/09/24/ sat-scores-edge-down-act-_n_1909494.html. 16 Bill & Melinda Gates Foundation, Feedback
for Better Teaching: Nine Principles for Using Measures of Effective Teaching (Seattle, WA: Author, 2013).
17 Heather C. Hill, Brian Rowan, and Deborah Loewenberg Ball, “Effects of Teachers’ Mathematical Knowledge for Teaching on Student Achievement” American Educational Research Journal 42 (2005): 371–406; Deborah Loewenberg Ball, Mark Hoover Thames, and Geoffrey Phelps, “Content Knowledge for Teaching: What Makes It Special?” Journal of Teacher Education 59 (2008): 389–407; President’s Council of Advisors on Science and Technology, Prepare and Inspire.
Notes
1 Economics & Statistics Administration,
STEM: Good Jobs Now and For the Future
(Washington, DC: U.S. Department of Commerce, 2011).
2 See Anthony P. Carnevale, Nicole Smith, and Michelle Melton, STEM (Washington, DC: Center on Education and the Workforce, Georgetown University, 2011); also see Microsoft Corporation, A National Talent Strategy: Ideas for Securing U.S. Competitiveness and Economic Growth
(Seattle, Washington: Microsoft Corporation, 2012). This contention is disputed by some researchers; see Daniel Costa, STEM Labor Shortages? Microsoft Report Distorts Reality About Computing Occupations (Washington, DC: Economic Policy Institute, 2012). 3 National Science Board, Preparing the Next
Generation of STEM Innovators: Identifying and Developing Our Nation’s Capital (Alexandria, VA: National Science Foundation, 2010); National Science Board, National Action Plan for Addressing the Critical Needs of the U.S. Science, Technology, Engineering, and Mathematics Education System (Alexandria, VA: National Science Foundation, 2007).
4 Sarah D. Sparks, “Qualified Math Teachers Elusive for Struggling Students, Studies Find,”
Education Week (April 2, 2013).
5 See Kyle Zinth, Recent State STEM Initiatives
(Denver, CO: Education Commission of the States, 2007) for a description of state STEM initiatives.
6 “President Bush’s State of the Union Address,”
The Washington Post, January 31, 2006. 7 America COMPETES Act, H.R. 2772, 110th
Cong. § Sec. 111 (2007).
8 President’s Council of Advisors on Science and Technology, Prepare and Inspire: K-12 Education in Science, Technology, Engineering, and Math (STEM) for America’s Future
(Washington, DC: Author, 2010), http://www. whitehouse.gov/sites/default/files/microsites/ ostp/pcast-stemed-report.pdf.