Getting There Greener
The Guide to Your Lower-Carbon Vacation
Union of Concerned Scientists
December 2008
Getting There Greener
ii Union of Concerned Scientists Getting There Greener
© 2008 Union of Concerned Scientists All rights reserved
The Union of Concerned Scientists is the leading science-based nonprofit working for a healthy environment and a safer world.
The UCS Clean Vehicles Program develops and promotes strategies to reduce the adverse environmental impact of the U.S. transportation system.
More information about the Union of Concerned Scientists and the Clean Vehicles Program is available on the UCS website at www.ucsusa.org. The full text of this report is available online (in PDF format) at
www.ucsusa.org/publications or may be obtained from: UCS Publications
Two Brattle Square
Cambridge, MA 02238-9105
Or, email [email protected] or call (617) 547-5552. Design: Catalano Design
iii Getting There Greener
Contents
Figures & Tables iv
Contributors & Acknowledgments vi
Executive Summary 1
Chapter 1
Rules of the Road for a Greener Vacation 7
Chapter 2 Air Travel 10 Chapter 3 Automobile Travel 16 Chapter 4 Rail Travel 20 Chapter 5
Motor Coach Travel 23
Chapter 6
The Greenest Travel Option for You 26
Chapter 7
Rules of Thumb for Getting There Greener 31
Appendix A: Methodology 33
Appendix B: Aircraft Data 36
Appendix C: Automobile Data 42
Appendix D: Rail Data 44
Appendix E: Motor Coach Data 47
Appendix F: Comparing Carbon Footprints for Each Travel Mode 49
Endnotes 51
iv Union of Concerned Scientists Getting There Greener
Figures
Figure 1: Elsen Family Commute vs. First-Class Vacation 7
Figure 2: Elsen Family Commute vs. Lower-Carbon Vacation 9
Figure 3: Effect of Seat Class on Carbon Footprint 11
Figure 4: Carbon Footprint of Nonstop vs. Connecting Flights 12
Figure 5: Carbon Footprint of Driving to Airport for Nonstop Flight vs. Taking Flight with Connections 12
Figure 6: Carbon Emissions Depend on the Route You Take 13
Figure 7: Seat Configurations in the Boeing 737-300 (733) 14
Figure 8: U.S. Airports with the Longest Delays, 2007 15
Figure 9: Total CO2 Emissions, 500-Mile Trip 17
Figure 10: Auto Emission Factors, by Number of People Traveling Together 17
Figure 11: Projected U.S. Road Congestion, 2020 18
Figure 12: Carbon Emissions Depend on the Auto You Drive 19
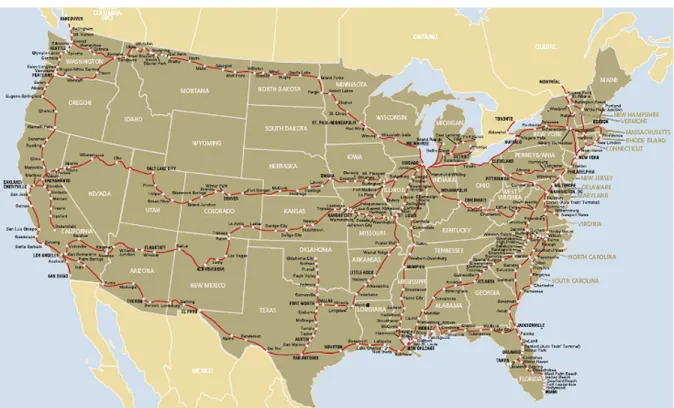
Figure 13: Amtrak’s U.S. Routes 21
Figure 14: U.S. Intercity Bus Service, 2005 24
Figure 15: Selected Routes for U.S. Vacation Trips 26
Figure 16: Comparing Carbon Footprints: Solo Traveler 27
Figure 17: Comparing Carbon Footprints: Two Travelers 28
Figure 18: Comparing Carbon Footprints: Family of Four 28
Figure 19: Harry’s Heading Out Solo 29
Figure 20: Rita and Louie Head to Vegas, Baby! 30
Figure 21: The Elsens Are Going to Disney World 30
Figure 22: Carbon Footprints, by Vehicle 31
Figure 23: Comparing Carbon Footprints across All Modes: Solo Traveler 49
Figure 24: Comparing Carbon Footprints across All Modes: Two Travelers 49
Figure 25: Comparing Carbon Footprints across All Modes: Family of Four 50
v Getting There Greener
Tables
Table 1: Carbon Footprint of Air Travel, by Aircraft 14
Table 2: Estimated Costs of Driving Different Vehicles 19
Table 3: Take Me Out to the Ballgame 22
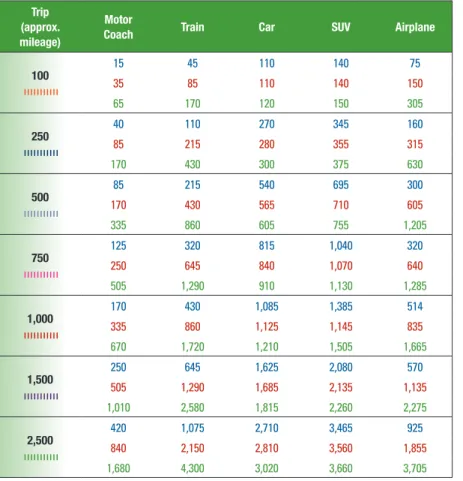
Table 4: Carbon Footprints by Vehicle and Travel Distance 27
Table 5: Distances between Popular Vacation Route Origins and Destinations, in Miles 34
Table 6: Average Aircraft Emission Factors, by Type 37
Table 7: Aircraft CO2 Emissions from Takeoff/Landing and Approach 38
Table 8: Aircraft CO2 Emissions from Ground Operations 39
Table 9: Aircraft CO2 Emissions from In-Flight Cruising (>3,000 ft.) 40
Table 10: Calculations of Seat Area for Sample Aircraft 41
Table 11: Per-Vehicle CO2 Emissions by Vehicle Type and Number of Occupants 42
Table 12: Per-Passenger CO2 Emissions by Vehicle Type and Number of Occupants 43
Table 13: Total CO2 Emissions from Automobiles by Number of Travelers and Distance 43
Table 14: Estimate of Emission Factor for Diesel Rail, 2005 44
Table 15: Estimate of Emission Factor for Electric Rail, 2005 45
Table 16: Total CO2 Emissions from Rail by Number of Travelers and Distance 46
Table 17: Estimates of Emission Factor for Motor Coaches 47
vi Union of Concerned Scientists Getting There Greener
T
his report was made possible through the generous support of Foundation M,Oak Foundation, The Energy Foundation, The Pew Charitable Trusts, The William and Flora Hewlett Foundation, and Wallace Global Fund, with additional support from NoraLee and Jon Sedmak.
Scott Nathanson, Rich Hayes, and Jim Kliesch of the Union of Concerned Scientists (UCS) were instrumental in the conception and production of this report. Deborah Gordon, an independent transportation policy consultant, developed the initial draft, along with the core methodology used to compare fuel cycle carbon emissions from different vacation travel modes. UCS staff members David Friedman, Michelle
Robinson, Patricia Monahan, and Don Anair provided additional review and suggestions. The authors would like to thank Sandra Hackman for her efforts and skill in editing under a tight timeline, and Rob Catalano for his design and layout talents.
We would also like to thank several experts for reviewing specific topics and chapters and providing valuable input. John Davies of the U.S. Environmental Protection Agency commented on the methodology. John Putnam of Kaplan Kirsch & Rockwell, who chairs the Subcommittee on Aviation and Climate Change at the National Academies Transportation Research Board, and Anja Kollmuss, of the Stockholm Environment Institute, reviewed the chapter on air travel. Ross Capon and Matthew Melzer, National Association of Railroad Passengers, and Scott Leonard and Roy Deitchman, Amtrak, reviewed the chapter on rail travel. Dana Lowell of M.J. Bradley & Associates reviewed the information on intercity motor coaches. Stuart Cohen of TransForm (formerly the Transportation and Land Use Coalition) provided helpful guidance on the accounting of motor coach and rail emissions.
The opinions in this report do not reflect those of the individuals who reviewed and commented on it. UCS alone is responsible for the content.
Getting There Greener
ExECUTivE SUmmary
W
hile the idea of “green” vacations has attractedrecent attention, most information focuses on what to do when you get to your destination, not on how to get there. No definitive source has been available to guide travelers toward the greenest travel option—trains, planes, automobiles, or motor coach (a.k.a. buses)—for their particular vacation.
This report turns an analytical eye toward the environ-mental impact of domestic vacation travel, where global warming pollution—largely in the form of carbon dioxide (CO2) emissions—can add up quickly. The results of our analysis may surprise you.
One vacation Can Be Worse Than
Commuting for a year
Meet the Elsens, our eco-con-scious family of four from the suburbs of Chicago. They’ve been trying to minimize their impact on the environment, especially when it comes to their commute. Dad drives a Chevy Malibu for his 10-mile round-trip travel to and from work. Mom recently switched from a Ford Explorer to a more efficient Ford Escape for her daily 25 miles of travel, which includes driving round-trip to work and carpooling the kids to and from after-school activities.
This year, with the holidays coming up, the Elsens decided to pull out all the stops for their first trip to Disney World and use frequent flyer miles to travel first-class. The available flight includes a layover in Houston, but the family figured that deluxe seats were worth the extra time. However, take a look at the resulting carbon footprint (see the figure to the right).
Yes, you’re reading that right—the Elsens’ one vaca-tion splurge produces more than one and a half times the global warming pollution created by their whole year of weekday commuting. These stats are a sobering remind-er that our carbon footprint is not mremind-erely a product of our daily habits, but of our vacation habits as well.
Fortunately, a number of travel options are greener than those the Elsens selected. This new guide gives Americans the tools they need to make sure they’re
getting there greener.
your Guide to a Greener vacation
How are you traveling? Where are you going? Who’s tagging along?
This report provides the first comprehensive analysis— peer-reviewed by experts—of the highest-carbon and lowest-carbon options for vacation travel. In our matrix, three key factors determine the environmental impact of your travel: (1) the type of vehicle you are taking; (2) the distance you are traveling; and (3) the number of people traveling with you. Based on these factors, our analysis can tell you how environmentally sound—or perhaps unsound—your travel plans are.
Of course, Americans’ travel is not a matter of abso-lutes, as different regions have access to different trans-portation options. As you plan your journey, the table on the next page can help you evaluate each option for solo, couple, or family travel. What you find might surprise you, as your best travel bet can shift significantly depending on the distance you travel and the size of your party.
Notes: This comparison assumes that the Elsens’ Chevy Malibu gets 25 miles per gallon, their two-wheel-drive Ford Escape gets 23 mpg, and the family takes four first-class round-trip flights from Chicago to Orlando via Houston. Weekday commuting represents 35 percent of the Elsens’ average annual automobile travel. See Appendices B and C for emission factors of air and automobile travel used in this analysis.
Elsen Family Commute vs. First-Class Vacation
0 2,000 4,000 6,000 8,000 10,000 12,000 Family Annual
Weekday Commute Family First-ClassVacation
(Pounds)
Total CO
2
Union of Concerned Scientists Getting There Greener
vacation Traveler Carbon Guide
For each grouping, travel options are listed from best to worst. Steer toward the greenest and try to avoid those in red!
Notes: We based the color-coded ranking on the distribution of CO2 emissions across modes. The analysis assumes typical car and typical SUV fuel economies
of 23 mpg and 18 mpg, respectively. Train emissions reflect an average of electric and diesel operations. The analysis assumes use of turboprops for 100-mile flights, regional jets for 500-100-mile flights, and narrow-body jets for 1,000-100-mile flights, based on information from the Federal Aviation Administration. We assumed that all flights are nonstop. For more on the emission factors for each mode, see Appendices B, C, D, and E. To compare emissions across modes, see Appendix F.
Best Travel Options: Solo Traveler
100 miles 500 miles 1,000+ miles
Take motor coach Take motor coach Take motor coach
Take train Take train Fly economy
Fly economy Fly economy Take train
Drive typical car Drive typical car Fly first-class
Drive typical SUV Fly first-class Drive typical car
Fly first-class Drive typical SUV Drive typical SUV
B es t W or st
Best Travel Options: Two Travelers
100 miles 500 miles 1,000+ miles
Take motor coach Take motor coach Take motor coach
Take train Take train Fly economy
Drive typical car Drive typical car Take train
Drive typical SUV Fly economy Drive typical car
Fly economy Drive typical SUV Drive typical SUV
Fly first-class Fly first-class Fly first-class
B es t W or st
Best Travel Options: Family of Four
100 miles 500 miles 1,000+ miles
Take motor coach Take motor coach Take motor coach
Drive typical car Drive typical car Drive typical car
Drive typical SUV Drive typical SUV Drive typical SUV
Take train Take train Fly economy
Fly economy Fly economy Take train
Fly first-class Fly first-class Fly first-class
B es t W or st
Getting There Greener
Top Five rules of Thumb for Green Travel
The table to the left gives travelers an easy way to compare travel options to fit their needs. However, our
Getting There Greener analysis also enabled us to create “rules of thumb” to help guide your initial travel choices, and to help you shrink your carbon footprint once you have made those choices. Let’s start with the top travel tips, and then look more closely at each travel mode:
Motor coaches and trains are a carbon bargain.
Whether traveling with a family, with a partner, or alone, those seeking a carbon bargain should seriously consider rail and motor coach travel. Intercity bus options have been on the upswing, as numerous regional carriers now provide coaches with very comfortable seats. And Amtrak offers everything from high-speed rail service in the Northeast to “auto trains” that enable long-distance travel without the wear and tear on your automobile. From a carbon perspective, motor coaches and trains are among your lowest-emission options, especially on shorter (less than 500-mile) trips. Moreover, because motor coaches and trains are often underused, they may offer what amounts to a carbon “free ride.”
Big SUVs and first-class flights usually have the largest carbon footprints. Driving alone, driving inefficient SUVs (with or without other people), and flying first-class are the most polluting ways to go. To reduce your vacation’s carbon footprint, consider other options.
For couples and solo travelers, a nonstop coach flight almost always beats an average car. Carbon from cars and trucks adds up, especially when those vehicles travel long distances and are only partially occupied. If you’re traveling alone or with one other person, you’re usually better off flying direct in coach than getting behind the wheel of a passenger vehicle. This is especially true for trips of more than 500 miles.
To significantly reduce your carbon footprint behind the wheel, drive or rent a more efficient car. If you don’t own a fuel-efficient vehicle, think about renting one when driving on longer trips. The carbon emissions from a large, inefficient SUV are
nearly four times those of a high-miles-per-gallon hybrid such as the Toyota Prius. If hybrids are not available, look into efficient conventional cars, which can ease the environmental harm while cutting your gasoline bill. Many car rental agencies now offer both hybrids and efficient conventional vehicles. Take advantage of them, and take some wear and tear off your car.
Avoid traveling during peak periods. Congestion has a noticeable effect on your fuel consumption and carbon footprint. When a car or SUV is stuck in traffic, its fuel consumption rate can be double the rate it gets at steady cruising speeds. So think about getting a GPS unit for your car that can alert you to traffic hot spots in real time and suggest ways to avoid them. (Some sell for as little as $150.) And think about changing your vacation schedule to avoid peak travel periods that keep you stuck in traffic.
Now that you’ve decided whether to fly, drive, or take a train or motor coach, consider the following additional rules of thumb from our analysis of each travel mode, to shave your emissions even further.
Notes: Assumes a 46-mpg hybrid car, 32-mpg efficient car, 23-mpg typical car, 18-mpg typical SUV, and 12-mpg worst SUV. See Appendix C for details on automobile emission factors.
Carbon Emissions Depend on the Auto You Drive Couple Traveling 500 Miles
0 200 400 600 800 1,000 1,200 Hybrid Car CO2 Emissions
(Pounds per One-Way Trip)
Efficient
Union of Concerned Scientists Getting There Greener
Class matters—save money and save carbon.
When choosing seats, avoid first class. Because a first-class seat takes twice as much space as an economy seat, a first-class traveler on domestic flights is responsible for twice as much carbon as someone flying coach.1
Don’t stop. Choose nonstop flights over connecting flights, especially for shorter trips. Because takeoff, landing, and ground operations produce a lot of carbon, a 1,000-mile nonstop flight from New York City to Orlando can save nearly 35 percent compared with a two-connection flight down the eastern seaboard.
If you must stop, fly straight. Travel websites and agents can show you exactly how many miles your flight will cover. If you can’t get a nonstop flight, fly the most direct route possible to save carbon.
More seats = less carbon. Make the market work. Choose airlines with all-economy seating when possible, as they have smaller per-passenger carbon footprints.
vacation Carbon Tips: air Travel
Solo and couples vacationing? Keep it in the garage. Single travelers driving a typical car leave a large per-passenger footprint, while couples fare only a little better. Unless you’re driving a vehicle that gets more than 45 mpg, look for other options, such as the bus, train, or even plane (economy seating, of course).
Keep the family road-trip tradition alive. If you’re planning on bringing the grandparents or the kids along for the ride, your per-person carbon footprint shrinks accordingly. This makes
cars—especially efficient cars—a low-carbon option for larger groups traveling together.
Be car smart. How you pack, how you drive, and how you maintain your vehicle can save significant carbon and cash.
Congestion guzzles excess gas. Select travel times carefully and consider routes that allow you to avoid getting stuck in rush-hour traffic—especially if your trip takes you through congested areas.
vacation Carbon Tips: automobile Travel
Carbon Emissions Depend on the Route You Take Flying from Charlottesville, VA, to New York City
0 200 400 600 800 Charlottesville- New York City
CO
2
Emissions
(P
ounds per One-Way Trip)
Charlottesville- Washington, DC-
New York City
Charlottesville- Atlanta- New York City
Charlottesville- Cincinnati-
Boston- New York City
Note: This analysis is based on actual routes and the type of aircraft used on each, whether turboprop, regional jet, or narrow-body jet.
Getting There Greener
Take me Out to the Ballgame
Here is one example of a chance to cut carbon emissions by taking the train. Vacationers traveling to Major League Baseball stadiums will find that many are located near train stations:
Ride the rails in the Northeast to cut carbon and congestion. The Northeast Corridor is Amtrak’s most highly developed segment, so you have more options, including high-speed Acela express trains between Washington, DC, and Boston. Because they run on electricity, Northeast Corridor trains are the cleanest rail option.
Even outside the Northeast, an Amtrak station might be closer than you think. Check out your rail options even if you don’t live near a train station. Amtrak’s ThruWay bus service connects most cities to rail stations.
No rental required when training. Unlike most airports, train stations are often right in city centers, so you don’t have to hail a taxi or rent a car to get downtown, saving pollution as well as time. Amtrak also offers an “auto train” option that allows passengers to ride the train while bringing their cars along for the ride.
vacation Carbon Tips: rail Travel
Ballpark (City) Miles from airport Miles from train station
Coors Field (Denver) 25.0 0.4
Dodger Stadium (Los Angeles) 20.0 1.8
Minute Maid Park (Houston) 18.6 1.1
Busch Stadium (St. Louis) 14.9 0.8
Union of Concerned Scientists Getting There Greener
Where you decide to go and how you get there is entirely up to you. It’s your vacation. But prepped with rules of thumb and information about the carbon footprint of your travel options, perhaps next time you will choose to get there greener!
How We Created
Getting There Greener
This analysis is based on energy consumption, ridership (passenger-miles), and carbon dioxide emissions data associated with each mode of travel. We used that
information to compute average “in-use” carbon emissions for each mode, in pounds of CO2 emitted per passenger-mile traveled. We then added upstream CO2 emissions—those associated with extracting, refining, and transporting a given fuel—to yield total carbon dioxide emissions in pounds per passenger-mile. We estimated the amount of emissions accrued per trip by multiplying the resulting emission factors for each mode by distance traveled.
Motor coaches leave carbon in the dust. A couple boarding a motor coach will cut their carbon nearly in half, compared with driving even a hybrid car. And if they take the motor coach rather than flying, they will cut their emissions by 55 to 75 percent, depending on the distance they travel.
Group tours = low carbon. Interstate tour-bus travel has seen a major expansion over the past decade. So think about that group trip in a new, green way.
Not your daddy’s Greyhound. Today many companies have ditched their older buses and offer plush new coaches with everything from seat-back video to satellite radio to wireless Internet connections.
Search and ye shall find. You can jump-start your low-carbon vacation with an Internet search. Bus travel—unlike air and rail travel— does not have a centralized reservations website (such as Orbitz, Expedia, Travelocity, or amtrak.com), but here are a few addresses to you get started: www.gotobus.com,
www.greyhound.com, www.peterpanbus.com,
www.trailways.com/schedules.asp. Happy trails!
vacation Carbon Tips: motor Coach Travel
Getting There Greener
Today’s american vacation Can mean
Big Carbon
Meet the Elsen family—our amalgam of a typical American family. Greg and Ann Elsen, daughter Sarah, and son Joey live in the suburbs of Chicago, and have recently taken steps to reduce their carbon footprint and save money at the gas pump. Greg, for example, leaves his sports car in the garage and drives a Chevy Malibu on his 10-mile round-trip commute to work. Sarah, meanwhile, just traded in their old Ford Explorer for a more fuel-efficient Ford Escape, and is now get-ting about 23 miles per gallon for her 25 miles of daily work and errand travel.
Now Greg and Ann face another decision: how to travel on their vacation to Disney World during Sarah’s upcoming spring break. Despite the expense of flying, they have saved enough credit card points to afford first-class seats for the entire family, and an upgrade on a rental car. But to fly free from Chicago to Orlando, they have to take a connecting flight through a hub city—either Houston or Cleveland. Finding the comfort (and novelty) of first class too good to pass up, the Elsens go for it, and decide to fly to Orlando through Houston.
What the Elsens don’t realize is that global warming emissions from one vacation without a plan to get there greener can greatly exceed emissions produced dur-ing a year of weekday commutdur-ing. It turns out that the emissions from flying first-class and making a signifi-cantly out-of-the-way stopover really add up (Figure 1).
The Elsens’ story is being retold by millions of Americans every year. Vacations account for more than half the trips of 100 miles or more that Americans make each year.2 U.S. residents take almost 650 million trips
of 50 miles or more every summer.3 In 2006, some 124
million Americans took a vacation, traveling an average of 1,200 miles.4
The family car is still the king of American vaca-tion travel, with 82 percent of us hopping in a sedan, wagon, minivan, or sport utility vehicle (SUV) to get away, though generally at least one vacation trip per year is made by plane.5 Conversely, travel on motor
coaches (tour buses, intercity buses) and trains account for only 3 percent of all U.S. vacation travel.6
But these trends are not set in stone. Indeed, as the effects of climate change increasingly affect the way we live and travel, making carbon count as part of a vacation plan could, and should, spur Americans to rethink the way they travel.
This report turns an analytical eye toward this enor-mous transportation challenge, with the goal of helping consumers evaluate the carbon footprint of their vaca-tion travel. Of course, we recognize that people also care about the cost, speed, and flexibility of their trips. With that in mind, this report gives Americans a new analytical tool for identifying greener ways to travel
ChAPTER 1
rUlES OF THE rOad FOr
a GrEEnEr vaCaTiOn
Figure 1. Elsen Family Commute vs. First-Class Vacation 0 2,000 4,000 6,000 8,000 10,000 12,000 Family Annual
Weekday Commute Family First-ClassVacation
(Pounds)
Total CO
2
Emissions
Note: The comparison assumes that the Elsens’ Chevy Malibu gets 25 miles per gallon, their two-wheel-drive Ford Escape gets 23 mpg, and the family takes four first-class round-trip flights from Chicago to Orlando via Houston. Weekday commuting represents 35 percent of the Elsens’ average annual automobile travel.
Union of Concerned Scientists Getting There Greener
to their favorite vacation spots—in a way that makes sense for them.
We have mined information on energy consump-tion, ridership, and carbon dioxide emissions from government and other key sources to calculate carbon emissions from auto, train, bus, and airplane travel.
We have also analyzed how the number of people trav-eling together affects their carbon footprint. Combine that with figures on trip distance, and you have the first tool that can give you your best transportation option, depending on where you are, where you’re going, and how many people are going with you.7
Time to Think Green
With this report, Americans can now begin to truly fac-tor carbon into their vacation planning choices, no matter who is going with them and where they’re headed. Let’s take another look at the Elsens, and two other examples, to see how these choices might work in action.
Flying greener
The Elsens have discovered that flying first-class to Orlando through Houston would create a huge carbon footprint, so they have decided to revise their trip in two ways: they will fly coach and find a nonstop flight. Their new direct coach flight will cut their carbon emis-sions roughly 70 percent compared with their original flight plans. The Elsens have also decided to shave a little more carbon off their trip by using their upgrade to rent a 45-mpg Prius instead of a 19-mpg minivan. The result: a far cleaner vacation (Figure 2).
Motoring greener
Rita and Louie, who live in Santa Ana, CA, want to cel-ebrate their fortieth wedding anniversary in Las Vegas this January. Instead of taking their Dodge Ram pickup, they’ve decided to travel in a luxury motor coach. The coach, which departs from nearby Anaheim and will drop them off on the Strip, will cost less than the drive, while cutting their carbon emissions from 460 pounds to just 90 pounds—a reduction of more than 80 percent.
All aboard greener
Harry wants to escape the Big Apple on the first day of spring for a little fly-fishing in Maine. He has decided to ditch the SUV rental this year and go by train. He will cut his carbon emissions 70 percent by making the switch. And Harry just found out he can save time, too, if he takes the higher-speed Acela electric train to Boston, and then continues on Amtrak’s diesel-powered com-muter rail to Portland.
Travel Trends
The way we travel on vacation greatly affects our carbon footprint. According to recent figures, Americans take most vacations with their partner (62 percent), and the most popular destination is a big city (39 percent).8
As one might expect, we Americans tend to be weekend travelers. We favor Saturday or Sunday departures for trips of fewer than 500 miles, and Friday departures for trips of 500 to 1,000 miles. But these departure times—which vacationers can usually control—affect our carbon footprint, because we often hit traffic, especially on summer weekends. Given that more than half a billion days of vacation go unused in America every year,9 U.S. vacationers could
really get a win-win simply by extending their vacation so they can travel on less-congested days. (See Chapter 3 for more on the effect of congestion on carbon footprints.)
While travel mode and time affect our vacation carbon footprint, so does the dis-tance we’re traveling. Air travel has helped create a “smaller” America by expanding our vacation options. As vacation distances grow, travelers shift away from their autos: about two of three vacation travelers fly or use other modes for vacation distances of 1,000 to 1,500 miles (one-way). And fewer than 16 percent of us drive to our destina-tions when we take vacadestina-tions of more than 1,500 miles.10
Getting There Greener
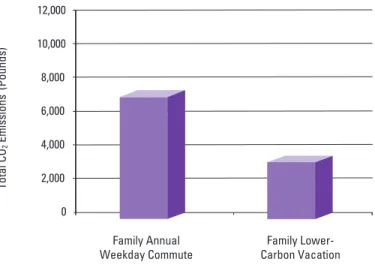
Figure 2. Elsen Family Commute vs. Lower-Carbon Vacation
0 2,000 4,000 6,000 8,000 10,000 12,000 Family Annual
Weekday Commute Carbon VacationFamily Lower-
(Pounds)
Total CO
2
Emissions
Notes: The comparison assumes 250 days of weekday commuting in a Chevy Malibu getting 25 miles per gallon traveling 10 miles per day, and a two-wheel-drive Ford Escape getting 23 mpg traveling 25 miles per day. The family vacation includes four economy-class round-trip direct flights from Chicago to Orlando. Weekday commuting represents about one-third of the family’s total annual automobile travel.
Curbing Global Warming
The U.S. transportation sector alone is responsible for some 40 percent11 of our nation’s fossil-fuel-related
carbon dioxide (CO2) emissions—the primary heat-trap-ping gas responsible for global warming. When released into the air, global warming pollution acts like a blanket, trapping heat in our atmosphere and altering weather patterns globally as well as here in the United States.12
Global warming is well under way, and will have a wide range of consequences for our health and well-being.
Simply put, we need to significantly reduce these heat-trapping emissions to avoid the most harmful effects of global warming.
This report analyzes each travel mode—planes, trains, automobiles, and motor coaches—and offers rules of thumb on green vacation travel. The next four chapters take an in-depth look at your travel options and illustrate several opportunities for cutting carbon. As you will see, a little planning can go a long way when it comes to shrinking your vacation carbon footprint.
Union of Concerned Scientists
0 Getting There Greener
air TravEl
U
.S. air travel has doubled over the past twodecades.13 By 2015, the number of passengers
carried by U.S. commercial airlines will likely hit the 1 billion mark.14 This rise in air travel will continue to drive
up U.S. carbon emissions, because planes leave a large carbon footprint owing to their enormous weight and the long distances they fly. Wide-body jets, for example, can emit 100 pounds of CO2 for every mile they travel; a single cross-country flight can create 150 tons of global warming pollution.
On a more positive note, today’s aircraft—wide-body and narrow-aircraft—wide-body jets, regional jets, and turboprop airplanes—travel relatively full, thereby reducing their
per-passenger carbon emissions. In 2007, 80 percent of all seats were occupied.15 Because of these high occupancy
levels, a given seat is unlikely to go empty: if you don’t take it, someone else probably will, or the airline will fill at least some of the void by adding commercial cargo.16
Still, your in-flight carbon footprint can vary widely, depending on a number of factors. With a little bit of forethought and a closer look at the information you have when you book your flight, you can shrink the emissions from your trip—and help convince the air travel industry to focus its resources on lower-carbon options.
Based on our research, the top green travel tips for air travel are listed below.
*
Coach seats with more legroom—sometimes called “economy plus”—are responsible for an average of 20 percent more carbon than standard coach seats. Note: This analysis is based on actual routes and the type of aircraft used on each, whether turboprop, regional jet, or narrow-body jet.Class matters—save money and save carbon.
When choosing seats, avoid first class. Because a first-class seat takes twice as much space as an economy seat, a first-class traveler on domestic flights is responsible for twice as much carbon as someone flying coach.17
Don’t stop. Choose nonstop flights over connecting flights, especially for shorter trips. Because takeoff, landing, and ground operations produce a lot of carbon, a 1,000-mile nonstop flight from New York City to Orlando can save nearly 35 percent compared with a two-connection flight down the eastern seaboard.
If you must stop, fly straight. Travel websites and agents can show you exactly how many miles your flight will cover. If you can’t get a nonstop flight, fly the most direct route possible to save carbon.
More seats = less carbon. Make the market work. Choose airlines with all-economy seating when possible, as they have smaller per-passenger carbon footprints.
Know your plane. Travel agents and travel sites can also tell you what kind of plane you will be riding. When options are available, choose the plane with the smallest average carbon footprint per seat.
Avoid airports with long delays. Delays while you are on the plane, at the gate, and on the runway waste fuel and produce more carbon pollution. Less-congested airports often mean fewer headaches and fewer emissions.
vacation Carbon Tips: air Travel
Getting There Greener
Class matters—Save money and
Save Carbon
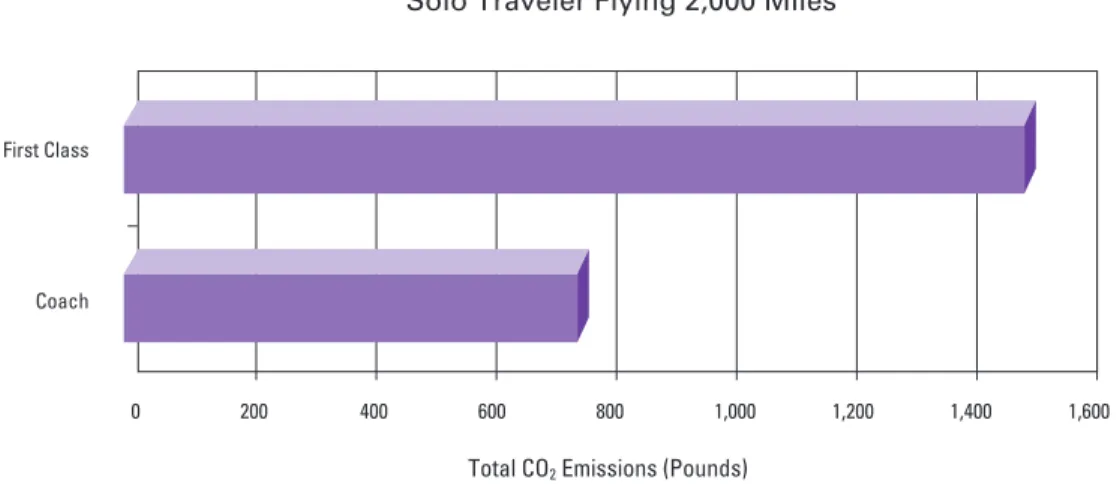
Flying in coach instead of first class is one way to curb your vacation carbon footprint. That is because first-class seats (and coach seats with more legroom, sometimes known as economy-plus) take up more space, reducing the number of passengers that a flight can carry.18
On domestic flights, a traveler in a typical first-class seat is responsible for twice as much carbon as some-one in coach (Figure 3). On international flights, even higher carbon penalties for seating other than coach are likely, depending on how the airline configures the plane. The more expansive the layout—fully reclining first-class seats that convert into beds, the addition of business class, and extra space for flight attendants serving multiple classes—the fewer the passengers who can fit on the plane, translating into more emis-sions per seat.
don’t Stop
It takes a lot of fuel to propel a 65-ton jet 30,000 feet into the air, as well as to safely land it and bring it to a stop. Takeoff, landing, and ground operations produce sizable carbon emissions—as much as 10,000 pounds per plane for a wide-body jet—especially on shorter
trips, where those operations account for a larger share of total emissions. Because connecting flights require two or more cycles of takeoff, landing, and ground operations, your carbon footprint is smaller when you choose a nonstop flight.
For example, as illustrated in Figure 4, you can cut roughly 20 percent of your carbon emissions by flying nonstop from Chicago to Los Angeles—a 2,000-mile trip—rather than taking connecting flights. That per-centage will rise or fall depending on the length of the trip, as takeoff, landing, and “ground ops” account for a smaller fraction of emissions from a longer trip. For example, you can shave nearly 35 percent of the carbon off a 1,000-mile trip from New York City to Orlando by flying nonstop, but just about 10 percent off a 3,000-mile trip from San Francisco to Boston.
When families travel longer distances by air, it may make sense to drive up to 90 miles or even more to avoid connecting flights. As illustrated in Figure 5, a family can plan a trip that produces 25 percent less carbon by driving to a distant airport to fly nonstop, rather than making a single connection from a local airport. In this example, if the family avoids making two connections, they can reduce their carbon emissions by 35 percent.
0 200 400 600 800 1,000 1,200 1,400 1,600 Coach
First Class
Figure 3. Effect of Seat Class on Carbon Footprint Solo Traveler Flying 2,000 Miles
Total CO2 Emissions (Pounds)
Source: See Appendix B for seat calculation estimates, and for information from the Federal Aviation Administration on aircraft emissions. Note: The figure assumes a nonstop flight on an average wide-body jet, and an occupancy rate of 80 percent—the 2007 industry average.
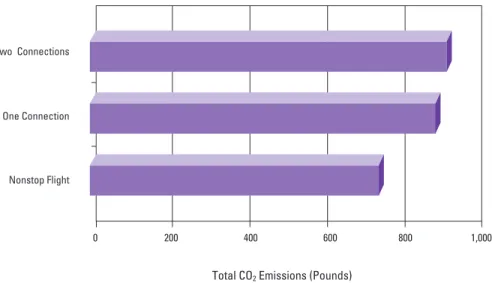
Union of Concerned Scientists Getting There Greener 0 500 1,000 1,500 2,000 2,500 3,000 Fly with 1 Connection
Figure 5. Carbon Footprint of Driving to Airport for Nonstop Flight vs. Taking Flight with Connections
Family of Four Flying 1,000 Miles, Driving 90 Miles
Fly with 2 Connections Take Car (23 mpg) to Airport to Fly Nonstop Take SUV (18 mpg) to Airport to Fly Nonstop Total CO 2 Emissions (Pounds) 0 200 400 600 800 1,000 One Connection Nonstop Flight Two Connections
Figure 4. Carbon Footprint of Nonstop vs. Connecting Flights Solo Traveler Flying 2,000 Miles
Total CO2 Emissions (Pounds)
Notes: The chart assumes that trips with two connections use two turboprop planes that fly 250 miles each and connect to a flight on a narrow-body jet. Trips with one connection use a regional jet traveling 400 miles and connect to a flight on a narrow-body jet. A nonstop flight uses a wide-body jet for the entire 2,000-mile trip. See Appendix B for more on emissions from different types of aircraft.
Note: The figure assumes plane types specified in Appendix B, and “typical car” and “typical SUV” fuel economies noted in Appendix C.
Getting There Greener
if you must Stop, Fly Straight
You can’t always avoid connecting flights, especially if you live in a smaller city with few nonstop options. But when your connecting flights take you in the opposite direction from your destination, your carbon footprint expands dramatically. The goal is to steer clear of mul-tiple connections, and to make a single connection as direct as possible. If you do, you can cut your carbon emissions by a factor of two, three, or more.
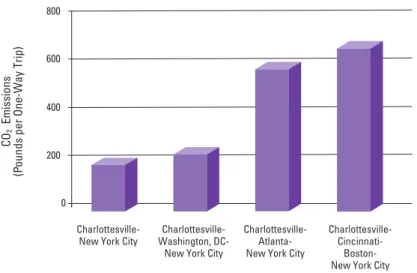
Take, for example, a flight from Charlottesville, VA, to New York City. USAir offers a 310-mile direct flight. Passengers unable to make that flight have several options with connecting flights. For example, United can connect you through Dulles Airport in Washington, DC—a very direct route—for a total of 340 miles. Delta offers a flight connecting through Atlanta, which has you traveling southbound to reach your northbound destination, for a total of 1,190 miles. Delta also offers a 1,285-mile trip detouring through Cincinnati and then Boston. As illustrated in Figure 6, out-of-the-way lay-overs can double or even triple your trip’s emissions.
more Seats = less Carbon
Choose airlines that offer only coach class. Different air-lines configure their airplanes differently, so each plane has its own carbon footprint per seat. In the end, the
more seats an aircraft has, the less carbon-intensive the ride for everyone onboard.
Some airlines remove first-class seats altogether and limit all seating to coach. This approach yields the lowest carbon emissions per passenger—carbon sav-ings of about 10–15 percent, depending on how many seats the airline converts to coach. Travelers choosing airlines that offer only coach class encourage other air-lines to do the same, sending a powerful signal to the market in support of cleaner air travel.
Let’s look at a tale of two planes as an example. A Boeing 737-300 (733) operated by Southwest carries a total of 137 passengers in a single class: economy.19
However, Continental configures the same plane with 124 seats, a dozen of which are in first class. Other options might include flights on United or USAir, which configure their 737s with 120 to 128 seats in a range of classes (Figure 7). In this case, the Southwest flight would reduce average per-passenger carbon emissions by as much as 12 percent compared with those of the other airlines.
Similarly, a Jet Blue Airbus 320 configured with 150 economy-class seats would reduce average per-passenger carbon emissions 8 percent compared with the same aircraft operated by United, which is con-figured with 12 first-class, 36 economy-plus, and 90 coach-class seats.
Figure 6. Carbon Emissions Depend on the Route You Take
Flying from Charlottesville, VA, to New York City
0 200 400 600 800 Charlottesville- New York City
CO
2
Emissions
(P
ounds per One-Way Trip)
Charlottesville- Washington, DC-
New York City
Charlottesville- Atlanta- New York City
Charlottesville- Cincinnati-
Boston- New York City
Note: This analysis is based on actual routes and the type of aircraft used on each, whether turboprop, regional jet, or narrow-body jet.
Union of Concerned Scientists Getting There Greener
Know your Plane
Not all planes are created equal when it comes to car-bon. Extensive data collected by the Federal Aviation Administration show that when planes fly at today’s 80 percent average capacity, a wide-body jet’s in-flight carbon footprint per seat is 7 percent smaller than that of a narrow-body jet. The in-flight carbon footprint of a turboprop and a regional jet is roughly 50 percent larger than that of a wide-body jet.
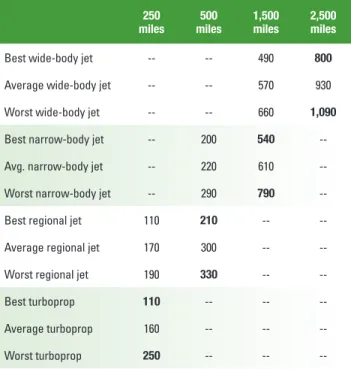
However, you can save even more carbon by avoid-ing flights on the highest-emittavoid-ing aircraft in the fleet, which are often older. The most efficient wide-body jet produces 27 percent less carbon per seat than its least-efficient counterpart (Table 1). The most least-efficient nar-row-body jet produces 32 percent less carbon than the least-efficient version, and the most efficient regional jet produces 36 percent less. The best- and worst-per-forming turboprops have the largest range: the former produces 56 percent less carbon than the latter.
Although average in-flight emissions for today’s regional jets are comparable to those of turboprop planes, emissions during takeoff, landing, and ground operations are 50 percent higher. Again, these vary with the age and design of the aircraft. Older aircraft produce more carbon pollution during ground operations than newer, more efficient models (see Appendix B). If you want to fine-tune your vacation carbon profile, you can look for the type of aircraft when booking flights on the Internet.20
Figure 7. Seat Configurations in the Boeing 737-300 (733)
United “Version 1” Southwest
Total seats: 120 Total seats: 137
First class: 8 seats Economy: 137 seats Economy-plus: 46 seats
Economy: 66 seats
Source: www.seatguru.com and www.tripadvisor.com.
250
miles miles500 1,500 miles 2,500 miles
Best wide-body jet -- -- 490 800
Average wide-body jet -- -- 570 930
Worst wide-body jet -- -- 660 1,090
Best narrow-body jet -- 200 540
--Avg. narrow-body jet -- 220 610
--Worst narrow-body jet -- 290 790
--Best regional jet 110 210 --
--Average regional jet 170 300 --
--Worst regional jet 190 330 --
--Best turboprop 110 -- --
--Average turboprop 160 -- --
--Worst turboprop 250 -- --
--Table 1. Carbon Footprint of Air Travel, by Aircraft Total Pounds of CO2 per Trip for a Solo Traveler
Source: See Appendix B.
Notes: Values in bold are those used for comparison in the text. Figures reflect a direct flight of the specified distance. Turboprops typically travel fewer than 250 miles, regional jets fewer than 1,000 miles, and narrow-body jets fewer than 2,000 miles. A trip that pieces together connecting flights on smaller-range aircraft will require more takeoffs, landings, and ground operations, and thus create more emissions.
Getting There Greener
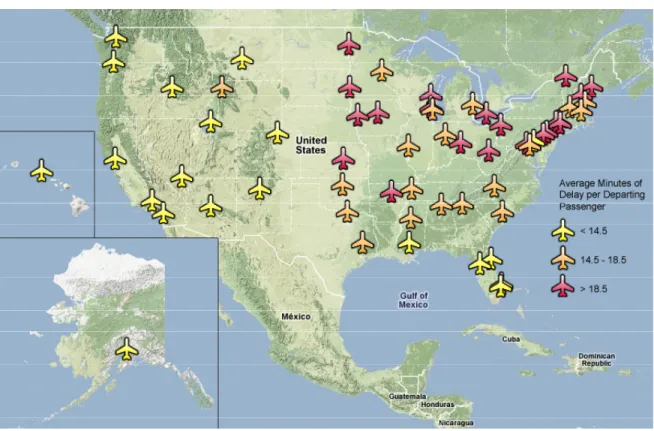
avoid airports with long delays
Delays are costly in terms of carbon emissions. Planes waste fuel when they sit on the tarmac waiting to take off, and when they circle in the air waiting to land. The more congested the airport, the greater your chance of experiencing such delays. For every gallon of jet fuel a plane burns while stuck in traffic on the ground or in the air, it emits 25 pounds of carbon dioxide (including indirect emissions from the extraction, shipment, refin-ing, and distribution of the fuel).21 In 2007, planes
emit-ted 8.5 million metric tons of CO2 during airport delays, from both direct and indirect sources.22 On average,
this amounts to a 6 percent carbon penalty attributable to delays.23
Flights are delayed for many reasons—some of which, such as bad weather and mechanical prob-lems, are beyond a traveler’s control. Still, one of the best ways to actively combat delays is to avoid the most congested airports (Figure 8)—including New York City’s Kennedy and LaGuardia airports, Chicago’s O’Hare, Washington, DC’s Dulles, and the Newark and Philadelphia airports—and choose secondary airports instead. This may mean driving to regional airports, pref-erably those from which economy airlines fly nonstop to your destination. Finally, keep in mind that where you’re landing matters in avoiding delays, not just where you’re departing.
Figure 8. U.S. Airports with the Longest Delays, 2007
Union of Concerned Scientists
Getting There Greener
L
oading up the car to go on vacation is an Americantradition. Nine out of 10 Americans use a personal vehicle when traveling to summer vacation destinations less than 500 miles away.24 And while Americans may
prefer flying to reach vacation spots across the country, automobiles still often figure in their trip plans, whether for getting to the airport or driving around once they reach their destination.
However, automakers have not matched America’s love of the road with a commitment to provide more efficient vehicle options. The average fuel economy of our nation’s cars, minivans, SUVs, and pickups has essentially remained constant for more than two decades. While new federal fuel economy standards— complemented by state clean-car standards—will deliver more efficient options in coming years, today’s
traveler needs to do some serious thinking before hit-ting the road.
To calculate your carbon footprint, all you need is your vehicle’s fuel economy rating. Roughly 25 pounds of carbon dioxide are emitted into the atmosphere for every gallon of gasoline burned—including the emis-sions from extracting, refining, and transporting the fuel.25 Given its fuel economy, the cleanest hybrid
vehi-cle sold today emits 0.54 pound of CO2 per mile driven. If you drive another type of vehicle, your carbon foot-print can expand by more than a factor of four, topping two pounds of CO2 emitted for every mile you drive.
Given those findings, we compare automobiles with other transportation options and offer several recommendations.
Solo and couples vacationing? Keep it in the garage. Single travelers driving a typical car leave a large per-passenger footprint, while couples fare only a little better. Unless you’re driving a vehicle that gets more than 45 mpg, look for other options, such as the bus, train, or even plane (economy seating, of course).
Keep the family road-trip tradition alive. If you’re planning on bringing the grandparents or the kids along for the ride, your per-person carbon footprint shrinks accordingly. This makes cars—especially efficient cars—a low-carbon option for larger groups traveling together.
Be car smart. How you pack, how you drive, and how you maintain your vehicle can save significant carbon and cash.
Congestion guzzles excess gas. Select travel times carefully and consider routes that allow you to avoid getting stuck in rush-hour traffic—especially if your trip takes you through congested areas.
Banish the gas guzzler and rent more MPG.
While technologies exist to bring the fuel econo-my of SUVs up to that of cars, automakers have made most models gas-guzzling carbon emitters. Consider renting an efficient car or hybrid instead of taking a low-mpg car or SUV on vacation.
vacation Carbon Tips: automobile Travel
ChAPTER 3
Getting There Greener
Solo and Couples vacationing?
Keep it in the Garage
When you travel alone in your car or SUV, you create a larger carbon footprint than in nearly any other mode of travel.26 Indeed, in most cases, solo auto travel
produc-es even more carbon than the “bad boy of air travel,” regional jets. The situation improves slightly when two or more people travel together by car, with SUVs still the clear carbon loser (Figure 9).
Keep the Family road-Trip Tradition alive
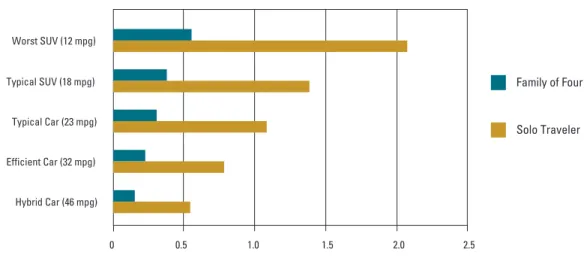
To travel greener, families should keep motoring togeth-er but use a more efficient vehicle. You may consume a bit more fuel loading up your car with more passengers and luggage, but the effect is small compared with the number of seats you occupy. A family of four that packs their luggage into an efficient car for a 100-mile trip will produce 89 pounds of global warming pollution—only about 13 percent more than someone traveling alone in the same vehicle to the same destination. Each per-son in the group is therefore responsible for emitting a little more than one-quarter as much pollution as a solo traveler. This makes efficient cars one of the greenest ways for families to travel together (Figure 10).
0 200 400 600
Number of People Traveling
1 2
800
Figure 9. Total CO2 Emissions, 500-Mile Trip
Typical Car
(23 mpg) Typical Truck/SUV(18 mpg) Regional Jet
CO
2
(Pounds per Trip)
Source: See Appendix C.
Notes: All other graphs show emissions per trip. This graph highlights emissions per passenger-mile, to show how per-person pollution changes based on the number of people in a private vehicle. For more information, see Appendix A.
0 0.5 1.0 1.5 2.0 2.5
CO2 Emissions (Pounds/Passenger-Mile)
Hybrid Car (46 mpg) Efficient Car (32 mpg) Typical Car (23 mpg) Typical SUV (18 mpg) Worst SUV (12 mpg)
Figure 10. Auto Emission Factors, by Number of People Traveling Together
Family of Four Solo Traveler
Note: For more on the emission factors used in this figure, see Appendices B and C.
Union of Concerned Scientists Getting There Greener
Be Car Smart
27Preparation for a long trip is the perfect time to get the car into the best possible shape. A well-maintained vehi-cle is 4 percent more fuel efficient, on average, than a vehicle with problems. Replacing a car’s very dirty air fil-ter can save up to 10 percent on carbon emissions. And inflating your tires to the proper pressure, along with using the oil grade recommended specifically for your car, can shrink your carbon footprint another 5 percent.
A “lead foot” can diminish the benefits of an effi-cient car, however. Driving sensibly—avoiding aggres-sive acceleration and too much braking—can cut carbon 5–30 percent and save you money, too.28 You can also
cut carbon by obeying the speed limit. The rule of thumb is that each five miles per hour you drive over 60 mph is like paying an additional $0.25 to $0.30 per gallon for gas (when gasoline is $3.50–$4.00 per gallon). You can also shave a little carbon by using cruise control, and by avoiding idling whenever possible. You may also want to rethink that extra suitcase: adding 100 pounds can lower a vehicle’s fuel economy by as much as 2 percent.
Congestion Guzzles Excess Gas
Getting stuck in traffic, especially on vacation, can be maddening as you waste precious time, money, energy, and carbon all at once. In fact, your decision on when to hit the road can be a big factor in just how long, and how much fuel, you need to get where you are going. This decision will become even more important as con-gestion on U.S. roads continues to rise in the coming years (Figure 11).
Most Americans who choose to drive to their vaca-tion destinavaca-tion tend to leave on the weekend. Yet Friday, Saturday, and Sunday, especially in the summer, can be problematic in terms of traffic. It is worth consid-ering off-peak departure times and days, such as nights or midday during the week.
Unless you’re driving a hybrid that offers low-speed electric-only operation, crawling in stop-and-go traf-fic at an average of five miles per hour can more than
quadruple your CO2 emissions compared with smooth
travel at 45–55 mph. Carbon emissions from congestion start to grow when speeds drop under 30 mph, and rise precipitously in traffic moving from 0–20 mph.29 Shifting
Figure 11. Projected U.S. Road Congestion, 2020
Source: Federal Highway Administration, 2005, Traffic congestion and reliability: Trends and advanced strategies for congestion mitigation, online at www.ops.fhwa.dot.gov/congestion_report/chapter3.htm.
Getting There Greener
your vacation travel to off-peak times could therefore not only make your trip more pleasant but also shrink your carbon footprint.
Banish the Gas Guzzler and rent more mPG
Unless you’re comparing a Porsche 911 to a Ford Escape Hybrid, a car—rather than an SUV—is usually the greener way to go. Driving an SUV that accommodates a family of six or more can sometimes be comparable to taking two typical cars.30 But if a family can fit in one car,
it’s a far better choice, because the average car emits roughly 25 percent less CO2 than the average SUV.
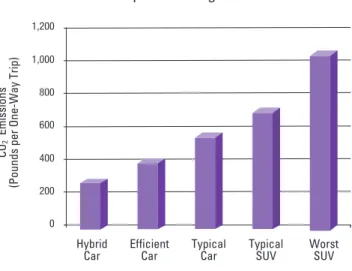
The difference is even more striking when you compare very efficient and inefficient vehicles, such as a gas-sipping Toyota Prius and a Chevrolet Suburban (one of the most inefficient SUVs on the road). A fam-ily of four choosing the Suburban over the Prius would more than triple their carbon pollution (Figure 12). So choose an efficient or hybrid car if you have one, or rent one if you don’t.
You may think driving an inefficient SUV that you already own is essentially free, but doing so actually costs you a bundle. Autos are expensive to operate: the average total cost of fuel, maintenance, and wear and tear ranges from 58.5 cents to 70.0 cents per mile, depending on fuel efficiency.31 As fuel prices rise,
driving your less-than-efficient large SUV or minivan on vacation becomes less economical. In fact, given high gas prices, you will save money by renting an efficient conventional or hybrid sedan instead of driving your SUV (Table 2).
Notes: The figure assumes a 46-mpg hybrid car, a 32-mpg efficient car, a 23-mpg typical car, an 18-mpg typical SUV, and a 12-mpg worst SUV. For more on automobile emission factors, see Appendix C.
Table 2. Estimated Costs of Driving Different Vehicles 500-Mile Vacation
Notes: This table assumes two-person vacation travel over a long weekend; the use of a typical, efficient, or hybrid car at competitive rental rates; and gasoline at $3.50 per gallon.
*Other costs include tires and maintenance at a combined 6.3 cents per mile, and depreciation at an estimated 32.3 cents per mile, based on Oak Ridge National Laboratory, 2008, Transportation energy data book, Tables 10.12 and 10.13. For more information, see AAA, 2008, Your driving costs 2008, online at www.aaaexchange.com/Assets/Files/20084141552360.DrivingCosts2008.pdf. For more on emission factors, see Appendix C.
Rented hybrid car (46 mpg) Rented efficient car (32 mpg) Rented typical car (23 mpg) Owned typical SUV (18 mpg)
Owned worst SUV (12 mpg) Gasoline $38 $55 $76 $97 $146 Other costs* -- -- -- $193 $193 Car rental $120 $100 $110 -- --Total cost $ $ $ $0 $ Total carbon lbs. 0 lbs. lbs. lbs. ,0 lbs.
Figure 12. Carbon Emissions Depend on the Auto You Drive
Couple Traveling 500 Miles
0 200 400 600 800 1,000 1,200 Hybrid Car CO 2 Emissions
(Pounds per One-Way Trip)
Efficient
Union of Concerned Scientists
0 Getting There Greener
A
century ago railroads were the only option forfast, reliable intercity travel. Traveling by train, once a romantic staple of U.S. destination travel, has waned dramatically over the years—from a high of 1.3 billion passengers annually in the 1920s to 26 million in 2007.32 Despite intermittent surges in ridership during
the post–World War II years and again after the oil cri-ses of the 1970s, Amtrak’s share of intercity passenger travel has shrunk to 1 percent as air travel has grown to 40 percent and auto ownership has exploded.33
Amtrak has remained in shaky financial condition since it was created during the Nixon administration, as growth in both population and consumer affluence boosted the popularity of highway and air travel. Public policy has also played a role, as federal and state gov-ernments have spent great sums on auto and airplane infrastructure since the 1950s through cost-sharing agreements for highways and airways. Rail infrastruc-ture has no similar financing mechanism.34
Competing use of rail tracks is another challenge for passenger rail in America today. Roughly 97 percent of Amtrak’s route-miles rely on tracks owned and main-tained by freight railroads, which carry some 40 percent of the nation’s goods.35 This reliance on the freight
network has exacerbated the economic challenges of passenger rail travel compared with other modes.
Given the high priority of air and auto travel among the country’s transportation options, some Americans might assume that the passenger rail system simply “can’t get you there.” But, in fact, it can. You can board an Amtrak train in 46 states and throughout Canada. Amtrak’s ThruWay bus service facilitates rail connec-tions among 800 cities, including popular vacation spots such as Orlando, San Francisco, the Grand Canyon, Yosemite, Las Vegas, and the Big Apple. Amtrak also offers an “auto train” option, allowing passengers to ride the train while bringing their cars along. And unlike most air travel, Amtrak brings you
ChAPTER 4
rail TravEl
Ride the rails in the Northeast to cut carbon and congestion. The Northeast Corridor is Amtrak’s most highly developed segment, so you have more options, including high-speed Acela express trains between Washington, DC, and Boston. Because they run on electricity, Northeast Corridor trains are the cleanest rail option.
See the cities, take the train, cut the carbon.
Even outside the Northeast, trains are a great way to take a family vacation. Families that take advantage of the routes and timetables can see more of America while cutting carbon.
An Amtrak station might be closer than you think. Check out your rail options even if you don’t live near a train station. Amtrak’s ThruWay bus service connects most cities to rail stations.
No rental required when training. Unlike most airports, train stations are often right in city centers, so you don’t have to hail a taxi or rent a car to get downtown, saving pollution as well as time. Amtrak also offers an “auto train” option that allows passengers to ride the train while bringing their cars along for the ride.
Getting There Greener
right downtown, rather than depositing you miles from cities and transit.
Passenger trains produce an average of 0.43 pound of carbon dioxide emissions per passenger-mile. However, America has two distinct types of train ser-vice: that in the Northeast Corridor (from Washington, DC, to Boston), which runs on electricity, and the rest of the Amtrak network, which operates on diesel. Northeast Corridor trains average 0.37 pound of CO2 emissions per passenger-mile while all other Amtrak trains average 0.45 pound—about 20 percent more.36
These emission rates are quite good compared with, say, a typical car with one passenger, which emits 1.08 pounds of CO2 per passenger-mile. Perhaps even more important, however, is the fact that a train often offers what amounts to a carbon “free ride,” as it is an underused travel mode in many areas of the country. (For more information, see Appendix A.)
ride the rails in the northeast to Cut Carbon
and Congestion
Trips along the eastern seaboard between Washington, DC, and Boston are best made on rail. Some of the
nation’s busiest roads and airports are located in this region, from Logan Airport in Boston to New York City’s Kennedy and LaGuardia to Philadelphia Airport to Dulles outside Washington, DC. Congestion can mean that travel by car and plane gets plagued with delays.
Many features of the Northeast rail corridor make it an ideal travel option. Not only does the region have an electric rail system, but the proximity of a number of major metropolitan areas—not to mention coastal areas—allows you to keep your travel distance down while tapping an enormous variety of vacation options. It’s a perfect example of merging travel mode and dis-tance to curb your vacation carbon count.
See the Cities, Take the Train, Cut the Carbon
The Northeast Corridor is not the only place to take a multicity vacation by rail. Indeed, even if you fly to a different region of the country, you may still have the opportunity to take rail to see multiple sites (Figure 13). California, for example, offers intriguing possibilities. With service to nearly 200 California cities (with the aid of connecting bus service), Amtrak can transform vacation travel in the Golden State. Instead of enduring
Source: www.amtrak.com.
Union of Concerned Scientists Getting There Greener
exhausting drives or being stuck in California’s notorious traffic, Amtrak offers a coast-hugging ride with views of the Pacific Ocean.
Other states with extensive Amtrak service and connecting buses to numerous cities include Michigan (46 cities), Oregon (39), New York (32), Washington (31), Florida (30), and Texas (29).
an amtrak Station might Be Closer
than you Think
No train track anywhere near home? Don’t dismiss the train too quickly. Instead, head to www.amtrak.com
and plug in where you want to start and end your trip. Amtrak’s ThruWay bus connections offer extensive ser-vice beyond its 40 major rail station hubs. And given the extremely low emissions from motor coaches, travelers who use them to connect to trains can cut their carbon even further.
no rental required When Training
City limits can be 20 miles or more from major U.S. airports, and connecting highways are often congested with cars during rush hour and with trucks off peak. That isn’t the case with rail. Stations are usually down-town, near hotels, subways, and tourist attractions (see Table 3 for one example). So when you ride the rails, you can often forgo the rental car or the long, often expensive cab ride to your vacation destination, saving money, carbon, and a lot of hassle. No parking chal-lenges, no confusing airport traffic patterns, no parking tickets, no meters, and no gas stations.
Table 3. Take Me Out to the Ballgame
Vacationers traveling to Major League Baseball stadiums will find that many are located near train stations, eliminating the need for another leg of carbon-emitting travel:
Ballpark (City) Miles from airport Miles from train station
Coors Field (Denver) 25.0 0.4
Dodger Stadium (Los Angeles) 20.0 1.8
Minute Maid Park (Houston) 18.6 1.1
Busch Stadium (St. Louis) 14.9 0.8
Getting There Greener
ChAPTER 5
mOTOr COaCH TravEl
T
he bus, a.k.a. motor coach, is perhapsAmerica’s best-kept travel secret. And slowly but surely, motor coaches are making a comeback. Fifty years ago, before the rise of air travel, cheap, rapid intercity bus service was the easiest way to travel in the United States. Soldiers heading to war, young couples honeymooning, families embarking on a new life, kids traveling to summer camp, retirees touring the country—pretty much everyone a generation ago spent some time in a bus terminal. “Go Greyhound and leave the driving to us” was coined in 1956, the same year Congress passed the first highway bill to finance America’s new interstate system.
More recently, of course, Greyhound, Trailways, Peter Pan, and other traditional, depot-based, scheduled bus services have seen their customers dwindle. Still, buses have quietly remained a backbone of American travel, today holding one-third of the intercity passenger
market. While the large companies have continued their service, enterprising smaller operators are entering the motor coach business in droves.37 Offering everything
from group tours to routes in niche-market corridors, these new operators have propelled the entire industry to a higher level of service. For example, Greyhound’s Bolt service in the Northeast now provides low fares on new buses that even have wireless Internet connectivity.
This couldn’t be better news for climate change. Even at today’s average occupancy rates, your carbon footprint will be a mere 0.17 pound for every mile you travel on a motor coach—the smallest footprint of any mode for people traveling alone or with a companion. And as buses fill up, their per-passenger emissions will drop even further.38
And it has never been easier to board a bus. Services expanded greatly in recent years—more than 10 percent from 2006 to 2007 alone.39 Entrepreneurial
Motor coaches leave carbon in the dust. A couple boarding a motor coach will cut their carbon nearly in half, compared with driving even a hybrid car. And if they take the motor coach rather than flying, they will cut their emissions by 55 to 75 percent, depending on the distance they travel.
Group tours = low carbon. Interstate tour-bus travel has seen a major expansion over the past decade. So think about that group trip in a new, green way.
Not your daddy’s Greyhound. Today many companies have ditched their older buses and
offer plush new coaches with everything from seat-back video to satellite radio to wireless Internet connections.
Search and ye shall find. You can jump-start your low-carbon vacation with an Internet search. Bus travel—unlike air and rail travel— does not have a centralized reservations website (such as Orbitz, Expedia, Travelocity, or amtrak.com), but here are a few addresses to you get started: www.gotobus.com,
www.greyhound.com, www.peterpanbus.com,
www.trailways.com/schedules.asp. Happy trails!