Annual Report on Performance Measures for
Specialized Classes and the LSS Department
The Special Education Advisory Committee (SEAC) of the Ottawa-Carleton District School Board (OCDSB) should be acknowledged for its vision and leadership in the area of school board accountability, and the development of performance measures for special needs students. The contributions of SEAC in moving the OCDSB forward in its ability to objectively measure the progress of exceptional pupils cannot be understated. The SEAC was aided in this important endeavor by the senior administration team of the Learning Support Services (LSS) Department, led by Superintendent, Dawn Paxton; Principal, Linda Yan; Vice-Principal, Jennifer Borrel-Benoit; and Manager of Field Services, Dr. Barbara Virley. Of course, the work of implementing and monitoring performance measures could not have been completed without the kind assistance of several members of the LSS
department, who contributed information at various stages of the project. Special acknowledgement should go to the Learning Support Consultants and Steve McKibbin, Program Evaluator who played a critical role in identifying, developing and implementing outcome indicators for special-ized programs, and also to the discipline leads for their cooperation with respect to monitoring outputs for the LSS department: Dr. Timothy Hogan, Lead Psychologist; Dr. June Pimm, Autism Lead; Fraser Blackwell, Lead Social Worker; and Lead Speech-Language Pathologists, Carmen Parsons and Stacey Kay. Finally, two doctoral students at the University of Ottawa, Jessia Kurta and Parastoo Jamshidi, should be acknowledged for their work in supporting this ambitious participatory evaluation project.
Table of Contents
Acknowledgments II
Executive Summary VII
What’s New in the Report VIII
Introduction 1
About the Report 2
Accountability at the Federal and Provincial Levels 2
Accountability in Special Education 2
Accountability at the District (School Board) Level 3
What are Performance Measures? 3
Performance Measurement Rationale 4
Ongoing Performance Measurement vs. Program Evaluation 4
Utilization Focused Participatory Evaluation 4
How to Interpret the Results Included in this Report 5
Section 1: Output Monitoring for the Learning Support Services Department 7
i) Performance Measures for Professional Staff 8
ii) Special Equipment Amount (SEA) Applications 10
iii) Special Incidence Portion (SIP) Applications 11
iv) LSS Digital References Project 12
v) Individual Education Plan Review 13
vi) Mediations and Appeals 15
vii) System Class Applications 16
viii) Transportation 17
Section 2: Specialized Programs with Outcome Indicators Implemented System-Wide 19 i) Learning Disability Elementary (LDE) & Language Learning Disability (LLD) Programs 21
ii) Behaviour Intervention Program (BIP) 25
iii) Autism Program (AUT) Elementary 29
iv) Gifted Program (GIF) 32
Section 3: Specialized Programs with Outcome Indicators Undergoing Pilot Expansion 33
i) Developmental Disabilities (DD) Program Elementary 36
ii) General Learning Program (GLP) Elementary 39
iii) Learning Disability Program Secondary (LDS) 42
iv) Primary Special Needs (PSN) Program 44
Section 4: Specialized Programs with Outcome Indicators Undergoing Pilot Implementation 45
i) Dual Support Program (DSP) 47
ii) Physical Support Program (PSP) 48
iii) General Learning Program (GLP) Secondary 49
Appendix A: Draft Logic Models 50
Appendix B 63
Appendix C 64
Executive Summary
The Annual Report on Performance Measures for Specialized Classes and the LSS Department, is a follow-up to Report No. 11-131 presented to SEAC in June 2011, and to Education Committee in September 2011. The objective of this report is to provide the latest information on the implementation of the OCDSB’s performance measures project for specialized programs and the Learning Support Services (LSS) department. Using the draft Program Logic Model (PLM) developed by Dr. Barb Virley, Manager of Field Services, and Dr. Tim Aubry of the University of Ottawa as a starting point (see Appen-dix A), performance measures have been developed for several areas of the LSS department, and for each OCDSB specialized program. This report is the first of an annual update on these performance measures as of May 31, 2011.
Status of Performance Measures for the LSS Department
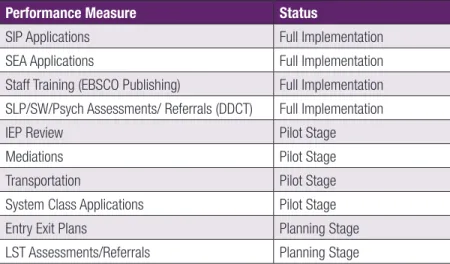
Four performance measures for the LSS department have been fully implemented at the time of this report, including those associated with output moni-toring for: i) Special Education Equipment (SEA); ii) Special Incidence Portion (SIP); iii) staff training (EBSCO Publishing License); and iv) Professional staff (i.e., assessments and referrals). Four other important performance measures for the LSS department are in the pilot stages of implementation, includ-ing: i) the IEP review pilot project; ii) Mediations; iii) Transportation; and iv) System Class Applications. Two other LSS performance measures are currently at the planning stages (see Table 1 below).
Table 1 Performance Measures for LSS Department
Performance Measure Status
SIP Applications Full Implementation
SEA Applications Full Implementation
Staff Training (EBSCO Publishing) Full Implementation SLP/SW/Psych Assessments/ Referrals (DDCT) Full Implementation
IEP Review Pilot Stage
Mediations Pilot Stage
Transportation Pilot Stage
System Class Applications Pilot Stage
Entry Exit Plans Planning Stage
Status of Outcome Indicators for Specialized Programs
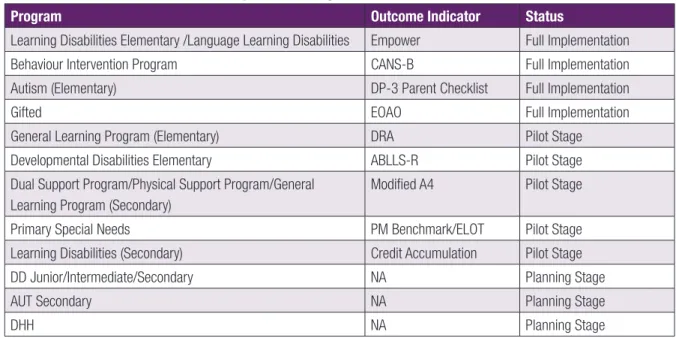
Each of the outcome indicators for specialized programs is at various stages of implementation. According to Table 2 below, five specialized programs have outcome indicators implemented system-wide; two programs are currently at the pilot stage of implementation (these will be expanded for 2011-2012); and five other programs have embarked on pilot implementation starting fall, 2011. These pilot projects range from: i) reinforcing the use of existing in-house data (i.e., PM Benchmarks and/or ELOT); ii) using credit accumulation data available from the student database (i.e., Trillium); or iii) developing additional assessment tools where appropriate (i.e., modifying the Ministry’s A4 document). Outcome indicators for three other specialized programs are at the planning stages.
Table 2 Outcome Indicators for OCDSB Specialized Programs
Program Outcome Indicator Status
Learning Disabilities Elementary /Language Learning Disabilities Empower Full Implementation
Behaviour Intervention Program CANS-B Full Implementation
Autism (Elementary) DP-3 Parent Checklist Full Implementation
Gifted EOAO Full Implementation
General Learning Program (Elementary) DRA Pilot Stage
Developmental Disabilities Elementary ABLLS-R Pilot Stage
Dual Support Program/Physical Support Program/General Learning Program (Secondary)
Modified A4 Pilot Stage
Primary Special Needs PM Benchmark/ELOT Pilot Stage
Learning Disabilities (Secondary) Credit Accumulation Pilot Stage
DD Junior/Intermediate/Secondary NA Planning Stage
AUT Secondary NA Planning Stage
DHH NA Planning Stage
What’s New in the Report
The Annual Report on Performance Measures for Specialized Classes and the LSS Department contains several new additions. First, three new perfor-mance measures for the LSS Department have been included in the report: i) Mediations/Appeals; ii) Transportation; and iii) System Class Applications. Second, new data for the 2010-2011 school-year has been updated for several performance measures already in place (i.e., OCDSB professional staff; LSS digital references project; SEA). Third, results from the May 2011 district-wide PM Benchmark assessments, as well as the EQAO provincial assess-ments, have been included for several specialized programs (credit accumulation data is also presented for the LD Secondary program). Fourth, a new section has been added on the interpretation of assessment data based on a document from EQAO called, “Using Data to Promote Student Success1”. Fifth, a technical appendix has been created which provides supplementary information on several standardized assessments, particularly the validity and reliability issues pertaining to the use of standardized assessments as performance measures. Finally, a new section called, “Implications and Applications of the results”, has been added to certain sections of the report, where appropriate.
Introduction
In January 2009, the Ottawa-Carleton District School Board (OCDSB) passed a motion that called for the implementation of “objective measures of student outcomes used to monitor the effectiveness of the Board’s special education programming and Learning Support Services department” (herein referred to as LSS)2. In a subsequent motion, LSS was asked to prepare an interim report on performance measures for spring 2011, followed by a final review and analysis for Board in September 2011. Thus, the Annual Report on Performance Measures for Specialized Classes and the LSS Department, has been prepared as a follow-up to report No.11-131 presented to SEAC in June 2011, and Education Committee in September 2011. Much of the information contained in this report is based on the draft Program Logic Model (PLM) that was developed in consultation with Dr. Tim Aubry, Senior Researcher of the Centre for Research on Educational and Community Services (CRECS), which identified several potential performance measures for the LSS department, and for the special needs students it serves (see Appendix A).
A Program Logic Model (PLM) is a conceptual framework for understanding a program or service, and is useful in planning and designing performance measures for outcomes-based evaluation3. Program logic models typically depict the inputs, activities, outputs, outcomes and outcome indicators associ-ated with an organization and/or its programs. For example ‘inputs’ for the LSS department include all types of staff (e.g., specialized program teach-ers; administrative and support staff; Learning Support Consultants; and management), as well as the equipment and facilities used for programming purposes, and the total operating budget for the department. ‘Outputs’ represent the concrete results of the activities undertaken by the LSS department, which range from direct instruction to special needs students, to the many types of consultations and evaluations provided by professional staff (see Ap-pendix A for a more fulsome list of activities provided by the LSS department). Outputs are generally accounted for in numerical terms. For example, the percentage of students who succeeded on an assessment, or the number of applications processed in a given year. Finally, program outcomes signify the overall impact on special needs students that the department serves through its programs and services. Outcome indicators specify and/or quantify these impacts over the short, intermediate and long-term, using data sources linked to program goals.
Although the draft PLM outlined many possible outputs and/or outcome indicators for the LSS department and for each specialized program, it is impor-tant to note that the PLM was intentionally prepared as a draft document. It was generally recognized that additional or alternative performance mea-sures would be developed, as determined by program stakeholders through the participatory process of program evaluation. The process of participatory evaluation will be explained in a subsequent section of this report.
It should also be noted that many of the OCDSB specialized programs currently have performance measures in place to monitor program outcomes. In fact, stakeholder groups in these specialized programs, or other department initiatives, have long acknowledged the need for standardized tracking measures of outcomes and/or program activities, and have implemented performance measures to achieve this goal. The actual performance measures associated with each program, as well as those identified for the LSS department, will be reviewed in detail in this report.
Finally, the OCDSB’s efforts in developing and/or tracking performance measures for special needs students is groundbreaking work in the sense that the district will have unprecedented access to data and information that will help to inform the public, senior decision-makers, and program staff about programs and services for special needs students. Going forward, the performance measures project will need to be expanded to include special needs students who are in the regular program as well. At the same time, the performance measures cited in the draft PLM may require further modifications and/or revisions, depending on the information needs of the various stakeholder groups associated with each program.
2 OCDSB Report No. 09-046 to Education Committee April 2009.
About the Report
The following annual report on performance measures is broken into four sections based on output monitoring tools identified for the LSS department, and outcome indicators identified for specialized programs. All four sections of this report provide information about which stage of implementation the performance measure/outcome indicator can be classified (i.e., full implementation, pilot stage or planning stage). Each section provides background information about the performance measures identified for the program, and a detailed plan of analysis, which includes: i) current implementation status; ii) availability of data; and iii) and information about data collection (i.e., timelines, reporting etc).
Accountability at the Federal and Provincial Levels
In many ways, the impetus for adopting performance measures for the LSS department (and its specialized programs) can be traced to recent emphases on accountability at the Federal and Provincial Government levels. On April 1, 2009, the Treasury Board Secretariat (TBS) adopted a policy requiring all federal government departments to fully implement a program evaluation plan by March 31, 20134. The policy requires each department to report on program performance annually, through reporting mechanisms such as, Departmental Performance Reports (DPR’s) and/or Reports on Plans and Priori-ties (RPP’s). In addition, the TBS has developed a Results based Management and Accountability Framework, (RMAF’s) to guide program managers at the federal level in their efforts to measure and report on program outcomes.
Accountability in Ontario’s public education system is built into the Education Act, which sets out the duties and responsibilities of school boards in providing education programs that meet the needs of all (regular and special needs) students. A significant move forward in the accountability of public education in Ontario came when the Education Quality and Accountability Office (EQAO), was established by the Ontario government in 1996. The EQAO is responsible for developing and administering standardized assessments that evaluate the effectiveness of elementary and secondary school educa-tion, and for reporting test results to the Minister of Education and to the public5. A fulsome discussion on the use of EQAO as a performance measure for certain OCDSB specialized system classes is presented in Appendix B of this report.
In 2003, internationally renowned education reformers Ken Leithwood, Michael Fullan and Nancy Watson reiterated the need for accountability in Ontario’s publicly funded school system in their seminal report, The Schools We Need - A New Blueprint for Ontario6. Among the recommendations, the authors concluded that an effective education policy for Ontario public schools must: “introduce an ongoing process of data collection for monitoring the implementation and the effects of provincial policy, to allow modifications or correction of policy initiatives.”
Accountability in Special Education
In response to increased calls for accountability in special education, the Ontario Ministry of Education embarked on an ambitious policy agenda marked by two foundational initiatives specifically focused on special needs students. In November 2004, the Literacy and Numeracy Secretariat was estab-lished, and began implementing the policies contained in its guiding document, Education for All: The Report of the Expert Panel on Literacy and Nu-meracy Instruction for Students with Special Education Needs, Kindergarten to Grade 6. In May 2005, the Minister of Education established the Working Table on Special Education Reform, which examined the systemic changes required at all levels of the public education system, and in particular, funding for special education students. Several recommendations for the future of special education in Ontario were proposed, including improvements in the accountability and reporting requirements for exceptional pupils. Recently, the Special Education Policy and Programs Branch of the Ministry of Education have also focused on a student achievement agenda which prioritizes the ‘balance between a focus on teaching and learning, and the need for appropri-ate process, documentation and accountability’7.
4 Treasury Board of Canada, Policy on Evaluation, April 2009. 5 Education Quality and Accountability Office, www.eqao.com.
Accountability at the District (School Board) Level
Recently, the OCDSB has focused on accountability for special needs students in several strategic documents, including: i) the objectives and goals identified in the OCDSB Strategic Plan8; ii) in the work of the special SEAC Task Force, Special Education Visioning Committee, and Reference Groups; and iii) in the, Special Education Phase II reports9. In a review of accountability efforts related to special education in other school boards across Ontario, the Peel District School Board should also be acknowledged for its work in developing an accountability framework for special education programs and services10. As the Peel DSB authors note, one of the central challenges in accountability at the school board level is to identify ways to demonstrate achievement for students with special needs. Specifically: “Blanket exclusion of students in special education from large-scale accountability assess-ments initially resulted in increased special education prevalence, de facto disincentives for program improvement in special education, and spurious im-provement results for schools.” Indeed, for too long special needs students have been missing from the accountability agendas of public school boards. There are many types of standards and processes for measuring individuals and groups of students through existing Board or Ministry assessments (e.g., PM Benchmarks; EQAO); however, there are few measures specifically designed to measure programs and services for special needs students. Therefore, the purpose of the OCDSB performance measures project is to establish objective measures of student outcomes used to monitor the effec-tiveness of the Board’s special education programming, and LSS department.
What are Performance Measures?
Performance measures are one component of a Program Logic Model (PLM), which specifies the conceptual framework for a program, including what is invested (inputs), the program activities (outputs) and the program goals (outcomes). Performance measures quantify specific activities of a program in addi-tion to the anticipated outcomes of the program in order to: i) aid practiaddi-tioners in making program improvements; ii) provide decision-makers with informaaddi-tion about program characteristics (i.e., inputs; outputs; activities etc.); and iii) provide the public with timely information about various aspects of a program’s performance. Performance measures also specify what tools will be used to evaluate the stated outcomes of each program (see Figure 1 below).
Activity Performance Measure/ Outcome Indicator Data Source/ Collection Method Timing/Frequency of Measurement Responsibility for Collection Reporting Schedule Assessment/Referral Professional Staff
800 SLP Assessments DDCT Ongoing LSS Central Winter
Assessment/Evaluation Specialized Class
IEP IEP Review October & May LSS Central Spring
Academic Programming Specialized Class
EQAO Results Outcome Indicators for Specialized Classes
May LSS Central Fall
Many proposed outcome measures contained in the PLM for the LSS department are currently in use; others are being developed. In some cases, the introduction of outcome measures is novel. Outcome measures of performance are important because they provide an index of how well a program, service or department is achieving its stated objectives. Implementation of data-collection methods through outcome indicators will also assist in providing a sum-mary of the LSS department’s activities and their benefits over time. In this way, the performance measures project will allow the district to report annually to the public, and will also provide program stakeholders with useful information to improve programs. In fact, most program staff acknowledge the need for consistent data collection and reporting practices to monitor the impact of their programs and services on students with special needs.
8 OCDSB, Strategic Plan, 2007-2011.
9 Hewitt, J., and Clarke, G. ,(2006). Special Education Program and Service Review (Phase ll Final Report OCDSB.
Performance Measurement Rationale
The performance measurement rationale underpinning this report is grounded in the legislative responsibilities for school boards outlined in the Educa-tion Act, in Bill 82, and in the Ontario Human Rights Code. Specifically, Bill 82 states that it is “the responsibility of the Minister to require school boards to implement procedures for the early and ongoing identification of the learning abilities and needs of students”. Several Ministry of Education policy imperatives underscore the district’s recent emphasis on performance measurement for special needs students (i.e., Education for All: The Report of the Expert Panel on Literacy and Numeracy Instruction for Students with Special Education Needs, Kindergarten to Grade 6). These efforts have been reinforced by the Working Table on Education Reform11, whose focus is on accountability and reporting, and the Minister’s Advisory Council On Special Education (MACSE) who have also identified accountability and evidence-based practice as key priority areas for special education12. Thus, the LSS Department’s efforts in the area of performance measures are consistent with the provincial government’s goal of increasing public accountability and confidence in the publicly funded education system. A sound performance management strategy begins with identifying expected outcomes in the PLM, and is followed by a plan for reviewing performance measures against stated outcomes. The performance measurement plan should generate evidence-based information which will enable the LSS department to determine whether or not the expected outcomes identified in the PLM are being achieved for special needs students in the district (see Figure 2, below). For each activity, the performance measure or outcome indicator and the data source should be articulated. The data collection method, timing, frequency and responsibility for measurement should also be identified. Finally, the reporting schedule should be specified.
Figure 2: Rationale for LSS Performance Measures
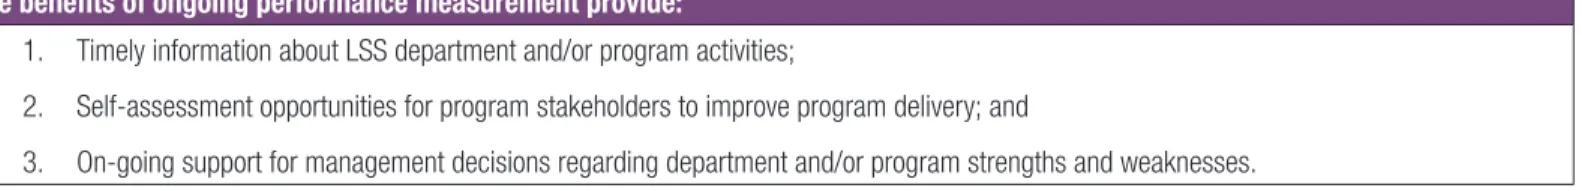
The benefits of ongoing performance measurement provide:
1. Timely information about LSS department and/or program activities;
2. Self-assessment opportunities for program stakeholders to improve program delivery; and
3. On-going support for management decisions regarding department and/or program strengths and weaknesses.
Ongoing Performance Measurement vs. Program Evaluation
For the purposes of the performance measures project, it is important to distinguish between ongoing performance measurement and program evalua-tion. Performance measurement is conducted on an ongoing basis in order to inform program stakeholders (management; practitioners; and the public) about outputs and short term outcomes of a program or service. The performance measurement strategy outlined in this report will generate timely performance information to support ongoing program decision-making, particularly with respect to program strengths and weaknesses13. Conversely,
program evaluation is the periodic assessment of a program’s effectiveness measured against its stated goals. Traditional program reviews, such as formative and summative evaluations are conducted by the LSS department periodically over the medium to long term, and inform management of any problem areas related to outcome achievement, and/or if any major program adjustments may be required. Nevertheless, performance measurement and evaluation are related in the sense that ongoing performance measurement could be subsumed by large-scale program evaluation. In other words, ongoing performance monitoring, conducted on a cyclical basis, can be used in program reviews to help explain program outcomes.
Utilization Focused Participatory Evaluation
In conceiving its performance measures plan, the District has acknowledged that the development of the processes, procedures and mechanisms neces-sary to conduct a systematic review of outcome measures, and the collection of relevant data, may take several years to fully implement. Nevertheless, the LSS is committed to completing the task, and has resolved to take a utilization-focused approach to participatory evaluation. Participatory evaluation is a collaborative process where the program evaluator works closely with key stakeholders at all stages of the evaluation. Michael Quinn Patton, the
researcher credited with formulating the participatory approach to evaluation with a utilization focus purports that:
“Program evaluation is the systematic collection of information about the activities, characteristics and outcomes of programs ... Utilization-focused program evaluation (as opposed to program evaluation in general is evaluation done for and with specific, intended primary users for specific intended uses14.” In participatory evaluation, intended primary users are those whom the evaluation is designed to help, and they should be central in the participatory process. In other words, participatory evaluation gives voice to program stakeholders by involving them in: i) identifying relevant questions; ii) planning the evaluation design; iii) selecting appropriate measures and data collection methods; iv) gathering and analyzing data; and v) reporting the results of the data. The LSS department has taken careful steps to ensure that a utilization-focused and participatory approach has been adopted for the performance measures project. Primary users of the performance measures (e.g., specialized program teachers; learning support consultants; professional staff; senior management) have each been involved at all stages of the project, from identifying potential outcome indicators to implementing performance measures. Specific performance measures for each specialized class, as well as for the LSS department as a whole, are highlighted in the next three sections of this report.
How to Interpret the Results Included in this Report
The principles included in the EQAO guide to school administrators titled “Using Data to Promote Student Success15” are also relevant when interpreting and using the results included in this report for specialized classes. For this reason, the EQAO Guiding Principles and ‘Four C’s of Interpreting Data’ are briefly summarized in Figure 3 below.
Figure 3
Guiding Principles for Interpreting Assessment Data
1. Each special education program and school is unique; therefore, in order to understand student results, it’s necessary to understand the features and characteristics of the community that a school or program serves.
2. In results over time, small increases or decreases from one year to the next are less important than the general trend.
3. It is important to exercise caution when interpreting percentage fluctuations or group differences where the number of students is small. For example, in a class of 20 students, a difference of 10% represents only two students.
4. These assessments capture performance at specific point(s) in time each year. Whenever possible, results should be considered together with other information about student performance.
Four C’s of Interpreting Data
1. Complete? Are these data complete? Are there other contextual data that you need to consider when interpreting the results? 2. Compare? How do the results for one group of students, one program, or results at one point in time compare with the results of other
groups of students, programs, or assessments conducted at other points in time? For example, how do the results of male and female students compare?
3. Consistent? Have there been any inconsistencies in a program’s implementation or in the pattern of students’ participation that may have influenced the results? Are the results consistent with other available information about students’ performance (e.g. report cards, teacher and parent perceptions of student growth over time)? Are the results consistent over time?
4. Concealing? Is there important information about students’ performance or student characteristics that is concealed due to the nature of the assessments or the way that the data are presented? For example, in some cases, focusing on the results of participating students may conceal the fact that many students did not have the cognitive ability to participate in an assessment.
14 Quinn Patton, M., (2002) Qualitative research and evaluation methods. Sage Publications
15 EQAO (2005). Using Data to Promote Student Success: A Brief Guide to Assist School Administrators in Interpreting their Data. Retrieved from www.eqao.com/ pdf_e/05/05p041e.pdf
Section 1
i) Performance Measures for Professional Staff
Output Monitoring Overview:
Program/Service Output Monitoring Tool Monitoring Timeline Data Included at Time of Report
Professional Services (Psychology/ Social Work/Speech Language Pathology)
Assessments and Referrals Annually 2010-2011 school year
Background
The draft Program Logic Model (PLM) for the LSS department identifies several outputs for professional staff (Psychology, Social Work and Speech Language Pathology) with respect to assessments and/or referrals (see Appendix A). Table 3 (below) provides information regarding the average number of assessments and/or community referrals completed by OCDSB professional staff for the 2010-2011 school year. This data was collected from each individual practitioner during the fall of 2011, and overall percentages were calculated relative to the output targets cited in the PLM for each discipline. The figures for Speech Language Pathology (SLP) and Psychology meet the following criteria: i) students referred since September 2010; and ii) for whom testing, feedback and reports had all been completed. Speech (articulation) evaluations as well as full language assessments are also included in the numbers for SLP; whereas the full range of psychological (emotional; personality), educational and risk assessments are included in the figures for Psychology. The figures for psychology do not include the large number of consultations completed or students seen in counselling/therapy.
Results
Results show that both the Psychology and SLP groups greatly exceeded their total output targets for 2010-11 (110% and 60% over their target, re-spectively). It should be noted that there was wide variability amongst practitioners in the SLP group depending on their: i) status as part-time or full-time staff; ii) assignment to specialized programs where there is a strong focus on intervention rather than assessment (e.g., ASD, CB sites, PSN, LLD, etc); and ii) service-delivery approaches (i.e., many practitioners are actively reducing the number of assessments done in favour of consultation/program-ming within classrooms and preventative practices. This aligns with current departmental directives as per the tiered intervention model). The Social Work group attained two-thirds of their total output target and/or average target per FTE. Nevertheless, the Social Work group, like all OCDSB profes-sional staff provides a wide range of services to students beyond just community referrals. Therefore, this output targets for the Social Work group may require modifications in the future.
PSSP
Table 3: Number of Assessments/Community Referrals for Professional Staff, by FTE (Full-time Equivalent) 2010-2011 Group Output Target * Outputs
Completed
% of Target FTE Avg/FTE
Psychology 680 1429 210% 18 79
SLP 800 1278 160% 22 58
Digital Data Collection Tool (DDCT)
The LSS department has recently implemented a new output monitoring tool for professional staff called, The Digital Data Collection Tool (DDCT). The DDCT is an electronic data collection system which tracks the full range and type of services provided to students by the district’s professional staff. The DDCT is a computerized system linked to Trillium using an active directory model that is customized to the user ID, similar to an online banking system. Beginning in September 2011, the DDCT will replace several of the current processes and procedures used to obtain output monitoring information for professional staff, such as numbers of assessments and/or referrals.
Data on professional services is collected in several other major Ontario school boards with similar demographics (e.g., Peel DSB) and in the Ottawa Catholic School Board. In fact, the DDCT is modeled after the electronic tracking mechanism in place at Peel DSB for Speech Language Pathology. How-ever, the OCDSB model will also include the Psychology and Social Work groups in order to obtain standardization across all three disciplines. It should be noted that SLP and Psychology groups have previously used paper-based methods to collect data, while the Social Work group has previously used a digital system called Paradox to track services. The DDCT has streamlined services and allowed for consistency among the three groups of service providers.
In keeping with the participatory approach to evaluation, focus groups in each discipline were held in April 2010, and working groups were established to determine the best way to collect information for the DDCT. The scope and work-flow of the DDCT system was finalized by Business and Learning Technologies in May, 2010, based on input from management, discipline leads and information from the working groups. B< developed the system in summer 2010, and working groups previewed a system demonstration in the fall of 2010. The working groups from each discipline began piloting the DDCT application in April 2011, and feedback from the pilot groups was used to modify the system in preparation for system-wide implementation in fall 2011. Training on the DDCT for all professional staff took place in spring and fall, 2011.
The data yielded from the DDCT will provide the LSS department with rich information regarding professional support staff services. In addition, the sys-tem will support senior management in their effort to understand practitioner caseloads in each discipline. Ultimately, from a utilization focused perspec-tive, the DDCT will also provide program staff in each discipline with information about the nature and range of services they provide to students.
ii) Special Equipment Amount (SEA) Applications
Output Monitoring Overview:
Activities Output Monitoring Tool Monitoring
Timelines Data Included At time of Report
Special Equipment Amount (SEA) SEA Applications Annually 2010- 2011
Background
Beginning in May 2010, the Special Equipment Amount (SEA) was revised to include two components: i) SEA Per Pupil Amount; and ii) SEA Claims-Based Amount. This new SEA Per Pupil Amount component is part of a 5-year plan to convert part of the SEA funding (approximately 85% of funds) into a single SEA Per Pupil Amount for all school boards by 2014–15. In 2010–11, each school board received a SEA Per Pupil Amount allocation, which includes a base amount of $10,000 in addition to an amount based on average daily enrolment (ADE). The SEA Per Pupil Amount component supports the purchase of all computers, software, computing related devices and supporting furniture identified for use by students with special education needs, as well as all training and technician costs for SEA equipment, in accordance with Ministry guidelines. In order to increase efficiency, the Ministry of Education encourages sharing of equipment purchased through SEA. Technician and training costs are no longer required through the claims process. The SEA Claims-based funding is accessed through a claims-based process, and supports the purchase of other non-computer based equipment, to be utilized by students with special education needs, including sensory, hearing, vision, personal care and physical assist equipment.
Results
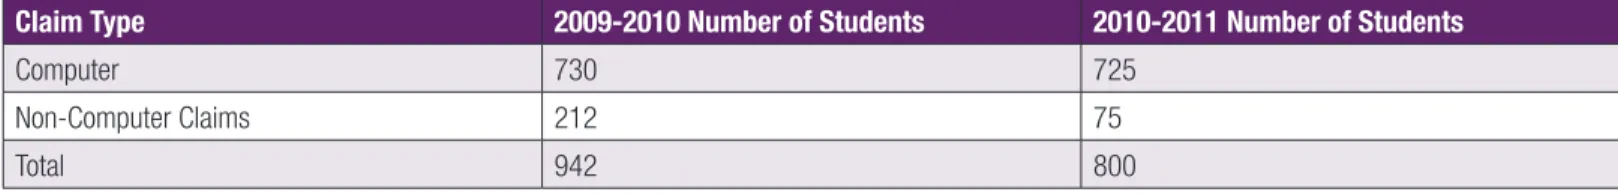
Table 4 (below) provides information on the types of claims that were approved in 2010-2011. The draft PLM (see Appendix A) identifies an output target of 600 SEA Applications completed in a school year. Thus, the LSS department exceeded the SEA output target by over 30%. The total board funding claim to the Ministry for 2010-2011 was $1,560,816.85. Finally, Report No. 09-046 (April 2009) to Education Committee, indicates that where SEA applications are concerned, LSS staff will develop pre-and post measures to demonstrate the impact of new programs on student learning. The goal is accountability. Going forward, LSS may develop a process so that each application made for SEA computer software and/or physical support equipment clearly demonstrates the rationale for how the equipment will benefit the child and how this benefit will be measured.
SEA
Table 4: SEA Claims 2009-2011
Claim Type 2009-2010 Number of Students 2010-2011 Number of Students
Computer 730 725
Non-Computer Claims 212 75
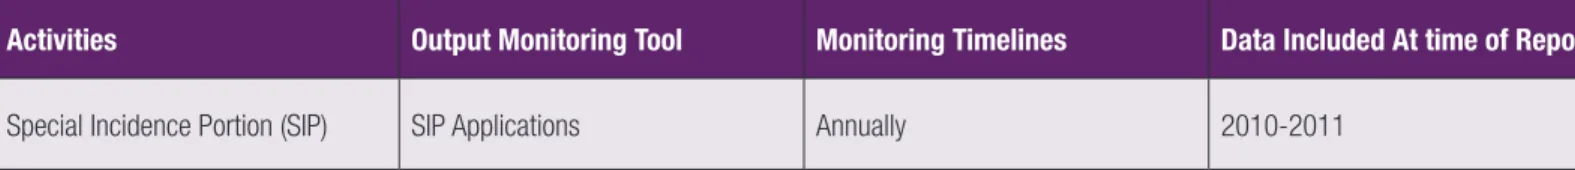
iii) Special Incidence Portion (SIP) Applications
Output Monitoring Overview:
Activities Output Monitoring Tool Monitoring Timelines Data Included At time of Report
Special Incidence Portion (SIP) SIP Applications Annually 2010-2011
Background
The Special Incidence Portion (SIP) application process allows the OCDSB to obtain additional funding from the Ministry for extremely high needs students. The funding is intended to offset the costs associated with high levels of staff support for these students. Through SIP, the Ministry provides funding for staff supports to ensure that the health and safety needs of students who require extraordinarily high levels of support related to their dis-abilities and/or exceptionalities are met. To be eligible for SIP funding, the board must meet the criteria for students who require more than two full-time equivalent (FTE) staff who provide intensive support for activities associated with the applicant. There are three types of SIP claims: i) those for students diagnosed with a medical condition: ii) those for students requiring intensive support for behaviour that is injurious to self and/or others; and iii) those for students who require support for both health and safety reasons. In order to be eligible for SIP funding, the board must demonstrate that the ap-plicant requires support from two FTE staff for at least 10% of the school day (i.e. 30 min/day), and on a regularly scheduled basis, for the duration of the school year. These requirements, including the names of staff members who support the student, must be documented in the student’s Individual Education Plan.
Results
The LSS PLM indicates that the LSS department will monitor the number of SIP applications that were completed each year. In 2010-2011, there were a total of 57 SIP applications submitted to the Ministry on behalf of the district. Table 5 (next page) provides a breakdown by school or program. The aver-age amount per applicant was $22,782 for a total of over $1.3 million in funding.
SIP
Table 5: SIP Applications 2010-2011
School Program # of Students
Clifford Bowey Public School DD 18
Crystal Bay Centre for Special Education DD 11
Ottawa Technical Secondary School Physical 5
Ottawa Technical Secondary School Autism 5
Centennial Public School Physical 4
Sir Guy Carleton Secondary School Physical 3
By Program Autism BLV Dual Support 4 4 3 TOTAL 57
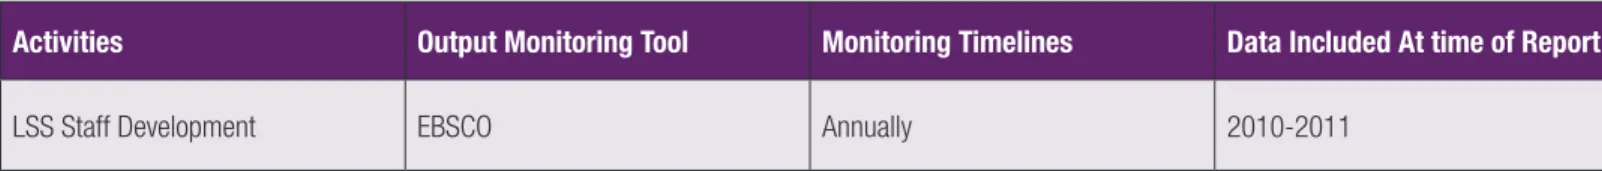
iv) LSS Digital References Project
Output Monitoring Overview:
Activities Output Monitoring Tool Monitoring Timelines Data Included At time of Report
LSS Staff Development EBSCO Annually 2010-2011
Background
As part of its efforts to address the professional development needs of its staff, LSS has recently negotiated a licensing agreement with EBSCO Publish-ing Ltd., which features digital access to full-text research articles from three reputable academic sources: i) Education Research Complete; ii) Soc Index; and iii) PyschArticles. The LSS/EBSCO license includes many of the world’s best academic journals, including the entire suite of American and Canadian Psychological Association Journals, and many other highly regarded periodicals such as the Canadian Journal of Education; the Journal of Social Work in Education; and the Journal of Applied School Psychology—to name but a few. This exciting new professional development initiative provides LSS staff with access to the latest research on topics of interest that will be useful in their working and/or professional learning communities. Training sessions on various aspects of the EBSCO web portal (e.g., basic or advanced searching) were made available to all staff in Spring 2010. The EBSCO project was initiated on a pilot basis for the 2009-2010 school year, and due to its success, the LSS department renewed the license for 2010-2011.
EBSCO Usage Report: 2010- 2011
EBSCO offers an administration management portal which allows the LSS department to determine the extent to which these resources are being ac-cessed by staff on a monthly, or yearly basis. In addition, the usage report breaks down which types of content were searched or downloaded during the reporting period. Results from 2010-2011 show that over 2,000 searches were conducted between the databases (see Table 6, below). Notably, the number of searches has approximately doubled in all three databases (Education Research Complete, PsychArticles and SocIndex) since last year. The LSS department will continue to promote the use of this valuable resource through various communication mechanisms, such as the department newsletter, and by creating a folder on BEAM which contains EBSCO training resources. Going forward, the collection of accurate usage statistics will be an important way to monitor the impact and utility of the EBSCO/LSS licensing agreement.
Digital References
Table 6 EBSCO Database Statistics, 2010-2011
Education Research Complete PsychArticles SocIndex
Sessions 172 105 86
Searches 1019 617 452
v) Individual Education Plan Review
Output Monitoring Overview:
Activities Output Monitoring Tool Monitoring Timelines Data Included At time of Report
IEP Review IEP Evaluation Tool Annually Pilot Data, May 2011
Background
In April 2011, Learning Support Services (LSS) initiated a review of Individual Education Plans (IEPs) from all specialized programs. The goal of the IEP Review was to align the department’s performance monitoring practices with the Special Education Policy and Programs Branch of the Ministry of Education in its recent efforts to focus on: i) improved outcomes for students receiving special education; ii) increased capacity of schools to effectively meet the needs of a variety of learners in settings ranging from regular to self-contained classrooms; and iii) programming in the IEP that is linked to the Ontario Curriculum and the Provincial Report Card16. As such, all specialized program teachers were asked to select one student IEP from their class, and forward it to the Learning Support Consultant (LSC) assigned to their program. Committees were assembled in May 2011 to review the selected IEPs for each specialized program. Prior to their submission, all student and teacher identification information was removed from the sampled IEPs to maintain anonymity and confidentiality.
A stratified sampling strategy was used to address the variability in enrollment across specialized programs, where a fixed number of IEPs was selected, based on the relative number of classes in each program. The number of classes within any given specialized program can be categorized into four groups: group 1 (less than 5 classes); group 2 (6- 10 classes); group 3 (11-15 classes); and group 4 (more than 15 classes). As such, the maximum number of IEPs included in the review for each specialized program ranged from a maximum of eight IEPs in large programs (e.g., Gifted) to minimum of one IEP in smaller programs (e.g., Deaf and Hard of Hearing). Central teams composed of LSCs reviewed the sampled IEPs using a standard evalu-ation tool, which focuses on the following important aspects of IEP development: i) the extent to which the stated learning expectevalu-ations satisfy SMART goal guidelines; and ii) the extent to which there is alignment between the IEP goal, and Term 1 of the Provincial Report Card. Data yielded from the IEP review will be used to inform future training opportunities for specialized program teaching staff and in further updates to the OCDSB Quality Program In-dicators. In the second year of the review, it is anticipated that there may be several modifications to the pilot, including: i) some changes to the sampling of IEPs; ii) gathering IEPs for special needs students in the regular program in addition to those from specialized programs; iii) changes to the composi-tion of central review teams reviewing IEPs (i.e., including school staff in the review); and iv) the evaluacomposi-tion tool may be expanded.
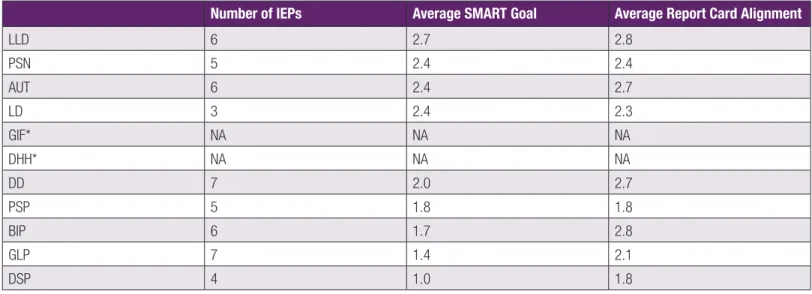
Results
A total of 51 IEPs were analyzed centrally for the purposes of this report, representing all specialized programs in the OCDSB. Each IEP was evaluated based on the extent to which it met SMART goal criteria (Specific; Measurable; Achievable; Results oriented; and Timely) and the extent to which it was aligned with the Report Card. The average overall score for all programs on the SMART goal criteria was 2.0, and the average report card align-ment score was slightly higher at 2.4. Table 7(next page) demonstrates that there is a high degree of variability across specialized programs in terms of SMART goal development, ranging from a low of 1.0 in the DSP program, to a high of 2.7 in the LLD program. Variability in SMART goal development may also exist within a program, but across panels. For example, the average score for BIP elementary was 2.5, whereas the average score for BIP secondary was 1.0. Generally speaking, SMART goal development was also related to report card alignment, with one notable exception in the Gifted Program.
However, given the small number of IEPs analyzed within each program, interpreting the results by program should be done with caution. It should also be noted that in some programs, SMART goals are not normally included on the IEP (e.g., LD Secondary; Gifted); therefore, these were not included in 16 Special Education Policy and Programs Branch, Ministry of Education Ontario. Closing the Gaps for Students with Special Education Needs In Ontario: Research Trends and Capacity Building. Education Research Symposium February 2009.
the current analysis. Nevertheless, the LSS department may wish to consider the results from the IEP review pilot project for professional development purposes across the district’s specialized programs, particularly in those programs that scored less than 2 on the standardized evaluation tool (i.e., demonstrates some effectiveness). Indeed, feedback from the IEP review committees indicates that the area of IEP development should be a focus for the department in 2011-2012.
IEP Review
Table 7: IEP Pilot Review 2011, by Program
Number of IEPs Average SMART Goal Average Report Card Alignment
LLD 6 2.7 2.8 PSN 5 2.4 2.4 AUT 6 2.4 2.7 LD 3 2.4 2.3 GIF* NA NA NA DHH* NA NA NA DD 7 2.0 2.7 PSP 5 1.8 1.8 BIP 6 1.7 2.8 GLP 7 1.4 2.1 DSP 4 1.0 1.8
vi) Mediations and Appeals
Output Monitoring Overview:
Activities Output Monitoring Tool Monitoring Timelines Data Included at Time of Report
Mediations and Appeals Number of mediations and appeals Annually 2010-2011
Background
According to the Identification Placement and Review Committee Parent Guide published in March 2011 by Learning Support Services and Communica-tions and Information Services, mediation and appeals occur in regards to the procedures involved in identifying a student as ‘exceptional’ or deciding the student’s placement (i.e., regular program or more specialized placement). According to Policy P.117.SES of the Special Education Appeal Board (SEAB), if a parent is not in agreement with the decision of the Identification, Placement and Review Committee (IPRC) they may file notice to appeal a decision at a hearing with the Special Education Appeal Board (SEAB). The Board and the student’s parents both choose an impartial representative, meaning that the representative does not have previous exposure to the child or the issue. The parent and Board representatives decide on a Chair for the appeal committee.
An appeal is considered cancelled if the disagreement regarding the student’s placement, program or exceptionality is resolved via mediation. Media-tion involves an impartial third party who assists parents and the Board in achieving a soluMedia-tion that best meets the needs of the student. If the appeal is completed, the Chair prepares a written statement of recommendations either in agreement or disagreement with the decision made by IPRC, and may make new recommendations to the Board. Parents are given the opportunity to witness the deliberation between the SEAB and the Board. The Board then decides what action to take regarding the student after considering the recommendation from SEAB. All parties involved are subsequently notified regarding this action.
Results
In 2010-2011, five appeals were made, two appeals were pending, seven appeals were cancelled and one appeal was carried forward into 2011-2012. Of the five appeals made, two of these cases proceeded to the mediation process.
vii) System Class Applications
Output Monitoring Overview:
Activities Output Monitoring Tool Monitoring Timelines Data Included at Time of Report
System Class Applications Number of system class applications Annually 2010-2011
Background
The LSS department works with schools, principals and transportation personnel with placing students in specialized programs. Specialized program ap-plications are completed by school staff (LSTs), based on recommendations made by the multi-disciplinary teams of professional staff. The Identification Placement Review Committee (IPRC) meets during the review process to examine available information about the child, which may include educational, medical, speech and language, social work and/or psychological assessments. This committee may also interview the child and consider any additional information the parent has submitted to the committee. In making its placement decision the committee considers whether placing the child in a regular classroom with special education services is appropriate. If it is determined that placement in a regular classroom would not meet the child’s needs the committee would make the recommendation for placement in a specialized program in writing (Identification Placement and Review Committee Parent Guide, 2011). Subsequently, the committee makes placement recommendations in the spring of each year. Principals receive the placement recommen-dations and are asked to confirm parent acceptance.
Results
Table 8 (next page) provides a breakdown by program, and panel, of the total number of system class applications for all specialized programs submitted for 2010-2011 school year (N=700). Applications for elementary panel programs greatly exceeded those for the secondary panel (i.e., 82% vs. 18%). By program, the greatest number of applications received was for the Gifted program (34%), followed by the Learning Disabilities and General Learning programs (13% and 19%, respectively). The Deaf and Hard of Hearing and Aspergers Programs received the fewest number of applications (i.e., <1%). Finally, the Autism and Developmental Disabilities programs received significantly more elementary panel applications than secondary applications.
Mediations/Appeals
Table 8: System Class Applications by Program, fall 2010
Program New Applications Elementary New Applications Secondary
Aspergers Program - 5
Autism Program 38 2
Behaviour Intervention Program 28 14
Developmental Disabilities Program 18 4
Dual Support Program 4 6
General Learning Program 50 44
Learning Disabilities Program 88 46
Language Learning Disabilities Program 60
-Primary Special Needs Program 43
-Physical Support Program 4 7
Deaf/Hard of Hearing Integrated Program 1 0
Gifted 238
viii) Transportation
Output Monitoring Overview:
Activities Output Monitoring Tool Monitoring Timelines Data Included at Time of Report
Transportation of special needs students
Number of Special Needs Students receiving transportation
Annually 2010-2011
Background
According to Section 3.6 of the Student Transportation Policy (P.068.TRA), the Board agrees to offer special needs transportation for students who are not able to use regular transportation, have a medical certificate and the Special Education Department has concluded that regular transportation is not appro-priate. Also according to Section 3.6, of the policy, school bus drivers will transport each student into the care of a responsible adult to ensure that special needs students are transported safely. If a student requires assistance getting on or off the bus, this assistance must be delivered by the parent/guardian or school personnel. If a responsible adult is not available, the school bus driver will relay this information to the Ottawa Student Transportation Authority (OSTA). In addition, transportation is provided for special needs students who attend summer school programs approved by the Board. Going forward, LSS may develop a concrete process in conjunction with OSTA to more efficiently communicate the transportation needs of the students to the drivers.
Results
According to representatives from OSTA, the Board provided more than fifteen hundred OCDSB specialized class students with transportation in 2010-2011. This figure represents both elementary and secondary students. The breakdown by program (see Table 9, below) shows that the Developmental Disabilities and General Learning Programs had the most students receiving specialized transportation (over 350 students each) and the Learning Foundations Program had the least number of students receiving specialized transportation (15 students).
Table 9 Breakdown by Program of Students Receiving Specialized Transportation Program Total AUT 84 LD 50 LLD 104 DD 381 GLP 357 LFP 15 PSN 81 PSP 47 DSP 40 BIP 92 GIF 308 TOTAL 1,559
Section 2
i) Learning Disability Elementary (LDE) & Language Learning Disability (LLD) Programs
Output Indicator Overview:
Program Outcome Indicator(s) Administration Timelines
Data Included At Time of Report
LDE & LLD Empower Sept/May 2010-2011
EQAO (Primary and Junior) May Spring 2011
PM Benchmarks Sept/May 2010-2011
Background
The Empower Reading Program (ERP) was developed by the Learning Disabilities Research Program at Sick Kids Hospital in Toronto. The ERP has been purchased by the LSS department, and is the main outcome indicator identified for the literacy component of the LD elementary (LDE) and LLD pro-grams. The Education Quality and Accountability Office (EQAO) primary and junior provincial assessments, as well as the PM Benchmark system assess-ments have also been identified as appropriate outcome indicators for these specialized programs.
The LSS department pilot tested the Empower Reading Program during the 2009-2010 academic year, with a total of nine elementary schools involved in the initiative. In 2010-2011, the ERP was partially expanded to include students in the integrated LDE and LLD programs, and a total of 31 additional special education teachers were trained to use the program. Thus, all schools in the district offering the LDE or LLD specialized program, as well as two BIP (Behaviour Intervention Program) sites, had a trained ERP teacher. Full expansion of the ERP into all integrated LDE and LLD sites across the district is being considered for the 2011-2012 school year.
Empower Assessments Description
The following assessments were used to evaluate the impact of the ERP: i) Letter-Sound Identification; ii) Sound Combination; iii) Challenge Words; and iv) Phonological Awareness. Each of these sub-tests is used to evaluate reading skills that are targeted during the Empower reading program. Specifi-cally, during the Letter-Sound Identification test, students are presented with written letters and letter combinations and asked to vocalize the sounds that individual letters of the alphabet can make. The Sound Combinations test includes letter strings that frequently appear together in words. In order to score a point, students are required to sound-out the letter strings (Cirino et al., 2002). The Challenge Words test consists of over 100 multisyllabic words that students have not been directly instructed to read. Students must apply the reading skills they have acquired in order to read these words (Lovett et al., 2000). Lastly, the Phonological Awareness assessment measures students’ ability to recognize and vocalize the units of sound in words.
Data Analysis Framework
Assessment data from the 2010-2011 school year have been analyzed below for students in the LDE and LLD specialized programs who received the ERP. Descriptive statistics (i.e., number of cases and means) are included for each of the Empower assessment subtests, as well as for the PM Bench-mark, and the primary and junior level EQAO assessments. Results are presented for students overall, by program, by panel, and by gender. Growth scores (changes in scores) from the fall to the spring assessment are also presented for the Empower program.
Empower Results
Overall Results
The number of students who received the ERP increased from 65 in 2009-2010 to 345 in 2010-2011. Of these, 162 were in the specialized LDE and LLD programs, which represents 83% of the students in these programs (n=196). The majority of the participants in the ERP were males in the primary grades of the LLD program. Overall, students’ assessment scores significantly increased from the fall 2010 to the spring 2011 assessment period (see Figure 4 on next page).
Figure 4
Empower Assessment Results, 2010-11
5 10 15 20 25 30 35 40 45 50 55 Letter/Sound ID Sound
Combinations Challenge Words Phonological Awareness Fall Spring
Results By Program
The reading scores of students in both the LDE and LLD programs significantly increased from the fall 2010 to the spring 2011 assessment. Read-ing scores of students in the LDE and LLD programs increased about equally on all Empower assessments except for Phonological Awareness. On the Phonological Awareness assessment, the scores of students in the LLD program increased significantly more than students in the LDE program. This finding signifies that students in the LLD program acquired more skills related to recognizing units of sounds in words compared to students in the LDE program. However, students in the LLD program also scored significantly lower on the baseline Phonological Awareness assessments than students in the LDE program (i.e., the average score for LLD students was 25 whereas the average score for LDE students was 38).
Interestingly, LLD students also had significantly lower scores on the post-test assessments compared to LDE students (i.e., Letter-Sound Identification, 33 vs. 35; Sound Combinations, 15 vs. 18; Challenge Words, 21 vs. 33; Phonological Awareness, 33 vs. 41). This finding is expected given that learning to read is a primary challenge for students with a language learning disability, whereas this is not necessarily the case for students with a learning dis-ability. This finding also supports the OCDSB’s selection process, given that it shows that LLD students have a greater challenge acquiring reading skills compared to LDE students.
Results by Panel
Reading scores for students in the primary, junior, and intermediate panels significantly increased from the fall to the spring assessment. On the Letter-Sound Identification and the Phonological Awareness assessments, primary students had the greatest increase in scores compared to junior and intermediate students. On the Sound Combinations assessment, students from all panels had similar amounts of increase in scores. On the Challenge Words assessment, junior students had the greatest increase in scores. In summary, these findings indicate that students in the LDE and LLD programs gain a majority of their basic reading skills (i.e., learning the sounds that different letters and letter combinations make) in the primary grades, and learn how to apply these basic reading rules in more complex words during the junior grades. This finding provides support for the effectiveness of the ERP early reading interventions for LDE and LLD students. Furthermore, average scores on the Letter-Sound Identification and Phonological Awareness spring assessments for junior students are very close to the maximum score of the assessments (i.e., 92% for Letter-Sound Identification and 93% for Phono-logical Awareness). This indicates that the majority of students master the skills measured by these assessments by the junior grades. The ‘ceiling effect’ explains why intermediate panel students do not appear to gain as many skills as primary and junior students on these assessments.
Results by Gender
Male and female students’ reading scores significantly improved by the spring 2011 assessment. Male students’ scores improved more than female students; however this difference in the extent of improvement was not statistically significant. Furthermore, although male and female students’ fall (baseline) scores were not significantly different, female students’ spring assessment scores were significantly lower compared to male students on the Letter-Sound Identification, Sound Combinations, and Challenge Words assessments (i.e., average Letter-Sound Identification scores for male vs. female students were 34 vs. 32; for Sound Combinations, 17 vs. 14; for Challenge Words, 27 vs. 19). In summary, these findings suggest that female students in the LDE and LLD programs have a greater challenge learning to read than male students.
PM Benchmarks
Overall Results
A total of 95 LDE and LLD students, representing 48% of the total number of students in these programs, were administered the PM Benchmarks as-sessment during the fall and spring of the 2010-11 school year. Students’ PM Benchmarks asas-sessment scores significantly improved from the fall to the spring assessment (see Figure 5 below).
Figure 5
PM Benchmarks Assessment Results, 2010-11
5 10 15 20 25 30 Fall Spring PM Benchmarks Reading Level
Results by Program
Both LDE and LLD students’ PMB scores significantly increased from the fall to the spring assessment, and to a similar extent. LLD students had sig-nificantly lower fall and spring PMB scores compared to LDE students, which suggests that these students have more difficulty reading. Once again this supports the OCDSB selection process for these specialized programs.
Results by Panel
Seventy-eight students were registered in grades 1 to 3 of the LDE and LLD programs. Among these, 50 (64%) participated in the spring 2011 PM Benchmarks assessment. Twenty-one percent of all primary students in the LDE and LLD programs read at or above the target reading levels for their respective grades. Further, PM Benchmark scores of students in all panels significantly increased by the spring assessment. The average fall vs. spring scores were 7 vs. 13, 13 vs. 19, and 21 vs. 26 for students in the primary, junior, and intermediate panels, respectively. The average spring score for intermediate students was close to the maximum score (i.e., 26/30), which indicates that LDE and LLD students in the intermediate panel tend to master most of the skills assessed by the assessment by the time they get to grade 7 (see discussion on ceiling effect, previous page).
Results by Gender
PM Benchmark scores for both male and female students increased by a similar amount from the fall to the spring, and the improvement was statisti-cally significant for both genders. Consistent with the Empower assessment findings, female students’ fall and spring scores were lower compared to male scores; however, this difference was not statistically significant. An important implication of this finding is that female students in the LDE and LLD programs may benefit from instructional strategies targeted specifically at girls.
EQAO Results
Thirty-eight grade 3 students were registered in the LDE and LLD programs. Of these, 35 (92%) participated in the 2010-11 primary EQAO assess-ments. Among the participating students, 11%, 29%, and 23% achieved the provincial standard in Reading, Writing, and Math, respectively. Twenty-one students were registered in the grade 6 LDE and LLD programs. Of these, approximately 70% participated in the assessments. Among the participating students, 40%, 20%, and 7% achieved the provincial standard in Reading, Writing, and Math, respectively.
LDE and LLD Summary of Results
Overall, students’ scores on all assessments significantly increased during the 2010-2011 school year. Results of these assessments indicate that students in the LLD program had lower reading ability compared to those in the LDE program, which is not surprising given that language learning is a primary challenge for students in the LLD program. However, students in both groups made similar amounts of progress over the course of the school year on all these assessments except Phonological Awareness. Comparisons by panel indicate that students generally master the measured skills by the junior grades. Comparisons by gender indicate that female students had lower reading scores, and found learning to read more challenging compared to male students. Lastly, about a ¼ of participating students met the provincial standards on the EQAO and PM Benchmarks assessments.
ii) Behaviour Intervention Program (BIP)
Output Indicator Overview:
Program Outcome Indicator(s) Administration Timelines Data Included At Time of Report
BIP CANS-B Sept./ May 2010-2011
Background
The Child and Adolescent Needs and Strengths-Behaviour (CANS-B) assessment was piloted in all elementary and secondary Behaviour Intervention Program (BIP) sites in May, 2010. The CANS-B was obtained at no cost to the LSS department, and was adapted for use in the BIP program through a collaborative process involving several key external stakeholders as well as program staff from the LSS department. The CANS-B was developed by adapting items from different versions of the Child and Adolescent Needs and Strengths (CANS; Lyons, 1999) that best represented the characteristics and needs of students in the BIP program, and various targets for intervention. All BIP students received the CANS-B assessment twice during the 2010-2011 school year: once at the end of September 2010 (baseline), and again in April 2010-2011 (post-test). All BIP specialized classroom teachers were trained on the administration of the CANS-B during the spring of 2010 and received a refresher session again in spring 2011, during QPI training. A fall 2011 training session was offered for new BIP staff as well. Specialized program teachers in the BIP program were encouraged to use the CANS-B assess-ment tool in developing their students’ Individual Education Plan (IEP) goals. An electronic data collection template was developed in order to facilitate the entry of CANS-B assessment results by specialized program teachers.
CANS-B Description
The B is a rating scale used by BIP classroom teachers to assess students’ needs related to behaviour, mental health, and education. The CANS-B also assesses students’ individual strengths. The CANS-Behavioural Needs items included in the CANS-CANS-B assessment are divided into smaller groups of common items, or subscales, including: i) Risk Behaviours - such as hostility towards others with aggression, and self-injurious behaviours; ii) Executive Functioning - related to decision-making skills and impulse control; iii) Emotion Regulation- including moodiness and anger control; iv) Cognitive Flex-ibility - specifically regarding adaptation to change; v) Social Skills - such as building relationships and empathy; vi) Receptive and expressive language); vii) Sensory/ Motor Skills - including gross and fine motor skills; and viii) Daily Functioning -featuring activities of daily living and eating. Typically, higher ratings on the CANS-B items and on the subscale scores indicate greater needs that require some form of intervention or immediate action. Specifically, a rating of 3 indicates that the student has an acute need and requires immediate support; whereas a rating of 0 indicates that there is no evidence that the student has a need related to the area assessed. Conversely, on the Individual Strengths subscale, a rating of 0 indicates that the student has a significant strength that can be used to overcome the student’s difficulties. The CANS-B also includes a section where teachers can document whether the student has been diagnosed with a psychiatric disorder by a mental health professional.
Data Analysis Framework
Data from the 2010-2011 fall and spring administrations of the CANS-B assessments are included in the analysis below. Descriptive statistics (i.e., number of cases, frequency of ratings, and means) were calculated for all BIP students overall, by panel, and by gender. Changes in student scores over the 2010-2011 school year were also analyzed. It should be noted that EQAO and PMB scores were originally identified as appropriate performance measures for students in the BIP program; however, the limited number of students who participate in these assessments in any given year, precludes them from providing adequate information about the program. Further, due to the limited number of students who did participate in these assessments last year, suppression rules must apply.
CANS-B Results
Overall
Students’ Profile of Needs and Strengths
A total of 92 BIP students were assessed using the CANS-B in 2010-2011, representing 100% of students in the program. The most common diagnosis were Attention-Deficit Hyperactivity Disorder (ADHD) and Oppositional Defiant Disorder (32% and 16%, respectively). About half of the participating stu-dents previously attended mental health related and/or correctional programs before being enrolled in the BIP. Of these, 17% had attended Crossroads Children’s Centre. The second and third most common programs attended were M. F. McHugh School and Reality Check (8% and 7%, respectively). Among the behavioural needs that required immediate action were those related to students’ social functioning (i.e., 28% received a rating of 3). The most frequently indicated mental health needs requiring intensive intervention were related to autism spectrum symptoms and eating disturbances (17% and 13% received a rating of 3, respectively). Among the educational needs, problems with students’ academic achievement and school attendance were most often identified as needs that required