http://www.scirp.org/journal/gep ISSN Online: 2327-4344
ISSN Print: 2327-4336
DOI: 10.4236/gep.2017.511008 Nov. 13, 2017 102 Journal of Geoscience and Environment Protection
GIS-Based Model for Mapping Malaria Risk
under Climate Change Case Study: Burundi
Mahmoud A. Hassaan
1, Mohamed A. Abdrabo
1, Prosper Masabarakiza
21Alexandria Research Center for Adaptation to Climate Change (ARCA), Institute of Graduate Studies and Research,
Alexandria University, Alexandria, Egypt
2National Institute of Public Health (INSP), Bujumbura, Burundi
Abstract
Malaria is one of the largest problems threatening global public health that is expected to increase in the future under climate change due to associated warming and wetter conditions. This will exacerbate disease burden in Bu-rundi as one of sub-Saharan African countries, where 2 million cases of mala-ria were reported in 2015. This highlights the need for developing a metho-dology for mapping malaria risk under climate change and delineating those regions that may potentially experience malaria epidemics in the future. Ma-laria transmission and distribution are generally determined by a wide range of climatic, topographic and socioeconomic factors. The paper in hand is in-tended to map malaria risk in Burundi under climate change up to 2050. For this purpose, a GIS-based model was developed for mapping malaria as a function of various climatic and topographic determinants of malaria. The developed GIS-model was used in mapping malaria risk under current cli-matic conditions. Thereafter, the produced risk map was validated compared to malaria morbidity data in Burundi at health district level. Finally, the GIS-model was applied to map malaria risk in the future under RCPs 2.6 and 8.5 scenarios up to 2050. It was found that about 34.6% and 44% of Burundi land surface will be highly vulnerable to malaria risk by 2050 under RCPs 2.6 and 8.5 scenario, respectively. Also, it was noted that such highly vulnerable areas are distributed mainly in northern parts of the country. The suggested GIS-based model for mapping malaria risk under climate change can contri-bute largely to more informed decision-making and policy making process in terms of planning for intervention and control malaria risk. This in turn can support reducing disease burden and improving resilience to climate change.
Keywords
Malaria Risk, GIS, Mapping Vulnerability, Burundi How to cite this paper: Hassaan, M.A.,
Abdrabo, M.A. and Masabarakiza, P. (2017) GIS-Based Model for Mapping Malaria Risk under Climate Change Case Study: Burun-di. Journal of Geoscience and Environment Protection, 5, 102-117.
https://doi.org/10.4236/gep.2017.511008
Received: October 7, 2017 Accepted: November 10, 2017 Published: November 13, 2017
Copyright © 2017 by authors and Scientific Research Publishing Inc. This work is licensed under the Creative Commons Attribution International License (CC BY 4.0).
DOI: 10.4236/gep.2017.511008 103 Journal of Geoscience and Environment Protection
1. Introduction
Malaria represents one of the largest problems threatening global public health [1] with total cases exceeding 212 million worldwide in 2015, of which 90% were in Africa. Moreover, Malaria caused 429 thousand deaths globally in 2015 [2]. In this respect, it was estimate that Malaria was the seventh leading cause of death in low-income countries by 2015, leading to 34.5 causes of deaths per 100,000 of population on average in these countries [3]. As one of vector-borne disease sys-tems, malaria is caused by Plasmodium parasites that transmitted by Anopheles mosquito. Malaria transmission and distribution are generally determined by a wide range of climatic, topographic and socioeconomic factors [4] [5]. While both climatic and topographic factors determine the suitable habitats for
Plas-modium and Anopheles, socioeconomic factors are more relevant to adaptive
capacities of individuals or communities and consequently determine their vul-nerability to malaria.
A wide range of research work was undertaken to recognize the various fac-tors underlying malaria risk in different countries [6]. The contribution of cli-mate in malaria transmission was already recognized [7] and the association between epidemics of malaria and climate was evidenced in different regions worldwide in particular in sub-Saharan African countries [1] [8] [9], Latin America [10] and Asia [11]. Generally, malaria incidence increases with warm and wet conditions, where higher temperature leads to increasing malaria inci-dence as it contributes to shortening extrinsic incubation period of Anopheles mosquito [8] [12]. Generally, it was suggested that the optimum temperature for Anopheles mosquito and parasite development ranges between 20˚C and 30˚C and they are subjected to thermal death if temperature rises above 40˚C or drops below 16˚C [13]. Yet, it is worth mentioning that the impact of temperature on malaria cannot be fully explained only by mean temperature [14]. Actually, di-urnal temperature range has significant impacts on malaria transmission, where more diurnal temperature range in relatively cold conditions, with mean tem-perature below 21˚C, may increase malaria transmission as it accelerates mos-quito development. Meanwhile, more diurnal temperature range in warmer conditions, with mean temperature above 21˚C, may lead usually to decrease malaria transmission as it may slow-down mosquito development [14] [15]. Al-so, malaria incidence strongly associated with wet conditions, higher levels of rainfall [8] or relative humidity [4] that usually support Anopheles mosquito to complete their life cycle [10]. In this respect, 80 mm per month of rainfall for at least five months was suggested as a threshold limit that is sufficient to malaria transmission [4].
DOI: 10.4236/gep.2017.511008 104 Journal of Geoscience and Environment Protection lowlands [16]. Such low temperature in high altitude limits parasite development and consequently restricts the spread of malaria there [12]. Similarly, malaria risk is negatively associated with slope, where breeding sites of mosquitos are more likely to be in gentle slopes and planes [17]. Usually, katabatic wind in steep slopes and a relatively cold temperature during nights restrict dispersion of mosquitos into higher altitudes [17] [18]. Also, malaria risk increases in some patterns of land cover that are dominated by wetlands, farmlands and regularly flooded land. Such type of land covers provides suitable sites for Anopheles mosquitos to complete their life cycle [10] [12] [19].
As a result of sensitivity of malaria transmission to climate and topography, malaria was defined as a highly climate sensitive disease [10] and an environ-mental related disease [20]. Such sensitivity, also, implies that the great poten-tials for mapping malaria risk through various climatic and topographic va-riables that determine malaria transmission. Recently, mapping malaria has been promoted by increasing data availability, improved insight into environmental covariates of malaria risk, advances in analytical techniques [21] and availability of affordable Geographical Information Systems (GIS) software [4]. The applica-tion of GIS was not restricted only to mapping malaria incidence but extended also to include assessing the relationship between malaria and underlying fac-tors, developing malaria early warning systems [13] and planning for malaria control programs [22]. This was motivated by the nature of data on malaria in-cidence and underlying climatic, topographic and socioeconomic factors are spatial variables that can be modeled and manipulated through GIS due the great capabilities of such systems in terms of handling and analyzing spatial data. In this respect, it is worth mentioning that the successful application of GIS in mapping malaria and planning for control programs depends largely on availa-bility of accurate and updated data on malaria cases [22].
Malaria is one of the main health issues in Burundi in terms of morbidity, mortality and associated sever economic costs [8]. In 2015, Burundi had 2 mil-lion cases of malaria, which led to about 5600 deaths [2]. Due to its significant magnitude, malaria in Burundi was considered repeatedly. For example, Nku-runziza et al. (2010) and NkuNku-runziza et al. (2011) attempted to provide better understanding on various influencing climatic factors [6] [8]. More recently, Moise et al. (2016) examined the spatial patterns of malaria morbidity [23]. It was projected that climate change will have significant impacts on expanding spatial extent of the areas vulnerable to malaria risk [24] [25] as a result of ex-pected warming and increasing humidity [26]. However, none of the previous research work considered the potential impacts of climate change on malaria in-cidence in Burundi. This, in turn, emphasizes the need for developing a metho-dology for mapping malaria risk and delineating those regions that may poten-tially experience malaria epidemics under climate change in the future.
DOI: 10.4236/gep.2017.511008 105 Journal of Geoscience and Environment Protection variations of the considered determinants are employed to predict those areas of high malaria risk under expected climate change. Such a prediction is thought that, of great importance due to its role in improving resilience of the country to climate change associated risks.
2. Case Study
Burundi is one of the sub-Saharan African countries that is located between 2˚20' and 4˚27' South and between 28˚50' and 30˚53' East [8]. Covering a total area of 27,834 km2, of which 8% are water surface occupied by Lake Tanganyika;
[image:4.595.224.522.308.713.2]the second largest freshwater lake in the world [27]. The country is one of the most populated countries in East Africa with estimated total population size of 9.8 million inhabitants in 2015. This population primarily lives in rural envi-ronments, where urban population represents only about 15% of the total popu-lation [28]. The country is administratively subdivided into 18 provinces (Figure 1), which are subdivided into 46 health districts [29].
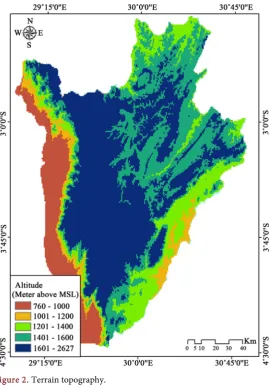
DOI: 10.4236/gep.2017.511008 106 Journal of Geoscience and Environment Protection Burundi has a mountainous surface with altitude ranging between 775 meters and 2670 meters above mean sea level [8]. The country is dominated by high plateau in the center with an average altitude of 1500 meter above mean sea level [27] (Figure 2). Also, Burundi territory has some plains including Imbo in the West, the Kumoso depression in the East [30]. The varied altitude has consider-able impact on temperature, where the highest mountain areas have an average annual temperature of 16˚C, while the central plateau has cool temperature with annual average temperature of 20˚C. Meanwhile, the relatively low areas near Lake Tanganyika has warmer climate with an annual temperature of 23˚C on average [8].
[image:5.595.239.510.337.726.2]Most parts of Burundi receive considerable amount of rainfall exceeding 1300 mm/year. Yet, the rainfall is generally irregular in space and time. Spatially, the north-west parts of Burundi receive heavy rains compared to other parts of the country [8]. Temporally, Burundi climate is characterized by four seasons, a short rainy season (from October to December), a short dry season (January to February), a long rainy season (March to May) and a long dry season (from June to September [30].
DOI: 10.4236/gep.2017.511008 107 Journal of Geoscience and Environment Protection
3. Data and Methodology
3.1. Data
Mapping malaria risk as a function of climatic and topographic conditions re-quires as a prerequisite identifying those determinants that would be considered. In this respect, a list of seven determinants was developed including: average annual temperature, rainfall, relative humidity, land cover, altitude, terrain slope and distance to wetlands and regularly flooded land. Data on topographic de-terminants including altitude and land cover was acquired in raster format from DIVA-GIS, which provide a wide range of data in vector and raster formats at country level. Additionally, the base map of Burundi including administrative units at different levels was acquired in vector format [31].
Meanwhile, data on temperature, rainfall and relative humidity as key climatic variables determining malaria risk was obtained from The National Center for Atmospheric Research (NCAR). The obtained data, which was in shapefile for-mat, included historical data for the period 1986-2005 and downscaled data fu-ture data under RCP8.5 scenario for the period 2040-2060 [32]. Using ArcGIS (V. 9.3) the acquired data was processed and integrated into a geodatabase for Burundi. In this respect, point feature classes of climatic determinants were in-terpolated to create raster surfaces representing the spatial variation of these de-terminants within Burundi territory. Also, slope was derived from altitude raster surface.
Moreover, data on malaria incidence was essential for validation purposes. Accordingly, previous research work and available data sources were surveyed to acquire data on malaria incidence in Burundi. In this respect, data on malaria cases reported by health facilities in 2010 were obtained from the Ministry of Public Health in the service of Epidemiology and health statistics. The district collects health information regularly from health facilities and compiles the data on a monthly basis. The completeness of data in the districts was about 97% during the study period [33].
3.2. Methodology
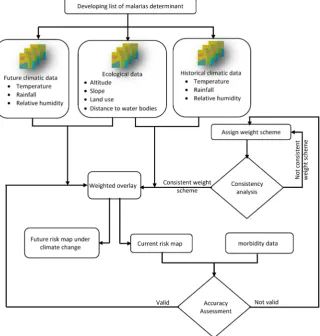
Using acquired data on various climatic and topographic determinants, malaria risk was mapped according a methodology of four main steps (Figure 3).
1) Evaluating determinants weights
DOI: 10.4236/gep.2017.511008 108 Journal of Geoscience and Environment Protection
Figure 3. Methodology developed for mapping malaria risk under climate change.
Table 1. Evaluation scale of absolute number.
Scale Definition
1 The two factors contribute equally to malaria risk (Equal relative importance)
2 The considered factor contributes more slightly to malaria risk compared to the other factor (slight relative importance)
3 The considered factor contributes moderately to malaria risk compared to the other factor (Moderate relative importance)
4 The considered factor contributes strongly to malaria risk compared to the other factor (Strong relative importance)
5 The considered factor contributes very strongly to malaria risk compared to the other factor (Very strong relative importance)
in the produced reciprocal matrix was divided by the sum of its column. Finally, the weight of each factor was calculated through averaging across the rows [34] [35].
[image:7.595.209.533.464.608.2]DOI: 10.4236/gep.2017.511008 109 Journal of Geoscience and Environment Protection 2) Mapping malaria risk under current climatic conditions
This step involved applying Weighted Overlay analysis to combine various climatic and topographic determinants of malaria risk. According to Weighted Overlay analysis the raster surfaces of different considered malaria determinants were reclassified into a common preference scale of different malaria risk levels. Then, each of reclassified raster surfaces is multiplied by its assigned weight, identified in the previous step, then added together (Table 2). As a result, a new raster surface was generated representing different levels of malaria risk at the present according to the considered current climatic and topographic determi-nants.
3) Assessing accuracy of produced malaria risk map
This step was intended to evaluate the accuracy of the produced malaria risk map compared to morbidity data and identify to what extent the produced ma-laria risk reflects spatial pattern of mama-laria incidence in Burundi.
4) Mapping malaria risk under climate change in the future
Using the same weigh scheme, this step included employing Overlay Weighted analysis to map malaria risk under RCP 2.6 and RCP 8.5 scenarios up to 2050 through future climatic data in addition to topographic data. Finally, the pro-duced malaria risk map was compared to current malaria risk map to identify the trend and scale of malaria risk under climate change up to 2050.
4. Results and Discussion
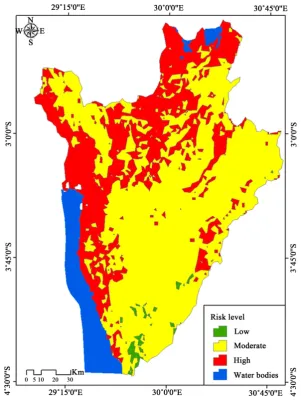
Mapping malaria risk means delineating areas that are vulnerable to host breed-ing sites of malaria vectors and parasites. Such delineation, which was carried out as a function of a number of climatic and topographic determinants of mala-ria incidence, involved combining these determinants with different weights. As a result, a risk map was produced, in which various parts of Burundi were classi-fied into three levels of risk; low, moderate and high malaria risk.
Generally, the produced malaria risk map, based on current climatic condi-tions, revealed major proportions of Burundi land surface have moderate-risk level, where the moderate-risk zone dispersed in all parts of Burundi covering about 78.5% of the total land surface. Meanwhile, the high-risk zone was found to be located mainly in the northern and western parts of Burundi covering about 9.1% of the total area of Burundi, which are characterized generally by a relatively low altitude, gentle slopes, high relative humidity and receive heavy rains. Such characteristics provide wet and warm conditions that are optimal for malaria vector and parasites. Meanwhile, low-risk zone, which represented about 12.4% of the total land surface, was found to be distributed in the eastern and southern parts of Burundi (Figure 4).
DOI: 10.4236/gep.2017.511008 110 Journal of Geoscience and Environment Protection
Table 2. Classes and weights of climatic and topographic determinants of malaria risk.
Factor Weight Class Rank Degree of risk
Altitude
(Meter) 12%
<1200 5 Very high
1200 - 1300 4 High
1300 - 1400 3 Moderately
1400 - 1500 2 Low
>1500 1 Very low
Slope
(%) 7%
< 5 5 Very high
5 - 10 4 High
10 - 15 3 Moderately
15 - 20 2 Low
>20 1 Very low
Land cover 20%
Regularly flooded land and cultivated land 5 Very high
Water Bodies 4 High
Shrub or herbaceous land 3 Moderately
Forest land 2 Low
Artificial Surfaces 1 Very low
Annual temperature average (˚C) 15%
>20 5 Very high
20 4 High
19 3 Moderately
18 2 Low
<18 1 Very low
Distance to wetlands
(km) 10%
>40 5 Very low
20 - 40 4 Low
10 - 20 3 Moderately
5 - 10 2 High
<10 1 Very High
Rainfall
(mm) 18%
>1950 5 Very high
1900 - 1950 4 High
1850 - 1900 3 Moderately
1800 - 1850 2 Low
<1800 1 Very low
Relative Humidity
(%) 18%
>82 5 Very high
79 - 82 4 High
76 - 79 3 Moderately
73 - 76 2 Low
DOI: 10.4236/gep.2017.511008 111 Journal of Geoscience and Environment Protection
Figure 4. Current malaria risk map.
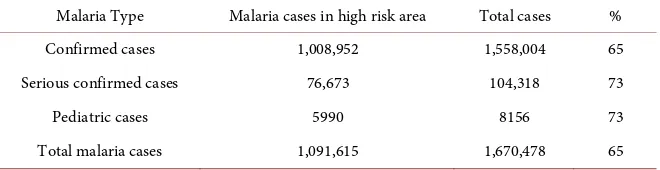
district were overlaid interest, then, the area of high-risk zone and the no of ma-laria cases were summarized. It was found that the high-risk zone captured 65% of the total cases of malaria that are reported at district level in Burundi in 2010 (Table 3). Moreover, high-risk zone included considerable proportions of Kyanza, Kirundi and Cibtoke provinces that were reported by Moise et al., (2016) [23] as hot spots of malaria.
Also, at province level, it was found that the number of malaria cases is posi-tively correlated to the area of high-risk zone and in the top five provinces expe-riencing high rate of malaria incidence exceeding 1,000,000 cases in 2010 (Figure 5).
DOI: 10.4236/gep.2017.511008 112 Journal of Geoscience and Environment Protection
Figure 5. Relationship between number of malaria cases and the area of high-risk zone in
the top five health districts in terms of malaria incidence.
Table 3. The number of malaria cases recorded in 2010 within high-risk zone depicted in
risk map.
Malaria Type Malaria cases in high risk area Total cases %
Confirmed cases 1,008,952 1,558,004 65
Serious confirmed cases 76,673 104,318 73
Pediatric cases 5990 8156 73
Total malaria cases 1,091,615 1,670,478 65
turn, indicates to the validity of the developed approach in delineating malaria risk zones as a function of topographic and climatic conditions. This conse-quently means that the developed methodology can be employed in mapping malaria risk in the future under climate change.
As for climate conditions under climate change scenarios up to 2050, it is ex-pected that the average annual temperature in Burundi is exex-pected to increase by 0.9˚C and 1.3˚C on average, compared to current climatic conditions, up to 2050 under RCP 2.6 and RCP 8.5 scenarios, respectively. Generally, the eastern and southern parts of Burundi are expected to experience the highest level of tem-perature increase exceeding 1˚C and 1.5˚C under the two scenarios, respectively.
[image:11.595.210.540.342.427.2]DOI: 10.4236/gep.2017.511008 113 Journal of Geoscience and Environment Protection up to 2050. In contrast, relative humidity is expected to change slightly under different scenarios ranging between 0.5% decrease and 1% increase up to 2050 under RCP 2.6 and RCP 8.5 scenarios, respectively.
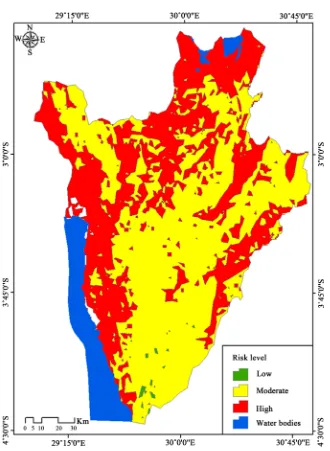
[image:12.595.222.524.307.709.2]Such expected changes in climate variables under different scenarios, particu-larly, temperature and rainfall, is thought that, will have significant impact on malaria incidence in Burundi in the future. This is especially in eastern parts that are expected to experience higher levels of warming and the northern parts that are expected to experience wetter conditions. This was emphasized by the pro-duced malaria risk maps under RCPs 2.6 (Figure 6) and 8.5 (Figure 7) scenarios up to 2050, which revealed that high-risk zone is expected to expand generally in the northern and eastern parts of Burundi. In this respect, it is expected that, high risk zone will expand to cover about 34.6% and 44% of Burundi land sur-face by 2050 under RCPs 2.6 and 8.5 scenario, respectively. Meanwhile, mod-erate and low-risk zones are expected to cover together 65.4% and 65% of Bu-rundi land surface by 2050 under RCP 2.6 and RCP 8.5 scenarios, respectively.
DOI: 10.4236/gep.2017.511008 114 Journal of Geoscience and Environment Protection
Figure 7. Malaria risk map by 2050 under RCP8.5 scenario.
To investigate the pattern of change of different risk zones due to expected climate change, the proportions of different risk zones extent in current risk map were compared to those in risk maps under RCPs 2.6 and 8.5 scenarios by 2050. In this respect, it was found that 26% and 35% of total area of currently mod-erate-risk zone is expected to become high-risk zone under RCP2 2.6 and 8.5 scenarios, respectively. Meanwhile, 11% and 12% of total area of currently low-risk zone is expected to become moderate-risk zone under the same two scenarios, respectively (Table 4). This means that about 37% and 47% of Burun-di are expected to experience exacerbated risk level under RCPs 2.6 and 8.5 sce-narios by 2050.
DOI: 10.4236/gep.2017.511008 115 Journal of Geoscience and Environment Protection
Table 4. Expected proportional change in area of different risk zones due to climate
change under RCPs 2.6 and 8.5 scenarios.
Current risk level (Under RCP 2.6 scenario) (Under RCP 8.5 scenario) High Moderate Low High Moderate Low
High 9 0 0 9 0 0
Moderate 26 53 0 35 44 0
Low 0 11 1 0 12 0
change scenarios up to 2050 and exacerbated risk level in considerable propor-tions of land surface of Burundi highlight the role of climate change in increas-ing malaria incidence. Such considerably varied proportional area of high-risk zone under the two considered scenarios stresses on the significance of climate change in malaria incidence.
5. Conclusions
Mapping malaria risk under expected climate change in the future can contri-bute largely to improving resilience of Burundi to climate change associated risks and their health implications. In this respect, GIS can play a crucial role in mapping malaria risk under different scenarios of climate change and identify hot sports of malaria incidence that will need to intervention and control meas-ure.
The developed GIS-based methodology for mapping malaria under climate change revealed that considerable parts of Burundi, particularly northern parts, will be highly vulnerable to malaria risk in the future under different scenarios of climate change.
The accuracy of mapping process of malaria risk under climate change is de-termined by availability of data on malaria determinants currently and in the future. Also, to improve the accuracy of mapping process, there is a need to ap-ply an integrated analysis considering, in addition to topographic and climatic determinants, socioeconomic determinants of malaria such as income, popula-tion density, access to health services and effectiveness of malaria control meas-ures, etc. Yet, this entails projecting these variables in the future as a prerequisite of such integrated analysis.
Acknowledgements
This research work is part of a research project sponsored by the IDRC-Canada for establishing Alexandria Research Center for Adaptation to Climate Change (ARCA) at the University of Alexandria, Egypt.
References
DOI: 10.4236/gep.2017.511008 116 Journal of Geoscience and Environment Protection
[2] WHO (2016) World Malaria Report 2016. Geneva. [3] WHO (2017) Media Centre. Geneva
[4] Craig, M.H. (1999) A Climate-Based Distribution Model of Malaria Transmission in Sub-Saharan Africa. Parasitology Today, 15, 105-111.
https://doi.org/10.1016/S0169-4758(99)01396-4
[5] Hay, S.I., et al. (2002) Climate Change and the Resurgence of Malaria in the East African Highlands. Nature, 415, 905-909.https://doi.org/10.1038/415905a
[6] Nkurunziza, H., Gebhardt, A. and Pliz, J. (2011) Geo-Additive Modelling of Malaria in Burundi. Malaria Journal, 10, 234.https://doi.org/10.1186/1475-2875-10-234
[7] Hoshen, M.B. and Morse, A.P. (2004) A Weather-Driven Model of Malaria Trans-mission. Malaria Journal, 3, 32.
[8] Nkurunziza, H., Gebhardt, A. and Pilz, J. (2010) Bayesian Modelling of the Effect of Climate on Malaria in Burundi. Malaria Journal, 9, 114.
https://doi.org/10.1186/1475-2875-9-114
[9] Odongo-Aginya, E., et al. (2005) Relationship between Malaria Infection Intensity and Rainfall Pattern in Entebbi Peninsula, Uganda. African Health Science, 5, 238-245. [10] Olson, S.H., et al. (2009) Links between Climate, Malaria, and Wetlands in the
Amazon Basin. Emerging Infectious Diseases, 15, 659-662. https://doi.org/10.3201/eid1504.080822
[11] Jhajharia, D., et al. (2013) Influence of Climate on Incidences of Malaria in the Thar Desert, Northwest India. International Journal of Climatology, 33, 312-325.
https://doi.org/10.1002/joc.3424
[12] Patz, J.A. and Olson, S.H. (2006) Malaria Risk and Temperature: Influences from Global Climate Change and Local Land Use Practices. Proceedings of the National Academy of Sciences, 103, 5635-5636.https://doi.org/10.1073/pnas.0601493103
[13] Gebreslasie, M.T. (2015) A Review of Spatial Technologies with Applications for Malaria Transmission Modelling and Control in Africa. Geospatial Health, 10, 239-247.https://doi.org/10.4081/gh.2015.328
[14] Paaijmans, K.P., et al. (2010) Influence of Climate on Malaria Transmission De-pends on Daily Temperature Variation. PNAS, 107, 15135-15139.
https://doi.org/10.1073/pnas.1006422107
[15] Paaijmans, K.P., Read, A.F. and Thomas, M.B. (2009) Understanding the Link be-tween Malaria Risk and Climate. PNAS, 106, 13844-13849.
https://doi.org/10.1073/pnas.0903423106
[16] Maxwell, C.A., et al. (2003) Variation of Malaria Transmission and Morbidity with Altitude in Tanzania and with Introduction of Alphacypermethrin Treated Nets.
Malaria Journal, 2.
[17] Balls, M.J., et al. (2004) Effect of Topography on the Risk of Malaria Infection in the Usambara Mountains, Tanzania. Transactions of the Royal Society of Tropical Medicine and Hygiene, 98, 400-408.
[18] Bødker, R., et al. (2003) Relationship between Altitude and Intensity of Malaria Transmission in the Usambara Mountains, Tanzania. Journal of Medical Entomol-ogy, 40, 706-717.https://doi.org/10.1603/0022-2585-40.5.706
[19] Tuyishimire, J., et al. (2017) Spatial Modelling of Malaria Risk Factors in Ruhuha Sector in the East of Rwanda. Rwanda Journal, 1.
DOI: 10.4236/gep.2017.511008 117 Journal of Geoscience and Environment Protection
[21] Dalrymple, U., Mappin, B. and Gething, P.W. (2015) Malaria Mapping: Under-standing the Global Endemicity of Falciparum and Vivax Malaria. BMC Medicine,
13.https://doi.org/10.1186/s12916-015-0372-x
[22] Booman, M., et al. (2000) Using a Geographical Information System to Plan a Ma-lria Control Program in South Africa. Bulletin of World Health Organization, 78, 1438-1444.
[23] Moise, I.K., et al. (2016) Seasonal and Geographic Variation of Pediatric Malaria in Burundi: 2011 to 2012. International Journal of Environmental Research and Public Health, 13, 425.https://doi.org/10.3390/ijerph13040425
[24] Confalonieri, U., et al. (2007) Human Health. In: Parry, M.L., Canziani, O.F., Palu-tikof, J.P., van der Linden, P.J. and Hanson, C.E., Eds., Climate Change 2007: Im-pacts, Adaptation and Vulnerability, Contribution of Working Group II to the Fourth Assessment Report of the Intergovernmental Panel on Climate Change, Cambridge, 391-431.
[25] Tonnang, H.E., Kangalawe, R.Y. and Yanda, P.Z. (2010) Predicting and Mapping Malaria under Climate Change Scenarios: The Potential Redistribution of Malaria Vectors in Africa. Malaria Journal, 9, 111.https://doi.org/10.1186/1475-2875-9-111
[26] Rosenthal, J. (2009) Climate Change and the Geographic Distribution of Infectious Diseases. EcoHealth, 6, 489-495.https://doi.org/10.1007/s10393-010-0314-1
[27] Worldatlas (2016) Burundi Geography.
http://www.worldatlas.com/webimage/countrys/africa/burundi/biland.htm
[28] UN United Nation (2017) Deographic Year Book.
https://unstats.un.org/Unsd/demographic/products/dyb/dyb2.htm
[29] Ministère de la Sante Publique et de la lute contre le Sida Direction National du Système d’Information Sanitaire, la Carte sanitaire version Mai 2016. [The Sanitary Map Version May 2016.]
https://www.minisante.bi/images/DSNIS/rapports/carte%20sanitaire%20Burundi%
20mai2016.pdf
[30] Mphfa (Undated) National Health Development Plan 2011-2015. Ministry of Public Health and Fighting AIDS.
[31] DIVA-GIS (2017) Free Spatial Data by Country. http://www.diva-gis.org/gdata [32] NCAR (2014) GIS Data Services Are Provided by NCAR GIS Program through
Climate Change Scenarios Version 2.0, 2012. http://www.gisclimatechange.org [33] Ministère de la Sante Publique et de la lute contre le Sida Direction National du
Système d’Information Sanitaire Publique, Annuaire Statistique des Donnees des Centres de Sante et des Hôpitaux pour L’annee 2010. 2011, Bujumbura. [Statistical Data Directory of Health Centers and Hospitals for the Year 2010.]
[34] Whitaker, R. (2007) Validation Examples of the Analytic Hierarchy Process and Analytic Network Process. Mathematical and Computer Modelling, 46, 840-859. [35] Uyan, M. (2013) GIS-Based Solar Farms Site Selection Using Analytic Hierarchy