http://www.scirp.org/journal/jgis ISSN Online: 2151-1969
ISSN Print: 2151-1950
DOI: 10.4236/jgis.2017.96039 Nov. 23, 2017 623 Journal of Geographic Information System
Incidence of Violence Risk Mapping Using GIS:
A Case Study of Pakistan
Rizwan Ali
*, Mobushir Riaz Khan, Hannan Mehmood
Institute of Geo-Information and Earth Observations, PMAS Arid Agriculture University, Rawalpindi, Pakistan
Abstract
Violence comes first by which human lives are being destroyed. Violence pos-es serious challengpos-es to law enforcement agencipos-es and policy makers as well as it threatens the writ of the Government. Violence condition of a country can be visualized through an accurate violence risk map. This paper presents the methodology to develop an incidence of violence (IOV) risk map using GIS. IOV data for year 2010 was collected from Pakistan Institute for Peace Studies (PIPS) that have 3104 records and cover 16 categories of attack types. IOV data was further geocoded by using online Google geocoding service. IOV risk maps were developed through two available methods: kernel density and ge-tis-ord-gi* by giving single parameter “frequency”, and one new indexing me-thod by giving two additional parameters as well “severity” and “probability”. For each district, IOV frequency and IOV severity values were calculated from PIPS data whereas IOV probability value was derived from the Benazir Income Support Program—Poverty Scorecard Survey (BISP—PSS). A value ranging from 1 to 5 was assigned to each of three parameters against each district and then all three parameters were multiplied with each other to generate IOV risk in-dex that had values ranging from 1 to 125. IOV risk inin-dex was further classi-fied through natural breaks into three categories: low risk (1 - 40), moderate risk (41 - 70) and high risk (71 - 125). For validation purpose, spatial overlay analysis was conducted between year 2011 IOV data (classified through natu-ral breaks) and year 2010 IOV risk maps (developed through kernel density, getis-ord-gi* and indexing method). The indexing method has proved as a re-liable method to develop an IOV risk map with an accuracy of 93 percent then getis-ord-gi* and kernel density having accuracy of 58 percent and 89 percent respectively. Furthermore, indexing method predicted IOV risk areas more effi-ciently in terms of spatial distribution. Indexing method highlighted Khuzdar, Zhob, Upper Dir, Khyber Agency, Orakzai Agency, Peshawar and Karachi Dis-tricts under high-risk category where actions are needed from the law
enforce-How to cite this paper: Ali, R., Khan, M.R. and Mehmood, H. (2017) Incidence of Violence Risk Mapping Using GIS: A Case Study of Pakistan. Journal of Geographic Information System, 9, 623-636.
https://doi.org/10.4236/jgis.2017.96039
Received: October 3, 2017 Accepted: November 20, 2017 Published: November 23, 2017 Copyright © 2017 by authors and Scientific Research Publishing Inc. This work is licensed under the Creative Commons Attribution International License (CC BY 4.0).
http://creativecommons.org/licenses/by/4.0/
DOI: 10.4236/jgis.2017.96039 624 Journal of Geographic Information System ment agencies and stakeholders to minimize the violent incidents. This study has showed that GIS has the incredible capabilities that facilitate us in captur-ing, analyzcaptur-ing, and visualizing the IOV data.
Keywords
GIS, Incidence of Violence, Risk Map, Getis-Ord-Gi*, Kernel Density, Indexing, PIPS, Pakistan
1. Introduction
Nelson Mandela stated that twentieth century will be remembered as a century marked by violence. Violence is a leading factor to cause death; around one million people aged from fifteen to forty-four years die every year due to violence and many others are injured [1]. World Health Organization (WHO) defines violence as a harmful act that is purposefully practiced for affecting an individual or a group health, wealth, or peace [2]. There are three wide types of violence: self-directed violence, interpersonal violence, and collective violence [3] out of which only col-lective violence is studied for this research. Colcol-lective violence takes place by a bigger group and it can be split up into three categories: social, political, and economic violence [1].
Violence risk mapping is a dire need of Pakistan with respect to accomplish and maintain security risks or threats. Pakistan ranked among the countries worst hit by plethora of crises in 2009; the total number of violence incidence hap-pened in the year 2009 are 3816 claiming the lives of 12,632 persons and injuring 12,815 [4].
Pakistan Institute for Peace Studies (PIPS) has a comprehensive database on violent incidents. PIPS security reports are source of internal security in Pakistan as no official database is available in the country. The development of incidents database is the outcome of a meticulous monitoring process on every relevant incident in the country on a daily basis. PIPS compiles data from sources including newspapers, magazines, journals, field sources and screening of official records. More than thirty English and Urdu dailies, magazines, and journals, and various television news channels are monitored to update the database. Regional daily newspapers and weeklies from Peshawar, Quetta, Gilgit and Karachi are also monitored for details on incidents reported in the local media. Correspondents in provincial capitals are the primary source for PIPS to verify the media reports. In case of a major incident, PIPS teams consult the local administration and journalists for further detail. In case where PIPS finds it difficult to verify facts of a particular incident, it gives preference to the official statements in that regard [5].
in-DOI: 10.4236/jgis.2017.96039 625 Journal of Geographic Information System formation with reference to earth. Without geospatial context, we cannot under-stand where and how violent events are occurring, nor can we rationalize why they are occurring. Geospatial database improves the ability of information and provide more effective situational awareness. Geographic Information System (GIS) can be used as an effective tool to manage and monitor violence incidents and related activities [6]. GIS is potentially powerful resource for many reasons including their ability to integrate data from various sources to produce new in-formation, and their inherent visualization functions, which can promote crea-tive problem solving and sound decisions with lasting, position impacts on people’s live [7] [8]. Mostly researchers consume GIS to pinpoint violence high risk areas [9].
In this study, the prime objective is to develop an IOV risk map at national level. In this regards, two available method; kernel density and getis-ord-gi*, and one new indexing method were used. Kernel density calculates a magnitude per unit area from point or polyline features by using a kernel function to fit a smoothly tapered surface to each point or polyline. Larger values of the radius parameter produce a more generalized density whereas smaller values show more detail [10] [11] [12] [13]. Getis-ord-gi* identifies statistically significant spatial clusters of high values (hot spots) and low values (cold spots) [14]. Indexing method de-scribes that IOV risk is a function of three parameters, i.e. IOV frequency, IOV probability and IOV severity. “IOV frequency” tells that how many numbers of IOV occurred during specified time interval. “IOV severity” states about the con-sequences in term of mortality rate that how much loss would be in case if the IOV occurred. “IOV probability” describes about the chances of IOV occurrences. Many scholars believe that poor people more frequently engage in acts of violence [15] [16] [17] [18].
2. Research Methods
2.1. Study Area
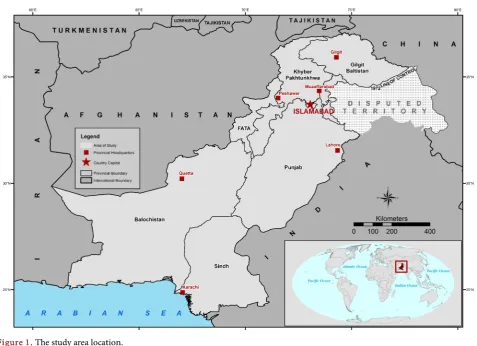
The Selected study area for this research is located between 60 degrees east to 78 degrees east and 23 degrees north to 38 degrees north on the globe (Figure 1).
Islamabad is its capital since 1960, before it Karachi was the capital. Neigh-boring countries of Pakistan are India in East, China in North, Afghanistan and Iran in West and is bounded by 1046 km coastline along the Arabian Sea in the South. Disputed territory is excluded from the study area. According to 2017 cen-sus total population of Pakistan is approximately 20.77 crores [19]. Currently Pa-kistan has 8 major administrative divisions, i.e. Balochistan, Punjab, Sindh, Khy-ber Pakhtunkhwa, Gilgit Baltistan, Federally Administered Tribal Areas, Azad and Jammu Kashmir, and Islamabad Capital Territory.
2.2. Data Collection
2.2.1. IOV DataDOI: 10.4236/jgis.2017.96039 626 Journal of Geographic Information System
Figure 1. The study area location.
Figure 2. PIPS IOV statistics (2005-2015).
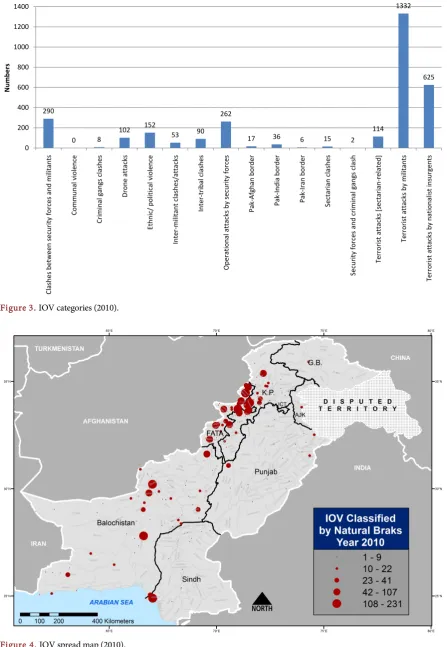
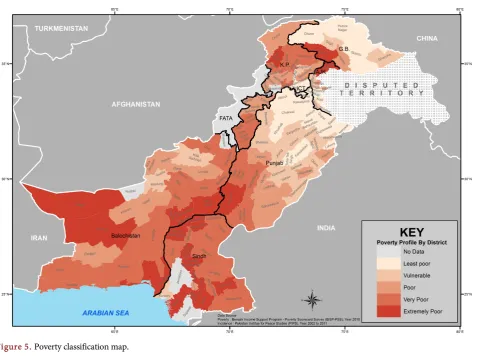
dataset were date, province, district, city, type, target, damage, injured, killed, re-sponsibility, attack tactic, detail, and reference. In year 2010, total numbers of IOV were 3104 covering 16 categories of attack types (Figure 3). Where minimum num-ber of IOV in a district was 0, maximum numnum-ber of IOV in a district were 262, Av-erage number of IOV in a district were 21, while standard deviation was 45. There were 99 districts where IOV were occurred out of 151 districts in total. Spread of IOV 2010 is shown (Figure 4).
2005 2006 2007 2008 2009 2010 2011 2012 2013 2014 2015
Numbers of Attacks 254 675 1503 2577 3816 3393 2985 2217 2555 2099 1097
Numbers of Killed 216 907 3448 7997 12632 10003 7107 5047 4725 5308 3503
Numbers of Injured 571 1543 5353 9670 12815 10283 6736 5688 6932 4569 2167
0 2 4 6 8 10 12 14
Th
ou
sa
nd
s
Years
DOI: 10.4236/jgis.2017.96039 627 Journal of Geographic Information System
[image:5.595.74.525.73.397.2]Figure 3. IOV categories (2010).
Figure 4. IOV spread map (2010).
290
0 8 102
152
53 90
262
17 36 6 15 2
DOI: 10.4236/jgis.2017.96039 628 Journal of Geographic Information System 2.2.2. Poverty Data
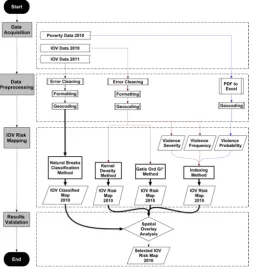
Poverty data was acquired from the Pakistan Institute of Development Eco-nomics (PIDE). The district wide poverty data was generated in 2013, which is based on Benazir Income Support Program-Poverty Scorecard Survey (BISP-PSS) that conducted in 2010 [20]. Poverty data of Pakistan have five classes of pover-ty; least poor, vulnerable, poor, very poor and extremely poor (Figure 5). There were 21 districts that have no data of poverty out of 151 districts of Pakistan. Whereas, 25 districts were in the category of least poor, 24 districts were in the category of vulnerable, 28 districts were in the category of poor, 31 districts were in the category of very poor and 22 districts were in the category of extremely poor.
2.2.3. Collateral Data
Administrative dataset including International, Provincial and District Bounda-ries shape-files of Pakistan were downloaded from the humanitarian community web portal (Figure 6).
2.3. Methodology
[image:6.595.61.540.372.729.2]The development of IOV risk map has several key steps (Figure 7). For this study, adequate hardware with sufficient processing capacity is used.
DOI: 10.4236/jgis.2017.96039 629 Journal of Geographic Information System
Figure 6. Administrative boundaries map.
[image:7.595.249.503.438.709.2]DOI: 10.4236/jgis.2017.96039 630 Journal of Geographic Information System 2.3.1. Data Processing
Poverty data was acquired in PDF format and then it was converted into MS Excel format, Whereas, IOV data was acquired in MS Excel format. To make both da-taset importable in ArcGIS Environment, few actions were performed, i.e. remov-ing of extra spaces and special characters, assignremov-ing column name length to 10 characters, formatting of date column as “Month, Year” and all numeric columns as number data type with 0 decimal places. Plus, all missing values were identi-fied and filled.
Once data was processed in MS Excel, it was uploaded on Google sheet through personal Google account to geocode it. Google provide us geocoding service, which requires places names and returns us with latitude and longitude of each place. Furthermore, geocoded data was thoroughly checked to verify that each record is marked at right place.
All those locations which were wrongly geocoded were identified and then correct latitude and longitude of these records were found using contextual in-formation and replaced accordingly.
2.3.2. IOV Risk Mapping
Each of three methods (Kernel density, Getis-Ord-Gi* and Indexing method) takes weighted points as an input rather than individual IOV events. For this purpose, IOV data was aggregated based on same location by using “collect event tool” in ESRI ArcMap. “Collect Event”, combines coincidence points and then adds a field to store the sum of all incidences at unique location.
After that, first IOV risk map was produced through kernel density method by using “radius of 40,000 meters”, “cell size of 1000 square meters” and “nearest neigh-bour as resampling process” in ESRI ArcMap. Second IOV risk map was produced through getis-ord-gi* by using “contiguity-edge-only” as “conceptualization of spa-tial relationship” in ESRI ArcMap.
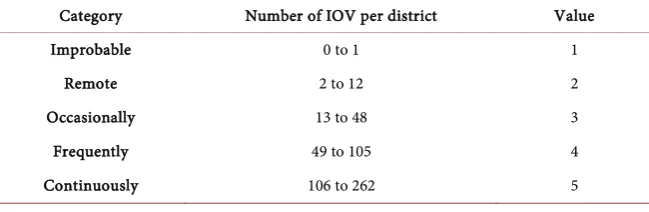
[image:8.595.212.537.622.728.2]Third IOV risk map was produced through indexing method. For this pur-pose; IOV frequency value against each district was generated through Table 1, and similarly IOV severity was generated through Table 2, and IOV probability was generated through Table 3. After that all three values of IOV frequency, IOV severity and IOV probability against each district were multiplied with each other
Table 1.Frequency value for each district, calculated by classifying number of IOV hap-pened in a district into 5 classes and assigning them a value from 1 to 5. Insignificant IOV happened in a district assigned a smaller value and substantial IOV happened in a district assigned a bigger value.
Category Number of IOV per district Value Improbable 0 to 1 1
DOI: 10.4236/jgis.2017.96039 631 Journal of Geographic Information System
Table 2. Severity value for each district, calculated by classifying number of casualties happened in a district into 5 classes and assigning them a value from 1 to 5. Insignificant casualties happened in a district assigned a smaller value and substantial casualties hap-pened in a district assigned a bigger value.
Category Numbers of Causalities per District (Killed + Injured) Value Insignificant 0 to 10 1
Minor 11 to 50 2 Moderate 51 to 500 3 Major 501 to 5000 4 Catastrophic 5001 to 20,286 5
Table 3. Probability value for each district, derived from the five poverty classes of PSS-BISP. Each class assigned a value from 1 to 5. Insignificant poor class assigned a smaller value and substantial poor class assigned a bigger value.
Category Poverty Classes Value Rare Least Poor 1 Unlikely Vulnerable 2 Possible Poor 3 Likely Very Poor 4 Almost Certain Extremely Poor 5
and created an IOV risk index. IOV risk index was further classified into three categories through natural breaks; low risk (1 - 40), moderate risk (41 - 70), and high risk (71 - 125).
2.3.3. Validation
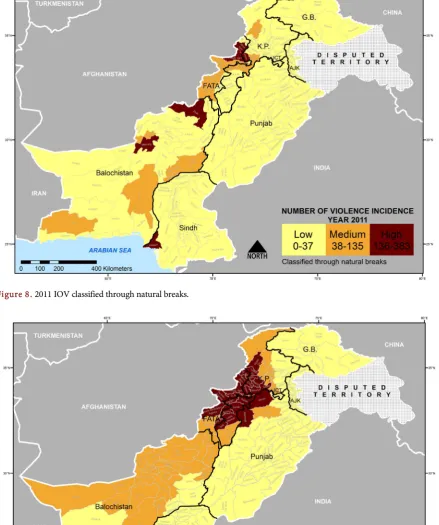
For this purpose, spatial overlay analysis was conducted between 2010 IOV risk maps and 2011 IOV map classified through natural breaks (Figure 8). Natural breaks identified 6 districts under high risk, 15 districts under medium risk and 125 districts under low risk areas.
3. Data Analysis and Results
IOV risk maps developed through gitis-ord-gi* method, kernel density method and indexing method are shown in (Figures 9-11) respectively.
Comparison between 2010 IOV risk map developed through getis-ord-gi* method and 2011 IOV classified through natural breaks, revealed a lot of dis-criminations.
[image:9.595.209.539.287.388.2]DOI: 10.4236/jgis.2017.96039 632 Journal of Geographic Information System
[image:10.595.76.524.304.706.2]Figure 8. 2011 IOV classified through natural breaks.
DOI: 10.4236/jgis.2017.96039 633 Journal of Geographic Information System
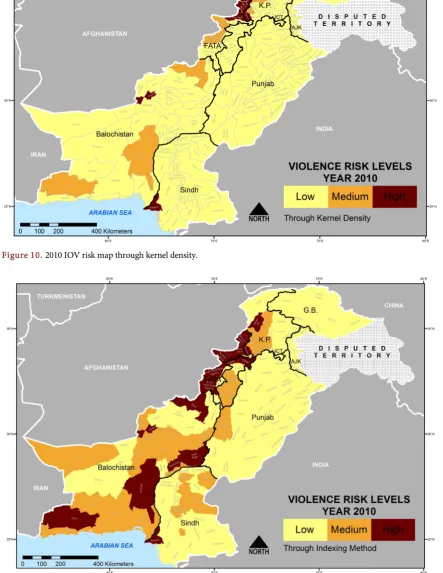
Figure 10. 2010 IOV risk map through kernel density.
[image:11.595.78.522.130.704.2]DOI: 10.4236/jgis.2017.96039 634 Journal of Geographic Information System the adjacent areas were at high risk. This method identified 27 districts under high risk, 81 districts under medium risk and 38 districts under low risk areas.
Comparison between 2010 IOV risk map developed through kernel density me-thod and 2011 IOV classified through natural breaks, showed resemblance between each other because this method considers the risk of neighboring areas during identifying the risk of target area, and then assign an average risk value to target area. This method identified 6 districts under high risk, 9 districts under medium risk and 131 districts under low risk areas.
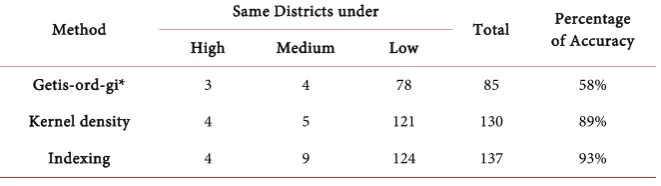
Comparison between 2010 IOV risk map developed through indexing method and 2011 IOV classified through natural breaks, showed extra ordinary resemblance between each other, than kernel density method because this method considers more parameters. Getis-ord-gi* and kernel density methods only works with the frequency data of IOV to determine risk while indexing method also considers severity and probability data of IOV. Indexing method identified 7 districts un-der high risk, 11 districts unun-der medium risk and 128 districts unun-der low risk areas.
Furthermore, each district of 146 districts were checked to see the similarity of risk level identified for year 2010 through getis-ord-gi*, kernel density and in-dexing method with the risk level classified through natural breaks for year 2010 (Table 4). Getis-ord-gi* method predicted identical risk level in 85 districts, kernel density method predicted identical risk level in 130 districts, and indexing method predicted identical risk level in 137 districts with the accuracy of 58 percent, 89 percent and 93 percent respectively.
4. Conclusions
Indexing method is more appropriate to develop an IOV risk map because it considers more parameters of IOV. If severity and probability data of IOV is not available, then kernel density is most reliable method after indexing method. Getis-ord-gi* method is good for identifying clusters of low and high values, but not for the development of risk map.
[image:12.595.210.541.635.728.2]GIS has the incredible capabilities to capture, analyze, and visualize the IOV data. So, key personnel from the security and law enforcement agencies should have been trained on the usage of GIS.
Table 4. Percentage of accuracy, derived through spatial overlay analysis between 2010 IOV risk maps developed through different methods and 2011 IOV classified through natural breaks map.
Method Same Districts under Total of Accuracy Percentage High Medium Low
DOI: 10.4236/jgis.2017.96039 635 Journal of Geographic Information System Though, indexing method has identified IOV risk areas very efficiently by con-sidering three parameters (frequency, severity and probability), there are many other socio-economic parameters that contribute to violence. So, in future by adding more contributing parameters results would be enhanced.
Acknowledgements
Authors are gratefully acknowledging Marcelo Suarez for providing research fund-ing from Experience International Incorporation. Authors are also thankful to Mu-hammad Faisal Zia for providing generous support, and Pakistan Institute for Peace Studies for providing IOV data.
References
[1] Krug, E.G., Dahlberg, L.L., Mercy, J.A., Zwi, A.B. and Lozano, R. (2002) World Re-port on Violence and Health. WHO, Geneva.
[2] World Health Organization (1996) Global Consultation on Violence and Health. Violence: A Public Health Priority. WHO, Geneva.
[3] Foege, W.H., Rosenberg, M.L. and Mercy, J.A. (1995) Public Health and Violence Prevention. Current Issues in Public Health, 1, 2-9.
[4] Rana, M.A. (2010) Pakistan Security Report 2009. Pak Institute for Peace Studies. [5] Rana, M.A. (2011) Pakistan Security Report 2010. Pak Institute for Peace Studies. [6] Jeefoo, P. (2016) Analyzing Spatial Clustering and Hotspots Detection of HIV/AIDS
Prevalence Using GIS Technology. International Journal of Geoinformatics, 12, 65-73. [7] Bell, N. and Schuurman, N. (2010) GIS and Injury Prevention and Control :
Histo-ry, Challenges, and Opportunities. International Journal of Environmental Research and Public Health, 7, 1002-1017. https://doi.org/10.3390/ijerph7031002
[8] Buckeridge, D.L. (2002) Making Health Data Maps : A Case Study of a Communi-ty/University Research Collaboration. Social Science & Medicine, 55, 1189-1206.
https://doi.org/10.1016/S0277-9536(01)00246-5
[9] Maged, N. and Kamel, B. (2004) Towards Evidence-Based, GIS-Driven National Spatial Health Information Infrastructure and Surveillance Services in the United Kindgdom. International Journal of Health Geographics, 3, 1.
https://doi.org/10.1186/1476-072X-3-1
[10] Hart, T. and Zandbergen, P. (2014) Kernel Density Estimation and Hotspot Map-ping: Examining the Influence of Interpolation Method, Grid Cell Size, and Band-width on Crime Forecasting. Policing: An International Journal of Police Strategies & Management, 37, 305-323. https://doi.org/10.1108/PIJPSM-04-2013-0039
[11] Chainey, S.P. (2013) Examining the Influence of Cell Size and Bandwidth Size on Kernel Density Estimation Crime Hotspot Maps for Predicting Spatial Patterns of Crime. Bulletin of the Geographical Society of Liege, 60, 7-19.
[12] Cusimano, M., Marshall, S., Rinner, C., Jiang, D. and Chipman, M. (2010) Patterns of Urban Violent Injury: A Spatio-Temporal Analysis. PLoS ONE, 5, e8669.
https://doi.org/10.1371/journal.pone.0008669
[13] Portnov, B.A. and Zusman, M. (2014) Spatial Data Analysis Using Kernel Density Tools. Encyclopedia of Business Analytics and Optimization, 2252-2264, IGI Global. [14] Songchitruksa, P. and Zeng, X. (2010) Getis-Ord Spatial Statistics to Identify Hot
Jour-DOI: 10.4236/jgis.2017.96039 636 Journal of Geographic Information System nal of the Transportation Research Board, 2165, 42-51.
https://doi.org/10.3141/2165-05
[15] Crutchfield, R.D. and Wadsworth, T. (2003) Poverty and Violence. In: Heitmeyer W. and Hagan J., Eds., International Handbook of Violence Research, Springer, Dor-drecht. https://doi.org/10.1007/978-0-306-48039-3_4
[16] Krueger, A.B. and Jitka, M. (2003) Education, Poverty and Terrorism: Is There a Causal Connection? Journal of Economic Perspectives, 17, 119-144.
[17] Ramiro Martinez, J. (1996) Latinos and Lethal Violence: The Impact of Poverty and Inequality. Social Problems, 43, 131-146.https://doi.org/10.2307/3096994
[18] Huff-Corzine, L., Corzine, J. and Moore, D.C. (1991) Deadly Connections: Culture, Poverty, and the Direction of Lethal Violence. Social Forces, 69, 715-732.
https://doi.org/10.1093/sf/69.3.715
[19] Pakistan Bureau of Statistics (2017) Provisional Summary Results of 6th Population and Housing Census 2017.
http://www.pbscensus.gov.pk/sites/default/files/Population_Results.pdf