Munich Personal RePEc Archive
Statistical quality by design:
certification, rules and culture
Kuurstra, Douwe and Zeelenberg, Kees
Statistics Netherlands, Statistics Netherlands
18 July 2018
Online at
https://mpra.ub.uni-muenchen.de/88227/
Statistical quality by
design: certification,
rules and culture
Content
1. Introduction 4
2. Quality and trust in statistics 5
2.1 Trust in statistics 5
2.2 Building trust in statistics 5
3. Our commitment to quality 6
4. Tools supporting quality 7
4.1 Quality Guidelines: our main tool 7 4.2 Statistical audits 8
4.3 Self-assessments 9 4.4 Process descriptions 9
5. Evaluations of quality management 9
5.1 Evaluation of the audit program 9 5.2 External proof 10
5.3 Peer Review 10
6. The way forward 11
7. Summary 13
Summary1
International law, international regulations, national law, specific statistical regula-tions, Code of Practice, Privacy, ISO 27001 (Information security) and ISO 9001 (Quali-ty management systems). These are some of the ‘rules’ that National Statistical Inst i-tutes have to work with. In this paper we look at the why and how of these rules: why should we follow these rules, how to manage these rules and how to transform them into practice. Even if an NSI complies with all principles of the Code of Practice for European Statistics, it is still necessary to have external proof of commitment to process and product quality as well as to privacy and security. We argue that to achieve and to communicate quality of official statistics, it is essential that national statistical institutes adopt some system of quality by design, i.e. formal quality certifi-cation, e.g. ISO2 or EFQM. Such an external proof is necessary in order to maintain public trust in statistics. But quality does not come by itself. The statistics that are actually produced, must have sufficient quality. So we also need a quality culture that provides a production and work environment in which quality is embedded. In es-sence, the quality culture should be based on the principles that the staff of NSIs are professionals and are responsible for the quality of their products. But their main task is to produce statistics, not to understand all those rules mentioned before. There-fore the only way to make them involved is to make them the real owners of quality; this should be our goal for the years to come. It requires embodiment of the quality culture in work processes, management, and guidelines, based on Total Quality Man-agement and plan-do-check-act cycles.
Keywords
statistical quality, privacy, certification, ISO, EFQM, LOM, TQM, PDCA, Lean Six Sigma
1 This paper has been presented at the European Conference on Quality in Official Statistics (Q2016), Madrid, 31 May-3 June 2016.
We thank Max Booleman (Statistics Netherlands) for reviewing our paper. 2
1.
Introduction
Our society is becoming increasingly more complex and dynamic, with many interac-tions between social and economic agents. This has four consequences for the role of information in our society.
First, it has made information an essential element in the functioning of society: it makes it possible for agents to cooperate, to act and to react (Shapiro and Varian, 1999). One part of this information is composed of signals, more or less implicit mes-sages which contain some information and point to some interpretation of it. For example, an advertisement that shows the price of a product, may also give the im-pression of quality, and even the price itself may convey or suggest information about the quality of the product. But the message about the quality is usually implicit or hidden, and it is costly to obtain precise information.
Secondly, because of the increasing complexity and the increasing reliance on infor-mation, information has become so important, that agents in society have become critical towards the quality and truthfulness of information. For example, in the Euro-pean Union (EU), trust in the media (radio, TV, press, internet) is less than 50 percent.
A politician has even said: “A fact is just another opinion” and someone else: “The official unemployment figure is just another opinion.”
Thirdly, the internet, and more generally, the digitalization of society, has made it possible to disseminate information in huge masses. This makes it difficult for users of information to separate the wheat from the chaff.
And fourthly, the production process of information is sometimes complex, which makes it hard to form an opinion about its quality. This holds in particular for official statistics. In the last 50 years we have seen shifts from censuses to surveys to admin-istrative data to big data. The concept and practice of censuses and adminadmin-istrative data are easy to understand: basically it is just counting. But surveys use complex methods for sampling, weighing and correcting for nonresponse; and these methods are based on a whole separate science of survey methodology. Also, methods have become increasingly complex over time. And with big data we are possibly going even further in modeling the relations between variables and between data sets (Braaksma and Zeelenberg, 2015; Zeelenberg, 2016).
All these developments and trends have made it difficult for external users to judge the quality of information. In this paper we will look at the consequences for statis-tics. In section 2 we discuss trust in statistics, quality and certification. In section 3 we will look at tools supporting quality, in section 4 at recent evaluations of the quality
2.
Quality and trust in statistics
2.1
Trust in statistics
Statistics are an indispensable element in a democratic society. They form the basis for evidence-based policies and for the public discussion about these policies. This means that the quality of statistics must be undisputed: it is socially ineffective and inefficient when discussions about social problems and policies are marred and frus-trated by quarrels about the data. However, in the previous subsection we have seen that it is difficult for users to judge the quality of information. In essence this means that users will have to trust official statistical information, without being able to veri-fy its quality.
In many countries, trust in official statistics as such is rather high. Recent surveys in Australia, Denmark and the United Kingdom show that around 60 per cent of the population say that they trust official statistics; when we leave out those without an opinion, the figure rises even to nearly 90 per cent (NatCen, 2015). However, a large part, around 75 per cent, of the population does not have trust in the way the statis-tics are being used or presented by the government and the media.
A 2015 Eurobarometer survey (TNS, 2015), found lower percentages of trust. Of Eu-ropean citizens who have expressed an opinion, more than 50 per cent do no trust official statistics; this has risen somewhat compared to the results of Eurobarometer surveys in 2007 and 2009 (TNS, 2007, 2009). However, in the Netherlands, the level of trust has fallen from 77 per cent in 2007 to 69 per cent in 2009 and risen to 72 per cent in 2015, still one of the highest in the EU. From 2009 to 2015, trust in official statistics has risen sharply in Malta (62%, +19 percentage points) and the UK (44%, +11), but fallen sharply in many countries, amongst others, Cyprus (39%, -22), Spain (27%, -16), Slovakia (42%, -13), Austria (42%, -11), Greece (45%, -11), and Belgium (48%, -10).
Thus, although part of the problem does not seem to lie with NSIs but with the gov-ernment and the media, it is obvious that trust in official statistics must be a point of concern.
2.2
Building trust in statistics
So on the one hand, it is difficult if not impossible for users to judge the quality of
official statistics. And on the other hand, the public does not as a whole seem to trust official statistics.
As described in the previous subsection, the government and the media, as
profes-sional users of statistics, also play a role here. The public does not seem to trust the way they present and use official statistics. This attitude can be influenced by the communication policies of NSIs. We should not regard ourselves as only data
But we should also look at the quality itself of our statistics. Even for such an im-portant statistic as the growth of GNP, we have some quality problems (Zwijnenburg, 2015). This cannot and does not remain hidden from our users. So we need to im-prove the quality of our most important statistics.
But when the quality of our products is in our own view “fit for use,” we must still
cope with users who cannot judge the quality. To maintain public confidence in offi-cial statistics in this age of extreme public openness and public criticism, it is manda-tory that this trust is somehow corroborated.
There are already several quality checks in official statistics. Internally, many national statistical institutes (NSIs) hold statistical audits. Externally, there are reviews of the main macro-economic statistics, such as the ROSC missions by the IMF, the checks and the ESA decisions by Eurostat, and the reports by the European Court of Auditors. But in some sense, mostly it is still statisticians checking other statisticians. So we are led to conclude that certification of the statistical production processes and outputs by means of an independent standard, such as ISO or EFQM, is necessary for this corroboration.
3.
Our commitment to quality
The mission of Statistics Netherlands is to publish reliable and coherent statistical information that meets the needs of society. In view of this mission, the quality of the statistical information must be guaranteed. The confidence of our users in figures with the brand CBS3 is very high. Naturally, we want to nourish this trust in our sta-tistics. As we have seen in the previous section, this will require external proof by means of certification. But quality does not come by itself. It must be explicitly ad-dressed in the statistical production processes that produce statistics.
For this reason Statistics Netherlands has introduced a system of quality assurance based on the highest international criteria. Statistics Netherlands aims to be one the best performing statistical institutes in an international perspective in terms of quali-ty, without using complex and detailed quality systems.
Quality management at Statistics Netherlands focuses on guiding and informing stat-isticians. It is based on two principles:
1. Every statistical team are responsible for their own quality, 2. Staff of Statistics Netherlands are conscientious professionals.
It is not efficient nor would it be acceptable for staff members in a modern organiza-tion, if we were to check every action of every statistician in every statistical process. Simply put, we cannot have an auditor standing behind each statistician. So to
achieve quality we have to rely to a very large extent on the statistical conscience and statistical expertise of statisticians and managers. In other words: in our NSIs, we have to create, and rely on, a quality culture. Such a quality culture does not arise
itself or happen spontaneously. It is the embodiment of existing knowledge and
prac-3
tice and of previous experience. This fits in with the PDCA (Plan-Do-Check-Act) cycle emphasized by the ISO 9001 standard on quality management as well as with the objectivity principle from the European Statistical Law.4 So we need to embody qual-ity and qualqual-ity culture in management and work guidelines and tools, and embed these in a PDCA cycle.
4.
Tools supporting quality
At Statistics Netherlands we have 4 major tools that support quality: quality guide-lines, statistical audits, self-assessments and process descriptions.
4.1
Quality Guidelines: our main tool
The general framework for quality management at Statistics Netherlands is set by the
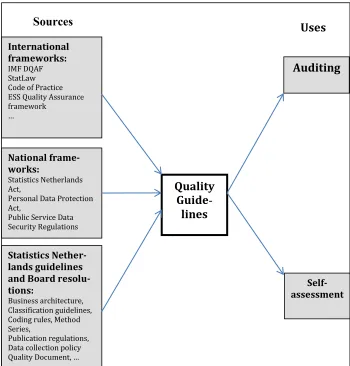
Statistics Netherlands Quality Guidelines. Our Quality Guidelines integrate all relevant international, national and Statistics Netherlands’ regulations and other rules about statistical processes and products, and provide a basis for the organization of design, production and quality management; see Figure 1.
At this moment there are 40 sources for the quality guidelines. The Quality Guide-lines contribute to:
– achievement of Statistics Netherlands’ mission;
– achievement of Statistics Netherlands’ core values: reliability, relevance, co n-sistency and timeliness. Statistics Netherlands also takes due care with regard to privacy and confidentiality;
– conformity with legislation;
– the trust of all stakeholders in Statistics Netherlands and its products;
– stakeholder satisfaction with the products of Statistics Netherlands;
– the image and reputation of Statistics Netherlands;
– the transparency of Statistics Netherlands. Moreover, the Quality Guidelines:
– serve as input and explanatory notes for the audit framework;
– serve as input and explanatory notes in setting the self-assessment questions;
– provide a framework for statistical process redesign and adaptations;
– ensure conformity with existing lower-level frameworks.
4
4.2
Statistical audits
Our 18 key statistics and 78 most important statistical processes comprise products which are very important for the image and reputation of the institute. They are subject to statistical audits on a regular basis.
[image:9.595.169.519.258.624.2]An audit team evaluates these processes every three years. The audits are managed by a central department according to ISO 19011 (Guidelines for auditing manage-ment systems). The auditors themselves are all internal statisticians and methodolo-gists. Audits are reported directly to the director-general. The results of
Figure 1. Quality Guidelines: Sources and Uses
the audits are used by process owners to plan improvement actions. The audit framework is fully consistent with the Quality Guidelines. The director-general can also order an audit on other processes on an ad hoc basis or in the case of an emer-gency.
Sources
Self- assessment International frameworks: IMF DQAF StatLaw Code of Practice ESS Quality Assurance framework … National frame-works: Statistics Netherlands Act,Personal Data Protection Act,
Public Service Data Security Regulations
…
Statistics Nether-lands guidelines and Board resolu-tions:
Business architecture, Classification guidelines, Coding rules, Method Series,
Publication regulations, Data collection policy
Quality Document, …
Quality
Guide
-lines
4.3
Self-assessments
All statistical processes are required to complete a self-assessment about its quality: each year for the key statistics and most important statistical processes, and at least once every three years for the other statistical processes. The self-assessment ques-tionnaire is fully consistent with the Quality Guidelines. The purpose of the self-assessment is to identify points for improvement. Process owners compile action plans based on the results of the self-assessment.
4.4
Process descriptions
Quality Documents are mandatory for all 280 statistical processes. These documents contain a process description, a list of information systems, a list of relevant docu-mentation, agreements with data users and data suppliers, a completed self-assessment, and an action plan. The Quality Document is regularly updated: yearly for the key statistics and most important statistical processes and three-yearly for other statistical processes. The update process is planned and monitored.
5.
Evaluations of quality
man-agement
5.1
Evaluation of the audit program
In 2013 we have evaluated our system of quality assurance and in particular the audit program. The evaluation of our audit program concluded that our audits were widely accepted but that they were very costly and had a long completion time (cf. Boole-man and Zeelenberg, 2012). A single audit took at average about 850 working hours and half a year to complete. In times of shrinking budgets we could not afford to go on with those audits and our clients told us that although the quality of our reports was good, the completion time was too long. They wanted to act faster on imperfec-tions and did not want to wait half a year before the final audit results were present-ed.
5.2
External proof
In 2014 there was a big issue in The Netherlands on privacy: a healthcare authority had not enough protected its data about individuals. This acted as a trigger to start
with external certification of our privacy protection, ‘external’ because we want to
deliver an independent proof to the public.
In 2015 we got our first certificate privacy proof. We concluded not only that this is a good method to prove to the public our involvement with privacy but also that it helps us to improve our information security system. The approach consists of three steps: a fit-gap analysis, filling the gap, and certification. The statistical departments appreciated this approach very much, in particular because turn-around time was brief and there was, in the second step, scope for actual improvements. So we decid-ed to go further with privacy certification, and in 2018 all processes of Statistics Netherlands will be proven privacy proof.
In the meantime the Dutch government has required its departments to meet the information security standard ISO 27001. To achieve this, Statistics Netherlands has made a roadmap, based on a fit-gap analysis; in 2017 Statistics Netherlands was certi-fied for ISO 27001 and in 2018 for the ESS IT Security Framework.
5.3
Peer Review
The 2015 ESS Peer Review on compliance with the Code of Practice in the Nether-lands was very positive. The Peer Review team concluded that Statistics NetherNether-lands, and by extension the production of European statistics in the Netherlands, is very highly and uniformly compliant with all principles of the Code of Practice. But the peer review also concluded: Statistics Netherlands should take measures to embed more deeply its quality management and assurance procedures throughout the or-ganization and consider also, in the context of external communication, the adoption of recognized industry standard quality assurance/certification systems. At Statistics Netherlands, we have therefore taken the decision to certify the statistical produc-tion processes according to the ISO 9001 standard on quality management. We have established a program that aims at having certified most processes before 2019. For several reasons, Statistics Netherlands has chosen the general quality-management standard ISO 9001 instead of ISO 20252, that specifically pertains to market, opinion and social research. First, ISO 9001 focuses on product quality and customer satisfaction, which are exactly the topics which are of most interest for Statistics Netherlands. By improving those elements and by emphasizing the plan-do-check-act cycle, we believe we can make a step forward. We think we will benefit most if we improve the management system from the level of individual teams up to the level of the board. Additional reasons are
– ISO 9001 is widely adopted, accepted and known (more than 1 million certifi-cates).
– ISO 9001 can also be used for IT (beside ISO 27001) and for other non-statistical processes. So each process, not only statistical ones, of Statistics Netherlands can introduce ISO 9001.
– Statistics Netherlands has introduced Lean Six Sigma as a tool for improving the operation of all its processes, not only the statistical ones (Smekens and Zeelen-berg, 2015).
6.
The way forward
These decisions lead to some challenges:
– How to manage this as a quality department and how can we make this un-derstandable and manageable for our colleagues?
– How to cope with all those rules?
In our vision we maintain our main tool; our Quality Guidelines. This is our theoretical backbone. On the other hand we try to combine the information about our weak-nesses to create a new approach.
First of all the guidelines have to evolve. At present we try to integrate all relevant regulations and rules into our Quality Guidelines. At this moment the Quality Guide-lines is a book of almost 200 pages. We cannot continue this way, otherwise the guidelines will increase and increase. We have to think carefully about the way to go; keeping our backbone but also keeping it manageable and usable as a reference book.
‘Reference’ because we cannot expect the statisticians to read this book before cr e-ating a new process. ‘Book’ because we do not know if a printed or electronic book is a good form to maintain the guidelines, maybe a database or another form of virtual collection is a better way.
The problem with all those rules is the sheer number of rules and the theoretical language. Therefore we have to diminish the number of rules our colleagues are confronted by. The present Quality Guidelines are a collection of all the sources, as shown in Figure 1. Instead, we could derive from this collection more concrete statis-tical rules and norms (quality controls), so translate the sources into rules and norms that may be directly applied in statistical production processes. In other words, the present Quality Guidelines are seen more as an intermediate step than as a final product. Additionally, we may collecting them into easy to understand themes, which do not need much explication and which do not have a lot of subtopics. These
themes should have common names, for instance quality management, data protec-tion, information security, resources, methodology, publication regulations.
For the different subjects in a theme it has to be decided if the rule is relevant on a
general level or on a specific level. For instance for Statistics Netherlands a lot of rules on resources and IT, security, privacy and data protection are arranged on a general level, i.e. at the level of the NSI as a whole. This means that individual
man-agers of specific statistical processes do not have any influence at all. As a conse-quence they should not be asked how they organize these central items. On a specific level, i.e. at the level of a team or process, one should only be questioned on subjects
All these themes are copied to the general and specific self-assessments with simple yes/no questions. A simple start question is: “did you change your production pr
o-cess in the last year?” If you did change your proo-cess you have to check more than if
you did not.
Questions to be asked every year are for instance “did you evaluate your input with
your supplier”, “did you evaluate your products with your customers”, “are all inte
r-mediate files removed”, and “did you check the access permissions to the data.” Questions about classification and methodology do not need to be asked every year, depending on the importance of the process. For instance, you can ask from the consumer price index or from unemployment statistics to check, or better to have checked by internal or external experts, their methodology every three years but for statistics about slaughtering or forestry a period of once every ten years seems enough. It is up to the Board of Statistics Netherlands to decide about such things. Today a assessment has 37 pages, in our view the challenge is to create self-assessments of a maximum of two pages. A self-assessment is in first instance used to identify gaps. If there are gaps the process owner has to calculate the risk involved and make a decision: will I reduce the risk and if so, when? Both general
self-assessments and specific self-self-assessments are input for internal and external audits. Every process should be audited every year. Within Statistics Netherlands we have about 280 statistical processes but resources are limited, so we have to work very efficient. Therefore we start with grouping statistics in clusters. One criterion can be
‘relative importance of the subject’. This means that more important statistics are more frequently audited. Another possible criterion is ‘management processes’. We
start to audit one process from an owner and if that is all right and the rest of the processes have an identical management process, a quick scan is enough. Every audit begins with the self-assessment and we can focus on a selection of themes. Every year we can take a different selection and we can even use different selections for different statistical processes. In our vision the quality department determines the selection according to the maximal possible benefit for the organiza-tion. The selection consists of three parts: a random part equal for every process. A
part decided as ‘general interest’, also for every process. And finally a part specific for
a certain process. This last part is based on the self-assessment and our knowledge of a process.
The way we audit will also change. Until now the approach was: “tell me what you
are doing and I will tell you what is right and what is wrong.” The new approach is: “prove to me that you are in control.” In the past it took a lot of time find gaps.
Therefore auditors had to understand the documentation and the process. Now we are asking our colleagues to share their knowledge and to show us that they are
7.
Summary
First, for external users quality is difficult to judge. In essence this means that users will have to trust official statistical information. To maintain this public confidence in official statistics in this age of extreme public openness and public criticism, it is mandatory that this trust is somehow corroborated. Certification of the statistical production processes and outputs by means of an independent standard, such as ISO or EFQM, is necessary for this corroboration.
Secondly, it is not efficient nor would it be acceptable for staff members, if we were to check every action of every statistician in every statistical process. Simply put, we cannot have an auditor standing behind each statistician. So to achieve quality we have to rely to a very large extent on the statistical conscience and statistical exper-tise of statisticians and managers. Such a quality culture comes not by itself, but needs to be achieved by embodying it in management and work guidelines, based for example on Lean Operational Management (LOM), and needs to be supplemented by additional means such as quality sessions.
Thirdly, the proof of the pudding is in the eating, and so we must ensure that quality is actually embodied in the statistical products that are being disseminated. For this we need a variety of tools, such as implementation of statistical quality from the start in development of statistical processes, quality guidelines, and quality indicators, supplemented by a plan-do-check-act (PDCA) cycle that is an essential element of various quality systems such as TQM and Lean Six Sigma.
References
Booleman M. and K. Zeelenberg, 2012, The business case of quality management at Statistics Netherlands. Paper presented at the European Conference on Quality in Statistics, Athens, 30 May 2012.
http://www.q2012.gr/articlefiles/sessions/-1.2_Zeelenberg_The%20business%20case%20of%20quality%20management%20at% 20Statistics%20Netherlands.pdf
Braaksma B. and K. Zeelenberg, 2015, “Re-make/Re-model:" should big data change the modelling paradigm in official statistics? Statistical Journal of the IAOS 31(2), 1-10. doi: 10.3233/SJI-150892
EU (European Union), 2009, Regulation on European Statistics. Official Journal of the European Union, OJ L 87, 31.3.2009, pp. 164–173. http://eur-lex.europa.eu/eli/reg/-2009/223/oj
ISO, 2012, Market, opinion and social research -- Vocabulary and service require-ments (ISO 20252:2012). https://www.iso.org/standard/53439.html
ISO, 2015, Quality management systems – Requirements (ISO 9001:2015). https://-www.iso.org/standard/62085.html
ISO, 2018, Guidelines for auditing management systems (ISO 19011:2018 ). https://www.iso.org/standard/70017.html
NatCen, Public confidence in official statistics. London, 2015. http://natcen.ac.uk/our-research/research/public-confidence-in-official-statistics
OECD, 2013, Government at a Glance 2013, OECD Publishing, Paris. http://dx.doi.org/10.1787/gov_glance-2013-en
Shapiro, C. and Varian, H., 1999, Information rules: a strategic guide to the network economy. Harvard Business Publishing, Boston.
Smekens M., and Zeelenberg, K., 2015, Lean Six Sigma at Statistics Netherlands, Sta-tistical Journal of the IAOS 31(4), 583-586, doi: 10.3233/SJI-150930
TNS, 2007, Europeans’ knowledge of economical indicators. Special Eurobarometer. European Commission, Brussels. http://www.oecd.org/site/worldforum06/-39562127.pdf
TNS, 2010, Europeans’ knowledge of economic indicators. Special Eurobarometer 323. European Commission, Brussels. http://ec.europa.eu/public_opinion/archives/-ebs/ebs_323_en.pdf
TNS, 2015, Europeans and economic statistics, Standard Eurobarometer 83. European Commission, Brussels. http://ec.europa.eu/public_opinion/archives/eb/eb83/-eb83_en.htm
Zeelenberg, K., 2015, Product and service innovation at Statistics Netherlands. Paper for the Seminar on Modernization of Statistical Production and Services and Manag-ing for Efficiency at the 63rd plenary session of the Conference of European Statisti-cians, Geneva, 16 June 2015.
http://www.unece.org/-index.php?id=38920#jfmulticontent_c48917-3
Zeelenberg K., 2016, Methodological Challenges in Official Statistics. Proceedings of
the 2016 International Methodology Symposium, Statistics Canada, Ottawa (Ontario, Canada). https://www.statcan.gc.ca/eng/conferences/symposium2016/program/-14704-eng.pdf
Zwijnenburg, J. 2015, Revisions of quarterly GDP in selected OECD countries. OECD
Explanation of symbols
Empty cell Figure not applicable
. Figure is unknown, insufficiently reliable or confidential * Provisional figure
** Revised provisional figure 2017–2018 2017 to 2018 inclusive
2017/2018 Average for 2017 to 2018 inclusive
2017/’18 Crop year, financial year, school year, etc., beginning in 2017 and ending in 2018
2015/’16–2017/’18 Crop year, financial year, etc., 2015/’16 to 2017/’18 inclusive
Due to rounding, some totals may not correspond to the sum of the separate figures.
Colophon
Publisher
Statistics Netherlands
Henri Faasdreef 312, 2492 JP The Hague www.cbs.nl
Prepress
Statistics Netherlands
Information
Telephone +31 88 570 70 70, fax +31 70 337 59 94 Via contactform: www.cbsl.nl/information
© Statistics Netherlands, The Hague/Heerlen/Bonaire 2018.