TABLE OF CONTENTS: VOL. 47, NO. 4, JULY 1994
ARTICLES
Economics
258 Extended grazing systems for improving economic returns from Nebraska sandhii cow/calf operations by Don C. Adams, Richard T. Clark, Sean A.
Coady, James B. Lamb, and Merlyn K. Nielsen
264 Government policy effects on cattle and wikllife mmzhing proftts tn Zimbabwe by Urs P. Kreuter and John P. Workman
270 Cattle grazing white locoweed in New Mexico: Influence of grazing pressure and phenological growth stage by Michael H. Ralphs, David Graham and Lynn F. James
275 Storms ifiuence cattle to graze larkspur: An observation by Michael H.
Ralphs, Don T. Jensen, James A. Pfiste,r Darwin B. Nielsen, and Lynn F. James
Grazing Management
279 Defoliition of a northern wheatgrass community: Above- and belowgmund j phytomass productivity by Jun Zhang and James T. Romo
285 Runoff and erosion in intercanopy zones of pioyon-juniper woodlands by Bradford P. Wilcox
Improvement
2% Vegetative response to burning on Wyoming mountain-shrub bii game ranges by John G. Cook, Terry J. Hershey, and Larry L. Irwin
Plant Animals
303 Pratebt suppb?mentation of stocker cattle in the Northern Grv& Plains by Elaine E. Grings. Don C. Adams, and Robert E. Short
Fr&eren& of mule deer for 16 grasses found on Intermountain winter ranges by Dennis D. Austin, Richard Stevens, Kent R. Jorgensen and Philip J umess
-. -
Published bimonthly-January, March, May, July, September, November
Copyright 1994 by the Society for Range Management
lNDlVlDUALSUBSCRlPTlON is by membership in the Society for Range Management.
LIBRARY or other INSTITUTIONAL SUBSCRIP- TIONS on a calendar year basis are $56.00 for the United States postpaid and $66.00 for other coun- tries, postpaid. Payment from outside the United States should be remitted in US dollars by interna- tional money order or draft on a New York bank.
TECHNICAL NOTE:
312 Influence of duration of exposure to field conditions on viability of fecal sam- ples for NIRS analysis by Eneas R. Leite and Jerry W. Stuth
BOOK REVIEWS
315 Building soils for Better Crops edited by Fred Magdoff; Essentials of Conservation Biology edited by Richard B. Primack; The Grass Genera of the World edited by Leslie Watson and Michael J. Dallwitz; Sagebrush Country edit- ed by Ronald J. Taylor; and Wildlife-Habitiat Relationships: Concepts and Applications edited by Michael Morrison
317 JRM Style Manual
BUSINESS CORRESPONDENCE, concerning sub- scriptions, advertising, reprints, back issues, and related matters, should be addressed to the Manag- ing Editor, 1839 York Street, Denver, Colorado 80206.
EDITORIAL CORRESPONDENCE, concerning man- uscripts or other editorial matters, should be addressed to the Editor, Gary Frasier, 8032 Glade Rd., Loveland, Colorado 80538. Page proofs should be returned to the Production Editor, 1839 York Street, Denver, Colorado 80206.
INSTRUCTIONS FOR AUTHORS appear on the inside back cover of most issues. A Style Manual is also available from the Society for Range Manage- ment at the above address @$4.00 for single copies.
THE JOURNAL OF RANGE MANAGEMENT (ISSN 0022-409X) is published bimonthly for $56.00 per year by the Society for Range Management, 1839 York Street. Denver. Colorado 80206. SECOND CLASS POSTAGE paid at Denver, Colorado, and additional offices.
POSTMASTER: Return entlre journal with address change-RETURN POSTAGE GUARANTEED-to Society for Range Management, 1839 York Street,
PRINTED IN USA
Denver, Colorado 80206.-
Managing Editor
CHARLES B. (BUD) RUMBURG 1839 York Street
Denver, Colorado 80208
Editor Gary Frasier
8032 Glade Rd.
Loveland, Colo. 80538 Production Editor PATRICIA M. PEREZ
Society for Range Management 1839 York Street
Denver, Colorado 80208 (303) 355-7070
Book Revlew Editor DAVID L. SCARNECCHIA
Department of Natural Resource Sci.
Washington State University Pullman, Washington 99164-6410
ASSOCIATE EDITORS MARSHALL HAFERKAMP
DON ADAMS USDA-ARS
West Central Res. 8. Ext. Center Livestock 8 Range Res. Station
Route 4 Route 1
Box 46A Box 2021
North Platte, Nebraska 89101 Miles City, Montana 59301
JOHN A. CRAWFORD Dept. of Fisheries and Wildlife Nash 104
Oregon State University
DAVID ENGLE Agronomy Department Oklahoma State University Stillwater, Oklahoma 74078
STUART P. HARDEGEE USDA-ARS
Northwest Watershed Res. Center 800 Park Blvd Plaza IV #105 Boise, Idaho 83712
KRIS HAVSTAD USDA-A%, Dept. 3JER Box 3003, NMSU
Las Cruces, New Mexico 88003 G. FRED GIFFORD
Environmental and Resource Sciences/l86
1000 Valley Road University of Nevada Reno. Nevada 89512-0013
HERMAN S. MAYEUX, JR.
USDA-ARS
808 E. Blackland Road Temple, Texas 76502
RICHARD F. MILLER Squaw Butte Exp. Sta.
Highday 205 Burns, Oregon 97720
JAMES A. PFISTER USDA-ARS 1150 East 1400 North Logan, Utah 84321
GERALD E. SCHUMAN USDA-ARS
High Plains Grasslands Research 8408 Hildreth Road
Cheyenne, Wyoming 82009
JOHN A. TANAKA P.O. Box 1702
La Grande, Oregon 97850
J. Range Manage 47:258-263, July 1994
Extended grazing systems for improving eco- nomic returns from Nebraska sandhills cow/calf operations
DON C. ADAMS, RICHARD T. CLARK, SEAN A. COADY, JAMES B. LAMB, AND MERLYN K. NIELSEN
Clark and Adams are associate professors, and Coady and Lamb are research associates, University of Nebraska- Lincoln, Institute of Agriculture and Natural Resources, West Cenrral Research and Extension Center, Route 4, Box 464, North Platte 69101, Nielsen is professor University of Nebraska- Lincoln 68583.
Abstract
Three winter treatments were cross classified with 2 spring treatments to create 6 feeding and grazing systems utilizing Nebraska sandhills range and subirrigated meadow forage.
Systems were evaluated with multiparous crossbred beef cows over 4 years (240 head beginning year 1). Systems were: 1) graz- ing range during winter; 2) grazing subinigated meadow during winter; and 3) full feed of meadow hay during winter; in combi- nation with either: a) full feed of subirrigated meadow hay dur- ing May, or b) grazing subirrigated meadow during May. From June through November all cows grazed range. The feeding and grazing systems were compared with selected linear contrasts and evaluated with respect to variable input prices. Some differ- ences ln cow body weight and body condition occurred but dif- ferences were considered small. Throughout the study, cows on all systems generally maintained a body condition score of about 5 (1 to 9 scale) year long. Inputs of hay were reduced by grazing range or subirrigated meadow during winter and during May without affecting pregnancy rate. Weaning weight of calves was increased 5.0 kg by grazing meadow during May compared to feeding hay during May. When opportunity costs were included in the analysis, the most profitable system involved grazing subirrigated meadow during winter and during May. Grazing subirrigated meadow during May enhanced the profitability of all wintering systems.
Management project in Nebraska found that harvested forage costs ranged from 18 to 24% of total cost per weaned calf (Rasby et al.
1989). Reducing the feeding of harvested forage while maintaining or enhancing cow performance could substantially increase the prof- itability of cow/calf producers and lower overall costs of beef pm duction. Greater reliance on the cow rather than machines for forage harvesting is one method for reducing feed costs (D’Souza et al.
1990). Extending winter grazing on rangeland and/or subirrigated meadows would reduce inputs of harvested forage. In the Nebraska sandhills, a further savings in feed costs might also be realized by grazing subirrigated meadows in early spring, a time when upland range is dormant and hay is usually fed. A survey of Nebraska Sandhills ranches estimated that about 50% contained some subirri- gated meadows (Clark and Coady 1992); only 14% of those with meadows grazed them in the spring (Coady and Clark 1993).
A 4-year study was initiated in 1988 to determine the effects of extending common grazing dates for cattle by grazing upland range during winter and subinigated meadows in May. The 2 major objec- tives were: 1) to measure the impacts on cow/calf production under alternative forage treatments during the winter (gestation) and between calving and breeding (prebreeding), and 2) evaluate the impacts of the alternative forage treatments on costs and returns to a cow/calf producer. Our hypothesis was that by extending the grazing season in winter and spring, profitability would be increased over tra- ditional systems which use a greater amount of harvested forage.
MATERIALS AND METHODS Key Words: rangeland, subirrigated meadow, beef cattle, partial
budgets, stochastic dominance, net returns
Profitability of the beef cattle industry depends in part on its ability to compete with other meat industries. To compete effectively, the industry must continue to lower costs per pound of meat produced (Barkema and Drabenstott 1990). Feeder cattle (i.e., weaned calves) account for about three-fifths of the total cost of finished cattle. Feed costs make up about one-fourth of the costs of raising feeders (Barkema and Drabenstott 1990). An Integrated Resource
The authors wish to acknowledge the High F’lains Climate Center at the University of Nebraska-Lincoln for assistance in preparing and providing climate data for this study.
Published with the approval of the dir of the Nebraska Aer. Res. Div. as Journal --
ser. no. 10501.
Manuscript accepted 15 Jan. 1994.
Forage and Cattle Procedures
Two-hundred-forty crossbred cows, 3 to 7 years of age, were ran- domly assigned within age during 1988 to 3 winter treatments and 2 spring (prebreeding) treatments which were cross classified to create 6 forage systems (3 X 2 = 6 systems; Table 1). Treatments were replicated over 4 years. Cows were l/4 Hereford, 114 Angus, l/4 Simmental and l/4 Gelbvieh. Year-long management was comprised of 4 periods: a) winter (gestation), 15 November-l March; b) calving, 2 March-30 April; c) prebreeding, 1 May-31 May; and d) breeding and surnme.r management, 1 June-15 November. A 60-day breeding season began 15 June each year. Winter treatments were: 1) 1.36 kg/cow of a commercial 32% crude protein (0% non-protein nitro- gen) supplement fed every other day to cows grazing range, 2) graz-
258 JOURNAL OF RANGE MANAGEMENT 47(4) July 1994
Table 1. Treatment (system) description with correspon~mg management period.
Treatment (1) Winter-range May-hay
Gestation Calving
15 Nov.-l Mar. 1 Mar.-l May
Range Hay
Rebreeding 1 May-l Jun.
Hay
Breeding- Weaning 1 Jun.-15 Nov.
Range
Hay
Hay
Hay
Hay
&Y
Meadow grazing
=Y
Meadow grazing
Hay
Meadow grazing (2)
Winter-range May-meadow
(3) Winter-hay May-hay
(4) Winter-hay May-meadow
(5) Winter-meadow May-Hay
(6) Winter-meadow May-Meadow
Hay
Hay
Meadow grazing
Meadow grazing
Range
Range
Range
Range
ing subirrigated meadow, with the same protein supplement as in treatment 1 fed at 1.36 kg*cow’*dayL during days of heavy snow or sub-zero temperature, and 3) meadow hay (approximately 8.0%
crude protein) fed daily ad libitum. Spring treatments consisted of:
1) meadow hay (about 8.0 % crude protein) offered daily ad libitum, and 2) grazing new growth on subirrigated meadow. The appropriate amount of supplement was fed by a pickup truck with a supplement feeder equipped with an electronic scale. Hay was fed from stacks (about 6.4 metric ton) of long stem hay by a stack mover/feeder pulled by a lOO-horsepower tractor; during 1991 and 1992 the feed- er/stacker was equipped with an electronic scale to weigh the amount of hay fed.
The study site was sands, choppy sands, and subirrigated meadow sandhill sites on the University of Nebraska-Lincoln Gudmundsen Sandhills Laboratory near Whitman, Nebraska. The dominant grass species were blue grama [Boutelouu grucilis (H.B.K.) Lag.ex Griffiths], little bluestem [Schizachyrium scoparium (Michx.) Nash], prairie sandreed [Culamovilfa longifoliu (Hook.) Scribn.], sand bluestem (Andropogon hullii Hack.), switchgrass (Panicurn virgatum L.), sand lovegrass [Erugrostis trichodes (NW.) Wood], and indian- grass [Sorgasfrum nutuns (L.) Nash]. Common forbs and shrubs include western ragweed (Ambrosia psilostuchyu DC.) and leadplant [Amorphu canescens (Nutt.) Pursh].
The subirrigated meadow soils are classified as Gannett-Loup fine sandy loam (coarse-loamy mixed mesic Typic Haplaquoll).
Dominant meadow vegetation was smooth bromegrass (Bromus iner- mis Leyss.), redtop (Agrostis stoloniferu L.), timothy (Phleum prufense L.), slender wheatgrass [Agropyron truchycaulum (Link) Malte], quackgrass [Agropyron repens (L.) Beauv.], Kentucky blue- grass (Pea prutensis L.), prairie cordgrass (Spartinu pectinutu Link), and several species of sedges (Curex spp.) and rushes (Juncus spp.
and Eleochuris spp.). Less abundant grass species were big bluestem (Andropogon gerudii Vitman), indiangrass, and switchgrass.
Legumes were a minor component of the vegetation.
Precipitation was measured at the Gudmundsen Sandhills Laboratory at an automated weather data network station operated by the High Plains Climate Center at the University of Nebraska-
JOURNAL OF RANGE MANAGEMENT 47(4) July 1994
Lincoln.
Cow body weights and body condition scores were taken precalv- ing (1 March), prebreeding (1 June), and at weaning (15 October).
Body condition scores were assigned using visual observations and a scoring system from 1 to 9, with 1 being extremely thin and 9 being extremely fat. Calf weights wev taken at birth, 1 June, and at wean- ing. Cows were pregnancy checked at weaning by rectal palpation, and open cows were removed from the study. Replacement cows were not added to the study.
Treatment, year, and treatment X year were included in the analy- sis of variance for cow traits; sex of calf, sex of calf X year, and sex of calf X treatment were included in the analysis of calf traitsPregnancy rates were transformed to logits (Cox 1970). ana- lyzed by weighted least squares, and tested using the &i-square dis- tribution. Treatments were compared with orthogonal contrasts (Table 2); error terms were treatment X year and treatment X year X sex of calf for cow and calf traits, respectively.
Table 2. Linear contrasts for treatment comparisons.
Contrast Description Treatment
1 No May grazing vs May grazing 1+3+5 vs 2+4+6 2 Winter-hay vs Winter-range +
Winter-meadow 3+4 vs 1+2+5+6
3 Winter-range vs Winter-meadow 1+2 vs 5+6 4 Interaction: did performance on May
treatment depend on winter treatment (i.e., grazing or hay)?
5 Interaction: did performance on May treatment depend on winter grazing treatment (meadow or range)?
’ See table 1 for treatment description.
2+3+6 vs 1+4+5
1+6 vs 2+5
259
$340 $360 $380 $400 $420 $440 $460 $480
WR-MH WR-MM vitl-tdn WH-MM WM-MH WM-m
w ---a_ . . . . m-e .-..-.. .-.a.
(I) (2) 0) (41 (9 (6)
t
. ..-
.* ** b-.017/ ’ 1
I
i *
.:‘b-.04*?’
i
.a* / i
,______L,__,-,,,,,,,,, :
:
Net Return Per Calf
WR = Winter Range, WH - Winter Hay, WM = Winter Meadow MH = May Hay, MM = May Meadow
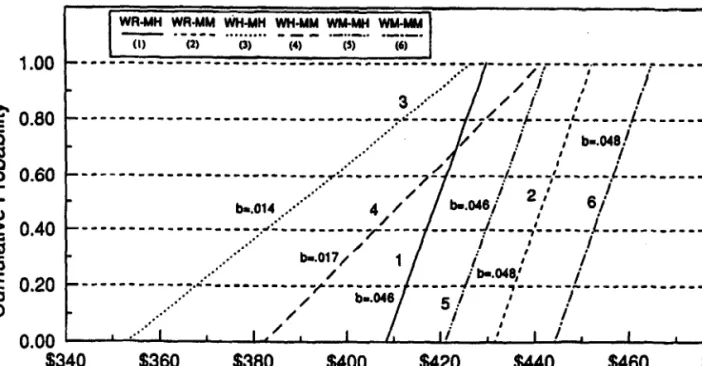
Fig. 1. Cumulative distribution of net returns for 6 forage and grazing systems.
Economic Procedure
Each treatment was evaluated for its potential effect on net returns.
The analysis was based on a ranching operation with a resource endowment sufficient to support each forage management altema- tive. The economic analysis was based on sensitivity of the forage management alternatives to input price variability and was conducted using partial budgeting. Animal performance was incorporated into the economic analysis only through calf production because pregnan- cy rate was similar (&O. 10) among treatments.
The 4 years of calf weaning weight data were. pooled because the treatment X year interaction was not significant. Cow death loss, calf death loss, and cows culled for health reasons were assumed to be random events because none of these losses could be attributed to the imposed treatments. To maintain consistency, aggregate supplemen- tal hay and feed, as well as labor demands, were also pooled across years.
Partial budgeting techniques were used to formulate a net return function for each treatment. Individual calf weaning weights and 1990 feeder calf prices (Wellman 1991) were used to construct gross returns. Prices for weaned calves were based on sex and weight. The partial budgeting cost function consisted of the following parame- ters::
Cost/hd = WHay *PHay + WSup*PSup + WRange*PLand + WMeadow*Pland + WMachine Cost + WLabor Cost + MHay*PHay + MMeadow*PLund + MMachine Cost + ML&or Cost,
Where: W denotes Winter, P denotes Price, and M denotes May.
Hay and protein supplement were charged at their market value to encompass opportunity costs. A land charge was imposed on cows grazing winter range or winter meadows at a rate of half the preced- ing summer range rental rate on an animal unit month (AUM) basis.
An active winter grazing market does not exist; therefore, sensitivity
of the results to 25 and 75% of summer rental rate was examined.
The alternative winter pasture rates had no impact on the overal results; therefore, 50% of summer rate was used. A land charge was imposed on grazing cattle because cows being fed hay are implicitly charged for land through the hay. ‘Ibe land charge for grazing winter meadows was adjusted upwards, because meadows provide more of the animal’s protein requirement than range. The machinery comple- ment for feeding hay included a 100 horsepower tractor pulling a stack mover/feeder. The stack mover is capable of feeding a 6.4 met- ric ton stack and, assuming a feeding rate of 16 kg of hayvow’*day’, can feed a herd of 400 animals with a single pass; therefore, a 400- cow herd size was assumed for all treatments. Protein supplement was assumed to be fed using a feed truck. Spring costs were handled in a similar manner, except cow/calf pairs grazing meadows in May were charged for land at a rate equal to the summer rental rate. Net returns are &urns to factors of production such as health manage-
Table 3. Bay and supplement inputs during gestation, calving and urebreedmg of cows on various forage treatments.
Treatmentsa Gestation Calving &breeding
_____________k&OW____________
Winter range - May hay 70 supplement 1188hay 614 hay Winter range - May meadow 70 supplement 1188 hay
Winter hay - May hay 1418 hay 1188 hay 614 hay Winter hay - May meadow 1418 hay 1188 hay
Winter meadow - May hay 27 supplement 1188 hay 614 hay Winter meadow - May meadow 27 supplement 1188 hay
a Weights for hay fed is based on records obtained during 199 I and 1992.
260 JOURNAL OF RANGE MANAGEMENT 47(4) July 1994
Table 4. Cow body weight, bedy rendition score, and pregnancy rate of 6 forage treatments over 4 years.
Treatments’ Contrasts
Interaction
Winter Range Winter Hay Winter Meadow May Winter (May X winter)
Hay vs Hay vs Range vs Hay vs Rangevs
May May May May May May meadow grazing meadow grazing meadow
Item Hay Meadow Hay Meadow Hay Meadow (1Y (2) (3) (4) (5)
No cows 137 138 136 131 125 138
---_______________Cow~yweight,kg________________
Precalving 552 551 562 565 548 547 NSC NS NS NS NS
Prebreeding 507 511 524 527 512 519 NS * * NS NS
Weaning 543 553 546 559 542 551 * NS NS NS NS
-______ ____ _____Cow~ycondi~on~o~_______________
halving 5.1 5.2 5.3 5.3 5.1 5.2 NS NS NS NS NS
&breeding 4.8 4.9 5.0 5.1 4.1 5.0 * NS NS NS *
Weaning 5.4 5.4 5.3 5.5 5.3 5.4 NS NS NS NS NS
_____ __________cowp~gn~cy~~,~_________ _____
pFv=Y 91.2 93.5 93.1 94.6 91.0 96.0 NS NS NS NS NS
“bAl1 year effects were sigaitkaat Pd.01 ; all treabacnt X year interactions wcrc nonsignificant Ao.05; data not shown Nunhers ia parentheses arc contrasts as shown in Table 2.
c NS = Not significant Ao.05.
l Significant Pd.05 .
ment (veterinarian, vaccinations), production risk (cow death loss, conception), unpaid family labor, labor not attributed to treatment differences, summer grazing, hay fed during calving, equipment, and overhead.
Nutrient requirement tables (NRC 1984) show that cows fed hay containing 8% protein and 55% Total Digestible Nutrients (TDN) require 11.3 kg*head-‘*day’ during gestation and 14.4 kg*head’*day-I during lactation (9 kg milk/day), as fed basis. Over the study period, observed feeding rates for hay averaged 13.5 kg*head’*day-’ over winter and 19.8 kg*head’day’ between calving and breeding, repre- senting a feeding regime of 120% and 140% of estimated require- ments (NRC 1984) for gestation and lactation, respectively. While some hay wastage is unavoidable, a best attainable hay feeding rate of 110% nutrient requirements during gestation and lactation was assumed for treatments being fed hay for the economic analysis.
Assuming hay was fed at 110% NRC requirements biases the results in favor of the treatments being fed hay: however, the assumption allows the analysis to occur assuming high feeding efficiency for all treatments.
Sensitivity of the treatments to input price variability was exam- ined by using a time series of hay prices, supplement prices, and pas- ture rental rates over the period of 1981-1990 (Johnson and Schroeder 1991, Nebraska Agricultural Statistics 1982-1991). The annual input prices represent 10 separate observed price relation- ships. The observed input prices were used in all possible combina- tions (10 hay prices X 10 supplement prices X 10 land rental prices) to create 1,000 input price scenarios with each price scenario assumed to be equally likely. Since the treatment X year interaction for weaning weight was not significant, only a single output price was used in the analysis. The 1,000 input-price scenarios were then coupled with calf weaning weight and calf price to estimate cumula- tive distribution functions of net returns for each treatment. Common least squares was then used to estimate linear cumulative distribution functions by regressing observations on net returns. The regression procedure has the advantage of simplifying the presentation of cumu- lative net returns while not altering the relative positions of any of the treatments.
Stochastic approximation methods were used to rank treatments as represented by the regressed, cumulative distribution functions (Ring
JOURNAL OF RANGE MANAGEMENT 47(4) July 1994
and Robison 1984). Stochastic dominance involves pair-wise com- parisons of the cumulative distribution functions for net returns of each of the 6 treatments. Ranking of treatments by first degree sto- chastic dominance (FSD) requires only one assumption, the decision maker prefers more returns to less. First-degree stochastic dominance of one treatment over another holds if the dominating treatment has a greater return at 9 probability levels compared to the dominated treatment(s). In practice, the cumulative distribution functions are plotted (e.g., Fig. 1). A function that lies completely to the right of another, without any intersections, has FSD over that other curve.
The implication for FSD is that the dominating treatment not only has higher average returns, but also higher returns for all price com- binations. The dominating treatment, therefore, is also the least risky.
If the curves intersect, then FSD is inconclusive and does not imply dominance. Second degree stochastic dominance (SSD) can be used in some cases to rank treatments when curves intersect. In addi- tion to the assumption of preferring more to less, SSD requires that the decision maker be risk averse. A risk averse individual is willing to give up some potential ‘uncertain” gain for some lesser “certain”
gain. Under SSD, treatment A will dominate treatment B if the accu- mulated area under the cumulative distribution function for A, at all points, is less than or equal to the accumulated area under treatment B’s function.
Results and Discussion
Three of the 4 years of the study were below the 30-year average in annual precipitation and 1 year was near the long term average.
Annual precipitation during 1989, 1990, 1991, and 1992 was 203 mm, 367 mm, 551 mm, and 433 mm, respectively, compared to a 30- year average of 535 mm.
Animal Performance
Amounts of supplement and hay fed are given in Table 3. Hay fed during a year varied from 3,220 kg/cow for cows fed hay during win- ter, after calving, and during May, to 1,188 kg/cow for cows that grazed winter range or winter meadow and grazed meadow during May.
261
Cow body weight, body condition score, and pregnancy rate are ing (PcO.01; 90.6 kg vs 93.7 kg) and weaning (PcO.05; 232 kg vs given in Table 4. Interactions between treatment and year and 237 kg) than calves from cows that grazed meadow during the win- between winter treatments and May treatments were nonsignificant ter. At prebreeding calves from cows fed hay during winter were (-0.05) for body weight, body condition, and pregnancy rate of heavier (PcO.01) than calves from cows grazing range and meadow cows. Cow body weight and body condition varied by year. Year during winter (94.7 kg vs 92.1 kg), but the difference was not evident
effects were not considered large. at weaning.
Precalving cow weights were similar (fiO.05) for all contrasts.
Prebreeding cow weights were greater (Pd.05) for cows fed mead- ow hay during winter than for cows on winter grazing treatments (526 kg vs 512 kg), and cows that grazed winter meadows were heavier (PcO.05) than cows that grazed winter range (516 kg vs 509 kg). At weaning, cows that grazed meadows in May were heavier (PcO.05) than those fed hay in May (556 kg vs 544 kg). Although differences in body weight of cows was observed between forage
Economic Performance
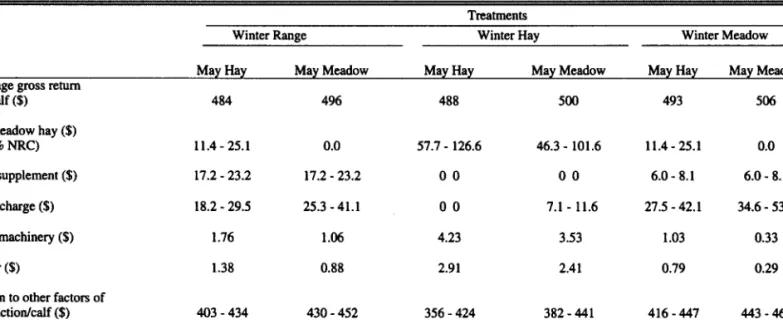
Partial budgeting costs and returns for each treatment, along with the relevant cost ranges, are illustrated in Table 6. Although the aver- age calf weaning weight was highest for winter-hay, May-meadow system, the average gross return was highest for winter-meadow, May-meadow system. This can be explained by the distribution of weaning weights and because prices used for calves are reported in
Table 5. Calf birth dote and body weight of 6 forage treaments over 4 years
Item
Treatments’
Winter Range Winter Hay
May May May May
Hay Meadow Hay Meadow
Contrasts
Interaction
Winter Meadow May Winter (May X winter)
Hay vs Hay vs Range vs Hay vs Range vs May May meadow grazing meadow grazing meadow
Hay Meadow (V (2) (3) (4) (5)
Birth date Birth Rebreeding Weanine
_______ ____-____--_____J”~~Date ________ _________
89.3 89.2 90.1 89.2 89.6 88.0 NY NS NS NS NS
_______--- --Calfbodyweight,kg-________ ________
41.1 41.1 42.6 42.8 41.8 41.7 NS ** NS NS NS
87.8 93.3 91.1 98.2 91.6. 95.7 *t ** ** NS NS
228 235 232 243 234 238 ** NS * NS NS
a All year effects were significant RO 01: all treatment X year interactions were nonsignificant Ao.05; data not shown.
b Numbers in parentheses am contrasts as shown in Table 2.
c NS = Not significant Pd.05
l Significant P<o. 05.
**Significant PdJ.01.
systems during the 4-year study, differences were small and seasonal and did not increase over time.
Although significant differences in body condition occurred pre- calving, prebreeding and at weaning, differences were small (0.1 to 0.2 score); and cows on all treatments maintained a body condition score near 5.0 during the study. A body condition score of 5.0 is con- sidered moderate and adequate for a high pregnancy rate (Richards et al. 1986). The relatively small variation in body condition score throughout the year for all treatments indicates that each of the for- age systems was effective in meeting nutrient requirements of the cow.
Pregnancy rate averaged 93.2% over the 4 years and across all treatments and was similar to pregnancy rates reported for a 70day breeding season in the sandhills (Deutscher et al. 1991). All contrasts for pregnancy rate were nonsignificant (fiO.05).
The treatment X year interaction was nonsignificant for calf birth date and all body weights (Table 5). Date of birth (an indicator of breeding date) was nonsignificant (-0.05) for all contrasts and years. The year effect was significant (f&.05) for each body weight;
but the largest difference between years at weaning was 5 kg. Calf birth weights were greater (P<o.Ol) for calves from cows fed winter hay than for calves from cows that grazed meadow or range during the winter (42.7 kg vs 41.4 kg). Calves that grazed meadow in May were heavier (P&01) at prebreeding (95.7 kg vs 90.2 kg) and wean- ing (237 kg vs 232 kg) than calves on the May hay treatment. Calves from cows that grazed range during winter were lighter at prebreed-
262
one-hundred pound (cwt) increments (Wellman 1991). Weaning weights for winter-hay, May-meadow system were skewed slightly left, while weaning weights for calves in winter-meadow, May- meadow system were skewed slightly right. The distribution differ- ences and price steps were sufficient to increase gross returns for winter-meadow, May-meadow treatment over gross returns for win- ter-hay, May-meadow system.
Regression lines illustrating the cumulative set of partial budgeting returns are shown in Figure 1. The cumulative distributions in Figure 1 show the percent of the 1,000 price scenarios which resulted in a given level of net returns for the given output price. For example, for the given output price, 60% of the price scenarios resulted in net returns of between $353 and $397 per calf for winter-hay, May-hay and net returns of between $445 and $458 per calf for winter-mead- ow, May-meadow. Cows on winter-hay, May-hay exhibited the low- est returns for all price scenarios while cows on winter-meadow, May-meadow exhibited the highest returns. Winter-range, May- meadow was second best choice. Winter-meadow, May-hay domi- nated the remaining systems for all price scenarios and winter-range, May-hay dominated winter-hay, May-meadow over approximately 70% of the price scenarios.
In terms of efficiency, winter-meadow, May-meadow has first degree stochastic dominance over all other systems because its cumulative distribution of net returns always had higher values rela- tive to all other systems. Decision makers preferring winter-meadow.
May-meadow have a strict preference of more returns to less returns.
Likewise, the winter-range, May-meadow had FSD over all systems
JOURNAL OF RANGE MANAGEMENT 47(4) July 1994
Table 6. Partial budgeting return and cost ranges Per calf by forage system.
Treatments
Item
Average gross return per calf (S) 8% meadow hay ($) (110% NRC) 32% supplement ($) Land charge ($) Feed machinery ($) Labor (S)
Return to other factors of productionlcalf ($)
Average return to other factors of production ($)
Winter Range
May Hay May Meadow
484 496
11.4-25.1 0.0
17.2 - 23.2 17.2 - 23.2 18.2 - 29.5 25.3 - 41.1
1.76 1.06
1.38 0.88
403 - 434 430 - 452
419 442
Winter Hay
May Hay May Meadow
488 500
57.7 - 126.6 46.3 - 101.6
00 00
00 7.1 - 11.6
4.23 3.53
2.91 2.41
356 - 424 382 - 441
390 412
Winter Meadow
May Hay May Meadow
493 506
11.4-25.1 0.0
6.0 - 8.1 6.0 - 8.1 27.5 - 42.1 34.6 - 53.7
1.03 0.33
0.79 0.29
416-447 443-464
432 455
except the winter-meadow, May-meadow; and winter-meadow, May- hay had FSD over winter-range, May-hay; winter-hay, May-hay; and winter-hay, May-meadow. Because winter-range, May-hay did not exceed winter-hay, May-meadow at all possible outcomes, winter- range, May-hay did not have FSD over winter-hay, May-meadow.
However. as the number of outcomes increase, the accumulated area underneath the graph of winter-range, May-hay will always be less than winter-hay, May-meadow; therefore, winter-range, May-hay treatment did exhibit second degree stochastic dominance (SSD) over winter-hay, May-meadow. Decision makers preferring winter-range, May-hay over winter-hay, May-meadow system are risk averse in that winter-range, May-hay will have a greater probability of higher net returns than winter-hay, May-meadow.
research efforts need to be devoted to analyzing the question of how the resource base could impact the forage treatment selection and in particular what the trade-offs are when grazing is substituted for hay- ing on subirrigated meadows.
Literature Cited
Barkema, AD. and M. Drabenstott. 1990. A crossroads for the cattle indus- try. Econ. Rev. Federal Reserve Bank of Kansas City. Nov/Dec. 47-66.
Clark, R.T. and S.A. Coady. 1992. Ranch management practices in the Sandhills of Nebraska: managing the ranch business. Agr. Res. Division, Inst. Ag. and Natur. Resources, Univ. Nebraska-Lincoln, Res. Bull. RB- 316.
The slopes of the regression lines imply that the different treat- ments have different risk characteristics. Systems with steeper regres- sion lines have less variation in net returns than systems with regres- sion lines having lower slopes. Winter-hay, May-hay and winter-hay, May-meadow systems exhibited the most variability, while the 4 sys- tems without winter-hay exhibited the least variability. The variabili- ty in returns is due principally to the fact that feed costs for systems with winter-hay arc heavily dependent on hay price while feed costs for the other systems relied principally on supplement and land rental rates. Net returns for treatment with winter-hay were, therefore, based primarily on the 10 hay prices while net returns for those with- out winter-hay were based primarily on the 100 supplement-land rental rate price scenarios. The relative risk differences between sys- tems with winter-hay and those without winter-hay are therefore due to the diversity in input types and their price variations.
Coady, S.A. and R.T. Clark. 1993. Ranch management practices in the Sandhills of Nebraska: managing production. Agr. Res. Division, Inst. Ag.
and Natur. Resources, Univ. Nebraska-Lincoln, Res. Bull. RB-318.
Cox, D.R 1970. Analysis of binary data. Chapman and Hall, London.
Deutscher, G.H., J.A. Stotts, and M.K. Nielsen. 1991. Effects of breeding season length and calving season on range beef cow productivity. J. Anim.
Sci. 69:3453-3460.
D’Souza, G.E., E.W. Marshall, W.B. Bryan, and E.C. Prigge. 1990.
Economics of extended grazing systems. Amer. J. Alternative Ag. 5: 120- 125.
Johnson, B.B. and T. Schroeder. 1990. Nebraska farm real estate market developments 1989-1990. Dep. Agr. Econ., Ag. Res. Division, Inst. Agr.
and Natur. Resources, The Univ. Nebraska-Lincoln. Rep. No. 162.
Icing, R.P., and L. J. Robison. 1984. Risk efficiency models. p.68-81. In:
Peter J. Barry (ed.), Risk management in agriculture. The Iowa State Univ.
Press. Ames, Iowa.
Economic Implications
Regardless of the winter treatment, grazing meadows in May while upland range is dormant improved economic returns to the cow/calf enterprise. In addition, returns were further improved by having the cow harvest the winter feed by either grazing subirrigated meadows or native range during the winter. The results illustrate that for a ranching operation with adequate meadow and winter range resources, the best forage management strategy involved grazing subirrigated meadows over winter and grazing meadows again in May. However, most ranches face a resource constraint in terms of the availability of subirrigated meadows or winter range. Future
Nebraska Agricultural Statistics. Various issues 1982-1991. Nebraska Dep.
of Ag., Division Agr. Statistics. Lincoln, Neb.
NRC. 1984. Nutrient Requirements of Beef Cattle, sixth edition. National Research Council, National Academy Press, Washington, D.C.
Rasby, R, M. Frazier, G. Deutscher, I. Rush, T. Mader, J. Gosey, and D.
Hudson. 1989. Integrated resource managment. p.l-9. In: 1990 Beef Cattleman Roundup. Nebraska Cooperative Extension. Univ. Nebraska- Lincoln, Inst. Agr. and Natur. Resources, WCC 90-l. Lincoln, Neb.
Bicbards, M.W., J.C. Spitzer, and M.B. Warner. 1986. Effect of.varying levels of postpartum nutrition and body condition at calving on subsequent reproductive performance in beef cattle. J. Anim. Sci. 62:300-306.
Wellman, A.C. 1991. Crop and Livestock Prices for Nebraska Producers.
Nebraska Cooperative Ext. Serv. Univ. Nebraska-Lincoln, Inst. Agr. and Natur. Resources. EC91-883, Lincoln, Neb.
JOURNAL OF RANGE MANAGEMENT 47(4) July 1994 263
J Range Manage 47: 264-269, July 1994
Government policy effects on cattle and wildlife ranching profits in Zimbabwe
URS P. KREUTER AND JOHN P.WORKMAN
Authors are research associate, Department of Rangeland Ecology and Management, Texas A&M University, College Station, 77843-2126; and professor, Department of Range Science, Utah State University, Logan, 84322-5230. The research was conducted under the ausoices of the WWF Multispecies Animal Production Systems Project in Harare,
Abstract
The profitabiity of alternative range-based production systems is fkequently affected by government policies. Moreover, the com- parative profitability of wild and domestic animal praductiop sys- tems on African semi-arid savannas bas not been well analyzed.
Tbii paper presents a simple method for analyzing government policy effects on ranch profits and reports application of the method to 30 commercial cattle, 7 wildlife, and 13 mixed ranches in Zimbabwe. Ranches were selected in 4 contiguous woodland savanna areas with abundant wildlife and in 2 adjacent open savanna areas with sparse wildlife. Financial profits were calculat- ed from 1989/90 ranch data and economic profits were estimated from the opportunity costs of inputs and outputs. A policy analysis matrix was used to estimate financial-economic profit differences.
Cattle ranches iu tbe 2 areas with sparse wildlife were the most profitable group studied. Profits were lower (but similar) for cat- tle and mixed ranches iu the areas with abundant wildlife. The financial profit was higher than economic profit for all ranch types, thus creating production disincentives. However, currency over-valuation and implicit taxes on exported beef created greater production disincentives for cattle than wildlife producers. Wbii the policy interventions negated the government’s stated objet- tives of increasing foreign currency earnings and being self suffi- cient in beef production, they did appear to have beneficial range management consequences by encouraging fewer cattle on bistori- tally overstocked cattle ranches.
Key Words: Economic profit, financial profit, production incentives, raageland allocation, semi-arid savannas.
Governments regularly intervene in economies as they attempt to achieve particular policy goals. One sector in which almost all gov- ernments intervene is agriculture where they try to alter income dis- tributions, stabilize prices, promote food self-sufftciency, or protect their own agriculturalists from world market forces. But these inter- ventions may fail to achieve their goals and can produce unintended
Funding for the research wes provided by the World Wide Fund for Nature (Switzerland), Rothmans of Pall Mall (Zimbabwe). and the Political Economic Research Center (Montana). The authors are grateful for their
consequences, one reason being that market prices influenced by pol- icy interventions may not accurately reflect resource scarcity and may thus encourage economically inefficient resource use (Monke and Pearson 1989).
Given the widespread dependence of Africans on semi-arid savanna resources for their livelihood, efficient and sustainable use of such mngelands is critical for human welfare. Yet, these ecosystems are being increasingly degraded under traditional agricultural practices and increasing human population pressure Due to their relatively low production potential, economic analyses of the use of such rangelands have, however, been rare and little attention has been paid to government policy effects on land-use patterns. This deficiency will not promote future human welfare.
Semi-arid African savannas provide a heterogeneous forage base which multi-species herbivore communities defoliate more uniformly than cattle alone (Walker 1979; Taylor and Walker 1978). It has thus been argued that game ranching should be more profitable than beef ranching in such areas (Dasmann and Mossman 1961; Clarke et al.
1985; Hopcraft 1986; Child 1988) and that game ranching may be ecologically the most sustainable form of land-use (Child and Child 1986).
Such claims have, however, been based on incomplete economic analyses, virtually none of which have accounted for government policy effects on protitability. Yet simple analytical tools, such as the Policy Analysis Matrix (PAM)(Monke and Pearson 1989). have been used to identify policy-based profit distortions in agronomic produc- tion systems. Such distortions tend to promote economically ineff- cient resource allocation for production because producers tend to oversupply commodities whose profits are inflated by policy inter- ventions and undersupply those with suppressed profits (Masters 1989).
This paper presents the financial profits of cattle and wildlife ranch- ing in Zimbabwe, and it describes the use of the PAM methodology to analyze the effects of government policy on the economic efficien- cy of these ranches. Since it has a long history of cattle ranching and legislation allowing landowners to commercially use wildlife on their property, Zimbabwe provided an ideal venue for a comparative eco- nomic study of semi-arid range use in Africa. Data were collected from commercial ranches in the Midlands Province, which contains the country’s most productive semi-arid savannas. Less than 2% of the Midlands is arable but 78% is grazeable (Roth 1990) making it suitable primarily for extensive animal production (Vincent and Thomas 1960).
JOURNAL OF RANGE MANAGEMENT 47(4) July 1994