Randomized Significance Tests in Machine Translation
Yvette Graham Nitika Mathur Timothy Baldwin
Department of Computing and Information Systems The University of Melbourne
[email protected], [email protected], [email protected]
Abstract
Randomized methods of significance test-ing enable estimation of the probability that an increase in score has occurred sim-ply by chance. In this paper, we examine the accuracy of three randomized meth-ods of significance testing in the context of machine translation: paired bootstrap resampling, bootstrap resampling and ap-proximate randomization. We carry out a large-scale human evaluation of shared task systems for two language pairs to provide a gold standard for tests. Re-sults show very little difference in accu-racy across the three methods of signif-icance testing. Notably, accuracy of all test/metric combinations for evaluation of English-to-Spanish are so low that there is not enough evidence to conclude they are any better than a random coin toss.
1 Introduction
Automatic metrics, such as BLEU (Papineni et al., 2002), are widely used in machine translation (MT) as a substitute for human evaluation. Such metrics commonly take the form of an automatic comparison of MT output text with one or more human reference translations. Small differences in automatic metric scores can be difficult to inter-pret, however, and statistical significance testing provides a way of estimating the likelihood that a score difference has occurred simply by chance. For several metrics, such as BLEU, standard sig-nificance tests cannot be applied due to scores not comprising the mean of individual sentence scores, justifying the use of randomized methods. Bootstrap resampling was one of the early ran-domized methods proposed for statistical signifi-cance testing of MT (Germann, 2003; Och, 2003; Kumar and Byrne, 2004; Koehn, 2004), to assess
for a pair of systems how likely a difference in BLEU scores occurred by chance. Empirical tests detailed in Koehn (2004) show that even for test sets as small as 300 translations, BLEUconfidence intervals can be computed as accurately as if they had been computed on a test set 100 times as large. Approximate randomization was subsequently proposed as an alternate to bootstrap resam-pling (Riezler and Maxwell, 2005). Theoretically speaking, approximate randomization has an ad-vantage over bootstrap resampling, in that it does not make the assumption that samples are repre-sentative of the populations from which they are drawn. Both methods require some adaptation in order to be used for the purpose of MT evalua-tion, such as combination with an automatic met-ric, and therefore it cannot be taken for granted that approximate randomization will be more ac-curate in practice. Within MT, approximate ran-domization for the purpose of statistical testing is also less common.
Riezler and Maxwell (2005) provide a compar-ison of approximate randomization with bootstrap resampling (distinct frompairedbootstrap resam-pling), and conclude that since approximate ran-domization produces higherp-values for a set of apparently equally-performing systems, it more conservatively concludes statistically significant differences, and recommend preference of approx-imate randomization over bootstrap resampling for MT evaluation. Conclusions drawn from ex-periments provided in Riezler and Maxwell (2005) are oft-cited, with experiments interpreted as ev-idence that bootstrap resampling is overly opti-mistic in reporting significant differences (Riezler and Maxwell, 2006; Koehn and Monz, 2006; Gal-ley and Manning, 2008; Green et al., 2010; Monz, 2011; Clark et al., 2011).
Our contribution in this paper is to revisit sta-tistical significance tests in MT — namely, boot-strap resampling, paired bootboot-strap resampling and
approximate randomization — and find problems with the published formulations. We redress these issues, and apply the tests in statistical testing of two language pairs. Using human judgments of translation quality, we find only very minor differ-ences in significance levels across the three tests, challenging claims made in the literature about rel-ative merits of tests.
2 Revisiting Statistical Significance Tests for MT Evaluation
First, we revisit the formulations of bootstrap resampling and approximate randomization al-gorithms as presented in Riezler and Maxwell (2005). At first glance, both methods appear to be two-tailed tests, with the null hypothesis that the two systems perform equally well. To facili-tate a two-tailed test, absolute values of pseudo-statistics are computed before locating the abso-lute value of the actual statistic (original differ-ence in scores). Using absolute values of pseudo-statistics is not problematic in the approximate randomization algorithm, and results in a reason-able two-tailed significance test. However, the bootstrap algorithm they provide uses an addi-tional shift-to-zero method of simulating the null hypothesis. The way in which this shift-to-zero and absolute values of pseudo-statistics are ap-plied is non-standard. Combining shift-to-zero and absolute values of pseudo-statistics results in all pseudo-statistics that fall below the mean pseudo-statistic to be omitted from computation of counts later used to compute p-values. The ver-sion of the bootstrap algorithm, as provided in the pseudo-code, is effectively a one-tailed test, and since this does not happen in the approximate ran-domization algorithm, experiments appear to com-pare p-values from a one-tailed bootstrap test di-rectly with those of a two-tailed approximate ran-domization test. This inconsistency is not recog-nized, however, and p-values are compared as if both tests are two-tailed.
A better comparison ofp-values would first re-quire doubling the values of the one-sided boot-strap, leaving those of the two-sided approximate randomization algorithm as-is. The results of the two tests on this basis are extremely close, and in fact, in two out of the five comparisons, those of the bootstrap would have marginallyhigherp -values than those of approximate randomization. As such, it is conceivable to conclude that the
ex-periments actually show no substantial difference in Type I error between the two tests, which is con-sistent with results published in other fields of re-search (Smucker et al., 2007). We also note that the pseudo-code contains an unconventional com-putation of mean pseudo-statistics, τB, for
shift-to-zero.
Rather than speculate over whether these is-sues with the original paper were simply presen-tational glitches or the actual basis of the experi-ments reported on in the paper, we present a nor-malized version of the two-sided bootstrap algo-rithm in Figure 1, and report on the results of our own experiments in Section 4. We compare this method with approximate randomization and also
pairedbootstrap resampling (Koehn, 2004), which
is widely used in MT evaluation. We carry out evaluation over a range of MT systems, not only including pairs of systems that perform equally well, but also pairs of systems for which one system performs marginally better than the other. This enables evaluation of not only Type I error, but the overall accuracy of the tests. We carry out a large-scale human evaluation of all WMT 2012 shared task participating systems for two language pairs, and collect sufficient human judgments to facilitate statistical significance tests. This hu-man evaluation data then provides a gold-standard against which to compare randomized tests. Since all randomized tests only function in combina-tion with an automatic MT evaluacombina-tion metric, we present results of each randomized test across four different MT metrics.
3 Randomized Significance Tests
3.1 Bootstrap Resampling
Bootstrap resampling provides a way of estimat-ing the population distribution by samplestimat-ing with replacement from a representative sample (Efron and Tibshirani, 1993). The test statistic is taken as the difference in scores of the two systems,
SX−SY, which has an expected value of0under
the null hypothesis that the two systems perform equally well. A bootstrap pseudo-sample consists of the translations by the two systems(Xb, Yb)of
a bootstrapped test set (Koehn, 2004), constructed by sampling with replacement from the original test set translations. The bootstrap distribution
Sboot of the test statistic is estimated by
calculat-ing the value of the pseudo-statisticSXb−SYbfor
Setc= 0
Compute actual statistic of score differencesSX−SY
on test data
Calculate sample meanτB= B1 B
P
b=1SXb−SYbover bootstrap samplesb= 1, ..., B
For bootstrap samplesb= 1, ..., B
Sample with replacement from variable tuples test sentences for systemsXandY
Compute pseudo-statisticSXb−SYbon bootstrap data
If|SXb−SYb−τB| ≥ |SX−SY|
c=c+ 1 Ifc/B≤α
[image:3.595.309.525.75.263.2]Reject the null hypothesis
Figure 1: Two-sided bootstrap resampling statisti-cal significance test for automatic MT evaluation
Setc= 0
Compute actual statistic of score differencesSX−SY
on test data
For random shufflesr= 1, ..., R
For sentences in test set
Shuffle variable tuples between systemsXandY
with probability 0.5
Compute pseudo-statisticSXr−SYron shuffled data
IfSXr−SYr ≥SX−SY
c=c+ 1 Ifc/R≤α
Reject the null hypothesis
Figure 2: Approximate randomization statistical significance test for automatic MT evaluation
The null hypothesis distributionSH0 can be
es-timated from Sboot by applying the shift method
(Noreen, 1989), which assumes thatSH0 has the
same shape but a different mean thanSboot. Thus,
Sboot is transformed into SH0 by subtracting the
mean bootstrap statistic from every value inSboot.
Once this shift-to-zero has taken place, the null hypothesis is rejected if the probability of observ-ing a more extreme value than the actual statistic is lower than a predeterminedp-valueα, which is typically set to0.05. In other words, the score dif-ference is significant at level1−α.
Figure 3 provides a one-sided implementation of bootstrap resampling, whereH0is that the score
of SystemX is less than or equal to the score of
Setc= 0
Compute actual statistic of score differencesSX−SY
on test data
Calculate sample meanτB= B1 B
P
b=1SXb−SYbover bootstrap samplesb= 1, ..., B
For bootstrap samplesb= 1, ..., B
Sample with replacement from variable tuples test sentences for systemsXandY
Compute pseudo-statisticSXb−SYbon bootstrap data
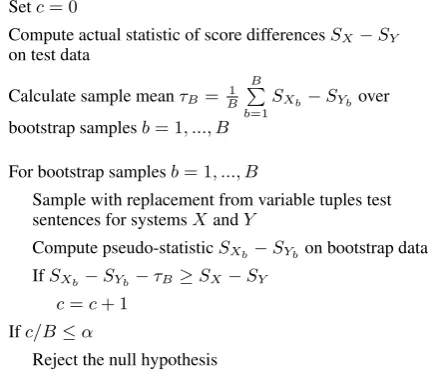
IfSXb−SYb−τB≥SX−SY
c=c+ 1 Ifc/B≤α
Reject the null hypothesis
Figure 3: One-sided Bootstrap resampling statisti-cal significance test for automatic MT evaluation
Setc= 0
For bootstrap samplesb= 1, ..., B
IfSXb < SYb
c=c+ 1 Ifc/B≤α
[image:3.595.73.292.76.263.2]Reject the null hypothesis
Figure 4: Paired bootstrap resampling randomized significance test
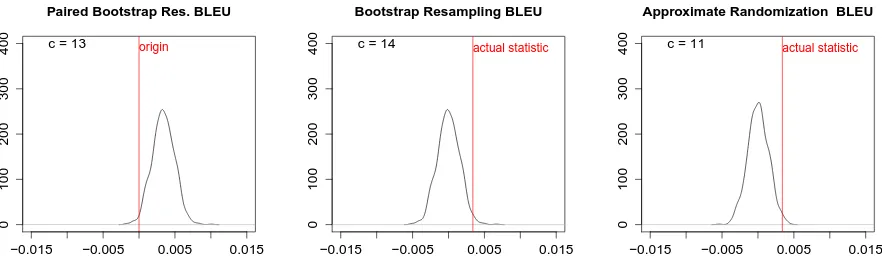
SystemY. Figure 5 includes a typical example of bootstrap resampling applied to BLEU, for a pair of systems for which differences in scores are sig-nificant, while Figure 6 shows the same for ME -TEORbut for a pair of systems with no significant difference in scores.
3.2 Approximate Randomization
Unlike bootstrap, approximate randomization does not make any assumptions about the popula-tion distribupopula-tion. To simulate a distribupopula-tion for the null hypothesis that the scores of the two systems are the same, translations are shuffled between the two systems so that 50% of each pseudo-sample is drawn from each system. In the context of ma-chine translation, this can be interpreted as each translation being equally likely to have been pro-duced by one system as the other (Riezler and Maxwell, 2005).
[image:3.595.73.290.324.490.2]−0.015 −0.005 0.005 0.015
0
100
200
300
400
Paired Bootstrap Res. BLEU
origin
c = 13
−0.015 −0.005 0.005 0.015
0
100
200
300
400
Bootstrap Resampling BLEU
actual statistic
c = 14
−0.015 −0.005 0.005 0.015
0
100
200
300
400
Approximate Randomization BLEU
actual statistic
[image:4.595.86.527.71.207.2]c = 11
Figure 5: Pseudo-statistic distributions for a typical pair of systems with close BLEU scores for each randomized test (System F vs. System G).
−0.015 −0.005 0.005 0.015
0
100
200
300
400
Paired Bootstrap Res. METEOR
origin
c = 269
−0.015 −0.005 0.005 0.015
0
100
200
300
400
Bootstrap Resampling METEOR
actual statistic
c = 275
−0.015 −0.005 0.005 0.015
0
100
200
300
400
Approximate Randomization METEOR
actual statistic
[image:4.595.87.527.282.423.2]c = 260
Figure 6: Pseudo-statistic distributions of METEOR with randomized tests (System D vs. System A).
a total ofSsentences, then a total of2Sshuffles is
possible. IfSis large, instead of generating all2S
possible combinations, we instead generate sam-ples by randomly permuting translations between the two systems with equal probability. The distri-bution of the test statistic under the null hypoth-esis is approximated by calculating the pseudo-statistic,SXr −SYr, for each sample. As before,
the null hypothesis is rejected if the probability of observing a more extreme value than the actual test statistic is lower thanα.
Figure 2 provides a one-sided implementation of approximate randomization for MT evaluation, where the null hypothesis is that the score of Sys-temXis less than or equal to the score of System
Y. Figure 5 shows a typical example of pseudo-statistic distributions for approximate randomiza-tion for a pair of systems with a small but signifi-cant score difference according to BLEU, and Fig-ure 6 shows the same for METEOR applied to a
pair of systems where no significant difference is concluded.
3.3 Paired Bootstrap Resampling
Paired bootstrap resampling (Koehn, 2004) is shown in Figure 4. Unlike the other two random-ized tests, this method makes no attempt to simu-late the null hypothesis distribution. Instead, boot-strap samples are used to estimate confidence in-tervals of score differences, with confidence inter-vals not containing 0 implying a statistically sig-nificant difference.
We compare what takes place with the two other tests, by plotting differences in scores for boot-strapped samples, SXb − SYb, as shown in
Adequacy Fluency Combined
p-value System.A System.B System.C System.D System.E System.F System.G System.H System.J System.K System.L System.M System.A System.B System.C System.D System.E System.F System.G System.H System.J System.K System.L System.M System.A System.B System.C System.D System.E System.F System.G System.H System.J System.K System.L System.M
[image:5.595.80.507.63.220.2]System.M System.L System.K System.J System.H System.G System.F System.E System.D System.C System.B System.A
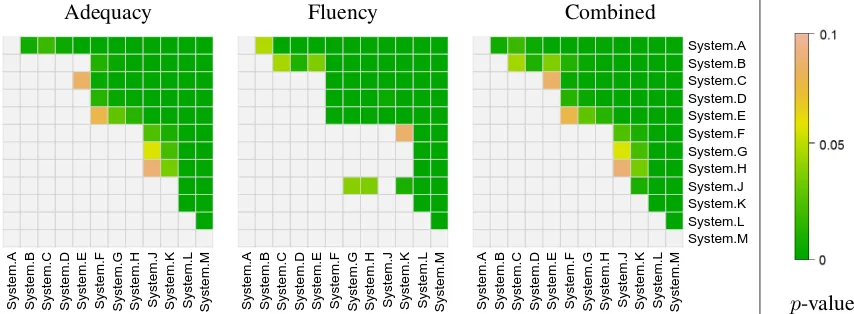
Figure 7: Human evaluation pairwise significance tests for Spanish-to-English systems (colored cells denote scores for Systemrow being significantly greater than Systemcolumn.
4 Evaluation
In order to evaluate the accuracy of the three ran-domized significance significance tests, we com-pare conclusions reached in a human evaluation of shared task participant systems. We carry out a large-scale human evaluation of all participating systems from WMT 2012 (Callison-Burch et al., 2012) for the Spanish-to-English and English-to-Spanish translation tasks. Large numbers of hu-man assessments of translations were collected us-ing Amazon’s Mechanical Turk, with strict qual-ity control filtering (Graham et al., 2013). A to-tal of 82,100 human adequacy assessments and 62,400 human fluency assessments were collected. After the removal of quality control items and filtering of judgments from low-quality workers, this resulted in an average of 1,280 adequacy and 1,013 fluency assessments per system for Spanish-to-English (12 systems), and 1,483 adequacy and 1,534 fluency assessments per system for English-to-Spanish (11 systems). To remove bias with re-spect to individual human judge preference scor-ing severity/leniency, scores provided by each hu-man assessor were standardized according to the mean and standard deviation of all scores provided by that individual.
Significance tests were carried out over the scores for each pair of systems separately for adequacy and fluency assessments using the Wilcoxon rank-sum test. Figure 7 shows pairwise significance test results for fluency, adequacy and the combination of the two tests, for all pairs of Spanish-to-English systems. Combined fluency and adequacy significance test results are con-structed as follows: if a system’s adequacy score is
significantly greater than that of another, the com-bined conclusion is that it is significantly better, at that significance level. Only when a tie in ad-equacy scores occurs are fluency judgments used to break the tie. In this case,p-values from signifi-cance tests applied to fluency scores of that system pair are used. For example, in Figure 7, adequacy scores of System B are not significantly greater than those of Systems C, D and E, while fluency scores for System B are significantly greater than those of the three other systems. The combined re-sult for each pair of systems is therefore taken as thep-value from the corresponding fluency signif-icance test.
We use the combined human evaluation pair-wise significant tests as a gold standard against which to evaluate the randomized methods of sta-tistical significance testing. We evaluate paired bootstrap resampling (Koehn, 2004) and bootstrap resampling as shown in Figure 3 and approxi-mate randomization as shown in Figure 2, each in combination with four automatic MT metrics: BLEU(Papineni et al., 2002), NIST(NIST, 2002), METEOR (Banerjee and Lavie, 2005) and TER (Snover et al., 2006).
4.1 Results and Discussion
Figure 8 shows the outcome of pairwise random-ized significance tests for each metric for Spanish-to-English systems, and Table 1 shows numbers of correct conclusions and accuracy of each test.
Paired Bootst. Resamp. Bootst. Resamp. Approx. Rand.
α Conc. Acc.(%) Conc. Acc. (%) Conc. Acc. (%)
0.05
BLEU 53 80.3 [68.7,89.1] 53 80.3 [68.7,89.1] 53 80.3 [68.7,89.1] NIST 54 81.8 [70.4,90.2] 54 81.8 [70.4,90.2] 54 81.8 [70.4,90.2] METEOR 52 78.8 [67.0,87.9] 52 78.8 [67.0,87.9] 52 78.8 [67.0,87.9] TER 52 78.8 [67.0,87.9] 52 78.8 [67.0,87.9] 52 78.8 [67.0,87.9]
0.01
BLEU 51 77.3 [65.3,86.7] 51 77.3 [65.3,86.7] 51 77.3 [65.3,86.7] NIST 51 77.3 [65.3,86.7] 51 77.3 [65.3,86.7] 51 77.3 [65.3,86.7] METEOR 53 80.3 [68.7,89.1] 53 80.3 [68.7,89.1] 53 80.3 [68.7,89.1] TER 51 77.3 [65.3,86.7] 51 77.3 [65.3,86.7] 51 77.3 [65.3,86.7]
0.001
[image:6.595.83.512.64.297.2]BLEU 48 72.7 [60.4,83.0] 48 72.7 [60.4,83.0] 48 72.7 [60.4,83.0] NIST 48 72.7 [60.4,83.0] 48 72.7 [60.4,83.0] 48 72.7 [60.4,83.0] METEOR 53 80.3 [68.7,89.1] 53 80.3 [68.7,89.1] 52 78.8 [67.0,87.9] TER 50 75.8 [63.6,85.5] 51 77.3 [65.3,86.7] 52 78.8 [67.0,87.9]
Table 1: Accuracy of randomized significance tests for Spanish-to-English MT with four automatic metrics, based on the WMT 2012 participant systems.
Paired Bootst. Resamp. Bootst. Resamp. Approx. Rand.
α Conc. Acc.(%) Conc. Acc. (%) Conc. Acc. (%)
0.05
BLEU 34 61.8 [47.7,74.6] 34 61.8 [47.7,74.6] 34 61.8 [47.7,74.6] NIST 32 58.2 [44.1,71.3] 32 58.2 [44.1,71.3] 32 58.2 [44.1,71.3] METEOR 31 56.4 [42.3,69.7] 31 56.4 [42.3,69.7] 31 56.4 [42.3,69.7] TER 32 58.2 [44.1,71.3] 32 58.2 [44.1,71.3] 32 58.2 [44.1,71.3]
0.01
BLEU 33 60.0 [45.9,73.0] 33 60.0 [45.9,73.0] 33 60.0 [45.9,73.0] NIST 32 58.2 [44.1,71.3] 32 58.2 [44.1,71.3] 32 58.2 [44.1,71.3] METEOR 31 56.4 [42.3,69.7] 32 58.2 [44.1,71.3] 32 58.2 [44.1,71.3] TER 30 54.5 [40.6,68.0] 30 54.5 [40.6,68.0] 30 54.5 [40.6,68.0]
0.001
BLEU 33 60.0 [45.9,73.0] 33 60.0 [45.9,73.0] 33 60.0 [45.9,73.0] NIST 33 60.0 [45.9,73.0] 32 58.2 [44.1,71.3] 32 58.2 [44.1,71.3] METEOR 32 58.2 [44.1,71.3] 32 58.2 [44.1,71.3] 32 58.2 [44.1,71.3] TER 30 54.5 [40.6,68.0] 30 54.5 [40.6,68.0] 31 56.4 [42.3,69.7]
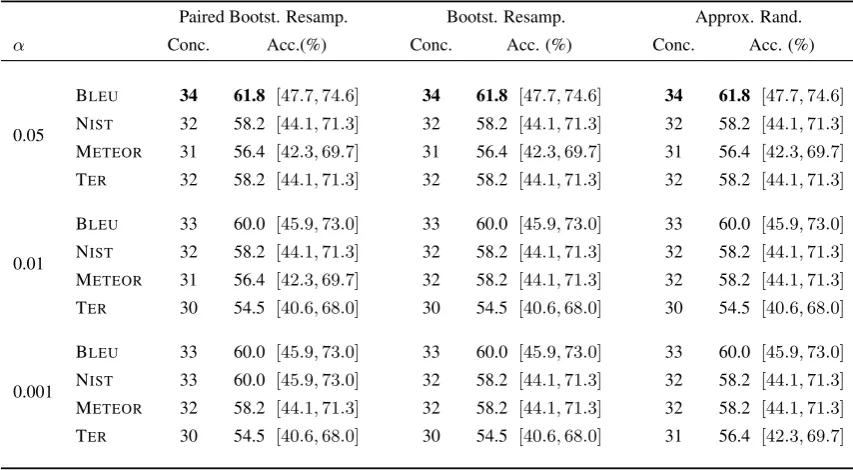
Table 2: Accuracy of randomized significance tests for English-to-Spanish MT with four automatic metrics, based on the WMT 2012 participant systems.
all three randomized methods produce p-values so similar that whenα thresholds are applied, all three tests produce precisely the same set of pair-wise conclusions for each metric. When tests are combined with METEOR and TER, similar results are observed: at theαthresholds of 0.05 and 0.01, precisely the same conclusions are drawn for both metrics combined with each of the three tests, and at most a difference of two conclusions at the
low-estαlevel.
[image:6.595.83.510.348.583.2]M
E
T
E
O
R
T
E
R
N
IS
T
B
L
E
U
Paired Bootstrap Bootstrap Approximate
Resampling Resampling Randomization
System.M System.L System.K System.J System.H System.G System.F System.E System.D System.C System.B System.A
System.M System.L System.K System.J System.H System.G System.F System.E System.D System.C System.B System.A
System.M System.L System.K System.J System.H System.G System.F System.E System.D System.C System.B System.A
System.A System.B System.C System.D System.E System.F System.G System.H System.J System.K System.L System.M System.A System.B System.C System.D System.E System.F System.G System.H System.J System.K System.L System.M System.A System.B System.C System.D System.E System.F System.G System.H System.J System.K System.L System.M
[image:7.595.77.528.63.624.2]System.M System.L System.K System.J System.H System.G System.F System.E System.D System.C System.B System.A
Figure 8: Automatic metric pairwise randomized significance test results for Spanish-to-English systems (colored cells denote scores for Systemrow significantly greater than Systemcolumn).
Finally, we examine which combination of met-ric and test is most accurate for each language pair at the conventional significance level ofp < 0.05. For Spanish-to-English evaluation, NIST combined with any of the three randomized tests
are not significant (Chi-square test).
For English-to-Spanish evaluation, an accuracy as low as 62% should be a concern. This level of accuracy for significance testing – only making the correct conclusion in 6 out of 10 tests – acts as a reminder that no matter how sophisticated the significance test, it will never make up for flaws in an underlying metric. When we take into account the fact that lower confidence limits all fall below 50%, significance tests based on these metrics for English-to-Spanish are effectively no better than a random coin toss.
5 Conclusions
We provided a comparison of bootstrap resam-pling and approximate randomization significance tests for a range of automatic machine trans-lation evaluation metrics. To provide a gold-standard against which to evaluate randomized tests, we carried out a large-scale human evalua-tion of all shared task participating systems for the Spanish-to-English and English-to-Spanish trans-lation tasks from WMT 2012. Results showed for many metrics and significance levels that all three tests produce precisely the same set of conclu-sions, and when conclusions do differ, it is com-monly only by a single contrasting conclusion, which is not significant. For English-to-Spanish MT, the results of the different MT evaluation met-ric/significance test combinations are not signifi-cantly higher than a random baseline.
Acknowledgements
We wish to thank the anonymous reviewers for their valuable comments. This research was supported by funding from the Australian Research Council.
References
S. Banerjee and A. Lavie. 2005. METEOR: An au-tomatic metric for mt evaluation with improved cor-relation with human judgements. InProc. Wkshp. Intrinsic and Extrinsic Evaluation Measures for Ma-chine Translation and/or Summarization, pages 65– 73, Ann Arbor, MI. ACL.
C. Callison-Burch, P. Koehn, C. Monz, M. Post, R. Soricut, and L. Specia. 2012. Findings of the 2012 Workshop on Statistical Machine Translation. InProc. 7th Wkshp. Statistical Machine Translation, pages 10–51, Montreal, Canada. ACL.
J. H. Clark, C. Dyer, A. Lavie, and N. A. Smith. 2011. Better hypothesis testing for statistical ma-chine translation: Controlling for optimizer
instabil-ity. InProc. of the 49th Annual Meeting of the As-soc. Computational Linguistics: Human Language Technologies: short papers-Volume 2, pages 176– 181, Portland, OR. ACL.
B. Efron and R. J. Tibshirani. 1993. An Introduction to the Bootstrap. Chapman & Hall, New York City, NY.
M. Galley and C. D. Manning. 2008. A simple and effective hierarchical phrase reordering model. In Proc. of the Conference on Empirical Methods in Natural Language Processing, pages 848–856, Ed-inburgh, Scotland. ACL.
U. Germann. 2003. Greedy decoding for statisti-cal machine translation in almost linear time. In Proc. of the 2003 Conference of the North American Chapter of the Assoc. Computational Linguistics on Human Language Technology-Volume 1, pages 1–8, Edmonton, Canada. ACL.
Y. Graham, T. Baldwin, A. Moffat, and J. Zobel. 2013. Continuous measurement scales in human evalua-tion of machine translaevalua-tion. In Proc. 7th Linguis-tic Annotation Wkshp. & Interoperability with Dis-course, pages 33–41, Sofia, Bulgaria. ACL.
S. Green, M. Galley, and C. D. Manning. 2010. Im-proved models of distortion cost for statistical ma-chine translation. In Human Language Technolo-gies: The 2010 Annual Conference of the North American Chapter of the Assoc. Computational Lin-guistics, pages 867–875, Los Angeles, CA. ACL. P. Koehn and C. Monz. 2006. Manual and automatic
evaluation of machine translation between European languages. InProceedings of the Workshop on Sta-tistical Machine Translation, pages 102–121, New York City, NY. ACL.
P. Koehn. 2004. Statistical significance tests for ma-chine translation evaluation. In Proc. of Empiri-cal Methods in Natural Language Processing, pages 388–395, Barcelona, Spain. ACL.
S. Kumar and W. J. Byrne. 2004. Minimum Bayes-risk decoding for statistical machine translation. In HLT-NAACL, pages 169–176, Boston, MA. ACL. C. Monz. 2011. Statistical machine translation with
lo-cal language models. InProc. of the Conference on Empirical Methods in Natural Language Process-ing, pages 869–879, Edniburgh, Scotland. ACL. NIST. 2002. Automatic Evaluation of Machine
Trans-lation Quality Using N-gram Co-Occurrence Statis-tics. Technical report.
E. W. Noreen. 1989. Computer intensive methods for testing hypotheses. Wiley, New York City, NY. F. J. Och. 2003. Minimum error rate training in
K. Papineni, S. Roukos, T. Ward, and W. J. Zhu. 2002. A method for automatic evaluation of ma-chine translation. InProc. 40th Ann. Meeting of the Assoc. Computational Linguistics, pages 311–318, Philadelphia, PA. ACL.
S. Riezler and J. T. Maxwell. 2005. On some pitfalls in automatic evaluation and significance testing for mt. InProc. of the ACL Workshop on Intrinsic and Extrinsic Evaluation Measures for Machine Trans-lation and/or Summarization, pages 57–64, Ann Ar-bor, MI. ACL.
S. Riezler and J. T. Maxwell. 2006. Grammatical machine translation. In Proc. of the Main Confer-ence on Human Language Technology ConferConfer-ence of the North American Chapter of the Assoc. Computa-tional Linguistics, pages 248–255, New York City, NY. ACL.
M. Smucker, J. Allan, and B. Carterette. 2007. A com-parison of statistical significance tests for informa-tion retrieval evaluainforma-tion. In Proc. of the Sixteenth ACM Conference on Information and Knowledge Management (CIKM 2007), pages 623–632, Lisbon, Portugal. ACM.