Incorporation of GIS Based Program into Hydraulic
Model for Water Level Modeling on River Basin
Ali Haghizadeh1, Lee Teang Shui2, Majid Mirzaei2, Hadi Memarian3 1
Department of Watershed & Range Management Engineering, Faculty of Agriculture, Lorestan University, Khorramabad, Iran
2
Water Resources Engineering, Faculty of Engineering, University Putra Malaysia (UPM), Serdang, Malaysia
3
Land Management, Faculty of Agriculture, University Putra Malaysia (UPM), Serdang, Malaysia Email: [email protected]
Received June 12, 2011; revised August 29, 2011; accepted November 5, 2011
ABSTRACT
Water resources management usually requires that hydraulic, ecological, and hydrological models be linked. The Hy- drologic Engineering Center River Analysis System (HEC-RAS) hydraulic model and the Hydrologic Engineering Center Geospatial River Analysis System (HEC-GEORAS), imitates flow and water profiles in the Neka river basin’s downstream flood plain. Hydrograph phases studied during the flood seasons of 1986-1999 and from 2002-2004 were used to calibrate and verify the hydraulic model respectively. Simulations of peak flood stages and hydrographs’ evaluations are congruent with studies and observations, with the former showing mean square errors between 4.8 - 10 cm. HECRAS calculations and forecast flood water levels. Nash-Sutcliffe effectiveness (CR3) is more than 0.92 along with elevated levels of water which were created with some effectiveness (CR5) of 0.94 for the validation period. The coupled two models show good performance in the water level modeling.
Keywords: HEC-RAS; HEC-GEORAS; Nash-Sutcliffe; Neka River; Water Level Modeling
1. Introduction
Researchers have grouped the ways of model integration. Morita [1] characterized coupling numerical models into full coupling (that is reformulation and solution of the governing equations completely), internal coupling (that is solutions for all models’ governing equations to be done individually and upgrading of the shared data using iteration), and external coupling (Running models sepa- rately and exchanging their results). Brandmeyer and Karimi [2] have given a synthesis of methodologies in order to couple the environmental models, that is one- way data transfer (models are dealt with separately, and the coupling is only such that one model’s output serves as the input for the other), loose coupling (interchanging data between models in form of a dynamic feedback while simulation takes place), shared coupling (a major part is shared by the models, either data storage or the graphical user interface (GUI)), joined coupling (the mo- dels are peers to each other and this enables users’ inter- action with the models with the help of a common GUI), and tool coupling (whereby coupling is done using a modeling framework with a single GUI and shared data storage). Various coupled simulation programs are in use these days, for instance, coupling of surface flow models and groundwater or coupling of water quantity models and
stitutes of 3 modules: Updating Procedure (FF), Hydro- dynamic (HD model), and Rainfall-Runoff (NAM Model) [7]. Flood inundation mapping and hydraulic modeling are useful for anticipating important details regarding a flood. These details involve elevations of the water sur- face at various points and the extent of inundation. Simu- lation of the channel flow is done using the St. Venant equations’ set in hydraulic modeling [8]. The model re- lies on momentum conservation and continuity, that is to say mass conservation. Both, implicit and explicit meth- ods are used for solving these equations [9]. The depth and velocity at a certain point are found using the given data for a river and in an explicit manner. HECRAS is used the world over and is a public domain software. Mike 11, however, is proprietary software which needs a registration key to be used. For two-sided models, the movement of water is possible in both, longitudinal and lateral directions. The velocity, on the other hand, can be neglected in the vertical direction. For two-sided models, the terrain is said to be a continuous surface through a finite element mesh, as opposed to the one-sided models. For a cell, all the output and input parameters, hydraulic or hydrological, are thought to be uniform. The mostly used 2D models that are used for flood plains and rivers are WMS, SOBEK, MIKE21, TELEMAC-2D, Delft FLS, and LISFLOOD-FP. Terrain’s continuous representation enables the 2D models to categorize the flow’s lateral interaction between floodplain and the main channel. One-sided models are mostly more efficient, however, there are some drawbacks associated with them. These involve inability of simulating the lateral diffusion of flood wave. The topographic representation is also in form of cross-sections, instead of the surface [10].
2. Methodology
2.1. Study Area
The Neka river basin and the area of 10 km after the ba- sin outlet in northern Iran is used for flood modelling by linking the HEC-GEORAS and HEC-RAS models. The upstream Neka catchment is 1892 km2 in length, and has a downstream flood plain which is 7.51 km2 long and is affected by the tide. However, the location boundary of the basin in the flood plane is not certain. There is hilly topography on the upstream catchment which is elevated from 39 m to 3814 m and has average basin slopes of ab- out 24.81%. The Isohyets method measures rainfall in the region to be 800 mm and this method counts it 817 mm, whereas, the region lies in a moderate north zone. The elevation range of the Neka river is –2.4 to 27 m and contains mostly land type’s use.
2.2. HEC-RAS Model
Designed by the US Army Corps of Engineers—Hydro-
logic Engineering Centre (HEC)[11], HEC-RAS is a hy-draulic model that is composed of three 1D hyhy-draulic examination modules designed for 1) steady flow water surface profiles, 2) Unsteady flow simulation, and 3) Se- diment transport, movable boundary computations. Ordi- nary geometric data modeling and geometric and hydrau- lic calculation sub-modules are implemented in all three of these models. Apart from these three models for hy- draulic research, the model also includes many hydraulic planning utilities that can be used after the fundamental water surface contours are programmed. Unsteady flow simulating in the model makes use of UNET flow model. This can deal with the full dynamic St. Venant equations in order to reproduce 1D flow through single branched or looped system of open channels. It also simulated break- downs in levees; impedance and other changes encoun- tered by the river while passing through dams, barrage, weir overflow structures, bridges and culverts and pum- ped diversions. Unsteady flow Simulated is derived from two equations: 1) the continuity equation that explains conservation of mass:
1 0
s Q
t x
Q
(1)
where ω (m2) is cross-sectional area, S (m3/m) is storage from non conveying portions of the cross section, Q (m3/s) is discharge, and Q1 (m2/s) is lateral inflow per unit distance. 2) The momentum equation, according to which the rate of change in momentum is equal to the follow-on force acting on the system.
0
QV
Q z
f
t x x
g S
(2)
where v (m/s] is velocity, g (m2/s] is acceleration of grav-ity, Sf (m/m) is friction slope and z is elevation of the
water surface (m). This model implements the Preissman technique in order to integrate the equations and a four- step inherent scheme to deal with the equations. The boundary conditions of upstream are needed at the up- stream region of all the catchments that are disconnected from other basins or reservoirs in the form of a current hydrograph of total flow against time. Similarly, the sta- tuses. The boundary conditions of downstream are needed at the downstream region of all the basins not in contact with other basins or reservoirs. There are four distinct kinds of The boundary conditions of downstream: stage hydrograph of water elevation against time, current hy-drograph, one-value rating curve and normal depth [11]. The HEC-RAS program makes use of the Hydraulic En- gineering Centre’s Data Storage System (HECDSS) dur- ing input/output series to aid in the modification of the model for dealing with larger than normal drainage pat- terns and other different conditions. HEC-RAS has made
1
n
formatted GIS data exchange file (*. sdf) is used to per- form the GIS data import and export between RAS and ArcView.
its mark in facilitating all the stages of river management development, mainly because of its capacity to handle several different kinds of real-life processes. USACE [11] contains a comprehensive report on the model and its
calculation methods. 2.4. Calibration of HEC-RAS Model
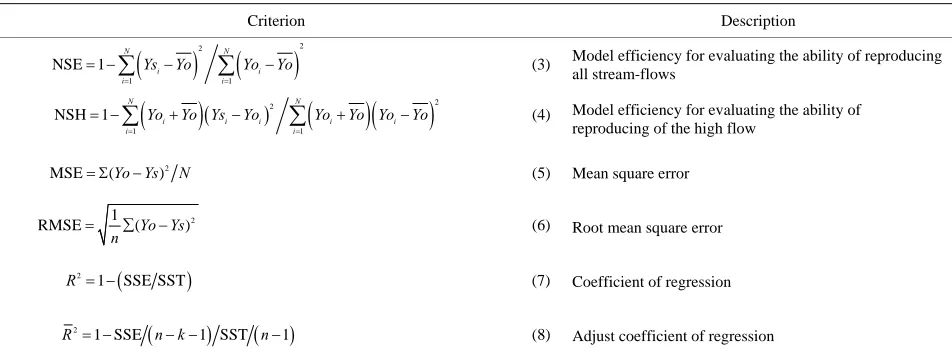
Calibration of HEC-RAS model for flood plane is per- formed using observed water level obtained of flow hy- drograph at Ablu station is river upstream, the flood sea- sons of 1986-1999 are used for calibration, while the flood seasons of 2002-2004 are used for validation. There are varieties of performance functions. The more using of performance functions for checking error the better ac- curacy are shown. Therefore, this study presented different methods for investigating model performance (Table 1), where is Yo observed water level, Ys simulated water level with linking HEC-RAS and HEC-GEORAS, N is total number of data SSE is sum square error SST is the sum square total
2.3. HEC-GeoRAS
HEC-GeoRas is an extension assortment of tools to be utilized in a GIS environment. It makes available an in- terface between ArcView and the HEC-RAS model. This extension is used along with 3D analysis for connecting computerized topographical data and spatial analysis for a suitable representation of the output flow depth net- works and the velocity networks that are the focus of the program. Following the creation of the project file, a tri- angulated irregular network (TIN) premise is needed in order to perform calculations on the data. The availability of precise topographical statistics is highly necessary for all hydraulic models [12,13]. A map of the terrain with a scale of 1:25,000 and one of the rivers with a scale of 1:1000 is used for creating a TIN, utilizing ArcView’s 3D analysis facility. The related data is readied for use in the hydraulic simulation in HEC-RAS through TIN. It is tailored to compute geospatial data to be employed in RAS modelling and to process RAS results into a GIS world.
is the total degrees of freedom,
n k is the degrees of freedom for error MSM mean square model MSE mean square error.
3. Results
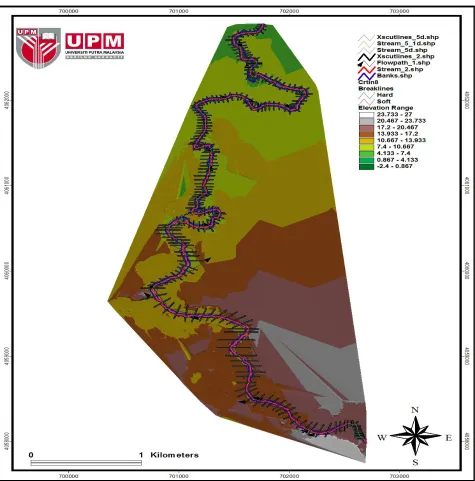
The HEC-RAS model uses the unsteady flow option for simulating floods with three steps: 1) geometry data pro- cessing in HEC-RAS, 2) integrating hydraulic data as initial and boundary conditions in the unsteady flow data files in HEC-RAS, and 3) calibrating and simulating floods. All pertinent geometry required for hydraulic modelling is the necessary geometric data, including the location of main river reaches, 200 cross sections which are measured, the input points upstream as well as the output points downstream. The information required for the cross sections is the coordinates regarding location and elevation; downstream reach length, the coefficient of manning roughness, the main channel bank station and the The mixture of computing topographical data and other
[image:3.595.61.537.553.734.2]GIS information in ArcView using GeoRAS gives us the ability to produce and export a geometry file to be ana- lyzed by RAS. The geometry file generated holds infor- mation on river, basin and station cross-section cutline’s, bank stations, flow path, reach lengths for left and right overbanks and channel, roughness coefficients and also can contain blocked obstructions,. The outcomes of RAS reproduction, such as river profiles, can be sent directly to a GIS environment, where they can be examined fur- ther by the help of the GeoRAS toolbar. A specifically
Table 1. Evaluation criteria for the assessment model performance.
Criterion Description
2
21 1
NSE 1
N N
i i
i i
Ys Yo Yo Yo
(3) Model efficiency for evaluating the ability of reproducing all stream-flows
2
21 1
NSH 1
N N
i i i i i
i i
Yo Yo Ys Yo Yo Yo Yo Yo
(4) Model efficiency for evaluating the ability of reproducing of the high flow2
MSE (Yo Ys ) N (5) Mean square error
2
1
RMSE (Yo Ys)
n
(6) Root mean square error
2
1 SSE SST
R (7) Coefficient of regression
2
1 SSE 1 SST 1
Figure 1. The cross sections of the Neka river.
coefficients of contracting and expansion (Figure 1). The reach lengths of cross sections and the coefficients of manning roughness are provided only for the left and right over-bank as well as the main channel. The method of extended cross sections is used to implement the flood- plain area in the model while considering the area as part of the river, so that when the channel sections are extended to the whole floodplain, the river is flooded immediately.
Digital data terrain was used to extend the cross sec- tions beyond initial surveyed part, so that all the area below the calculated water surface depicts flow. The di- gitized topography maps on a scale 1/1000 produced in
2004 by the Water Resources Management of Iran (WR- MIR) having 10 m interval elevation contours were used to derive DEM map of the floodplain having grid size 10 m. The geometric attributes of the streambed were in- tegrated with the digital terrain data by using flood map utility developed by Tate (1999) [14] to produce a modi-fied TIN based terrain model in four steps: 1) putting cross sectional data of stream in Arc-view GIS, 2) geo- referencing of the cross sections alongside the stream to the respective location in the model, 3) conversion of stream geometry to 3-D themes in Arc-view GIS, and 4) addi- tion of 3-D stream geometry in the digital terrain data to
produce a modified terrain model. The construction of the TIN model of the stream channel and floodplain is such that the DEM is superseded by the stream channel data within the defined area whereas they prevail in other areas, and the model can be used for the extraction of all data of stream geometry. Cross sections along floodplain branches are obtained from the DEM by setting perpen-dicular lines to each branch. Perpenperpen-dicular branches are set to each branch to obtain cross sections along flood- plain branches, and they are extended wide enough to cover the whole flood plain as determined by the histori-
[image:5.595.92.507.232.714.2]cal flood map in 2004. The cross section is set to full with of floodplains of all reaches to obtain accurate rep- resentation of storage volumes.
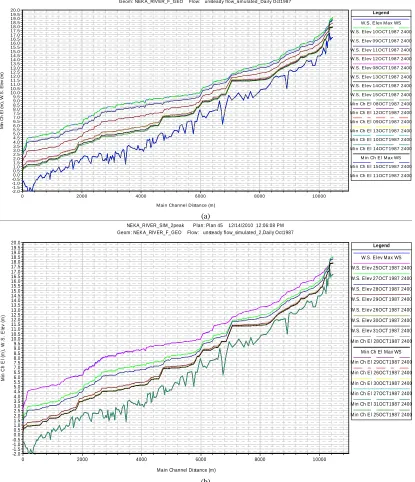
Figure 2 shows measured and simulated 24-hourly water levels with coupling HEC-GEORAS and HEC- RAS models for peak flood in 1987 at Neka river. Fig- ures representing graphical comparison between observ- ed and simulated 24-hourly river discharges for the other years are shown. The results show that the model predic-tions are generally in good agreement with observapredic-tions. Peak levels and time of occurrence are quite well pre-
0 2000 4000 6000 8000 10000
-2.0 -1.5 -1.0 -0.50.0 0.5 1.0 1.5 2.0 2.5 3.0 3.5 4.0 4.5 5.0 5.5 6.0 6.5 7.0 7.5 8.0 8.5 9.0 9.5 10.0 10.5 11.0 11.5 12.0 12.5 13.0 13.5 14.0 14.5 15.0 15.5 16.0 16.5 17.0 17.5 18.0 18.5 19.0 19.5
NE KA_RIVER_SIM_1peak P lan: Plan 43 12/12/2010 6:20:24 P M Geom : NEK A_RIV ER_F_GEO Flow: unsteady flow_sim ulated_Daily Oct1987
20.0 Legend
M ain Channel Distance (m )
M in Ch E l (m ), W .S . E le v ( m )
W.S. E lev M ax WS
W.S. E lev 10OCT 1987 2400
W.S. E lev 09OCT 1987 2400
W.S. E lev 11OCT 1987 2400
W.S. E lev 12OCT 1987 2400
W.S. E lev 08OCT 1987 2400
W.S. E lev 13OCT 1987 2400
W.S. E lev 14OCT 1987 2400
W.S. E lev 15OCT 1987 2400
Min Ch E l 08OCT1987 2400
Min Ch E l 12OCT1987 2400
Min Ch E l 09OCT1987 2400
Min Ch E l 13OCT1987 2400
Min Ch E l 10OCT1987 2400
Min Ch E l 14OCT1987 2400
Min Ch E l Max WS
Min Ch E l 15OCT1987 2400
Min Ch E l 11OCT1987 2400
(a)
0 2000 4000 6000 8000 10000
-2.0 -1.5 -1.0 -0.5 0.0 0.5 1.0 1.5 2.0 2.5 3.0 3.5 4.0 4.5 5.0 5.5 6.0 6.5 7.0 7.5 8.0 8.5 9.0 9.5 10.0 10.5 11.0 11.5 12.0 12.5 13.0 13.5 14.0 14.5 15.0 15.5 16.0 16.5 17.0 17.5 18.0 18.5 19.0 19.5
NEKA_RIVER_SIM_2peak Plan: Plan 45 12/14/2010 12:06:08 PM Geom: NEKA_RIVER_F_GEO Flow: unsteady flow_simulated_2,Daily Oct1987 20.0
Main Channel Distance (m)
M in C h El ( m ), W .S. El e v ( m ) Legend
W.S. Elev Max WS W.S. Elev 25OCT 1987 2400 W.S. Elev 27OCT 1987 2400 W.S. Elev 28OCT 1987 2400 W.S. Elev 29OCT 1987 2400 W.S. Elev 26OCT 1987 2400 W.S. Elev 30OCT 1987 2400 W.S. Elev 31OCT 1987 2400 Min Ch El 28OCT1987 2400
Min Ch El Max WS Min Ch El 29OCT1987 2400 Min Ch El 26OCT1987 2400 Min Ch El 30OCT1987 2400 Min Ch El 27OCT1987 2400 Min Ch El 31OCT1987 2400 Min Ch El 25OCT1987 2400
(b)
dicted. Peak levels at Neka basin Long are well simu- lated with a mean square error between 4.8 to 10.7 cm. These results indicate that the model is suitable for flood prediction in this catchment. The model has a reliable performance and flood levels are reproduced accurately making the model suitable for assessing flood risks.
4. Discussion
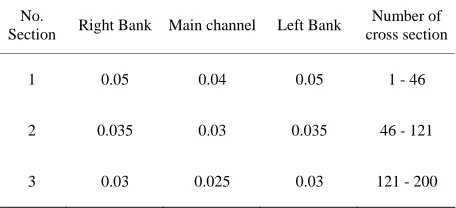
Model calibration is done through the floods of 1986- 1999 and model validation through the floods of 2002 to 2004. Manning coefficients are adjusted by calibrating HEC-RAS model. The performance of HECRAS is de- termined on criteria’s, MB and CR3,CR5, but flows are no longer the basis, now water levels are used as basis. The differences in observed and simulated values include the peak time for each flood, 24-hourly time series of water levels as well as runoff volumes. A cyclical proc- ess involving adjustment of manning coefficients, run-ning the model, and comparison of simulated and ob- served water surface level graphically as well as statisti- cally, is used for the calibration of the HECRAS model. These comparisons are then used to improve the model’s performance. The Manning resistance coefficient is con- sidered constant for all reaches and a group of cross sec- tions is formed per river because the presence of 200 measured and 617 interpolated cross sections makes it necessary. The characteristics of the right, left and main bed of the river channel have been measured separately to determine the coefficient of manning (Table 2) Unad- justed default coefficients for expansion and contraction of 0.1 and 0.3 respectively are also used.
[image:6.595.308.538.115.253.2]The performance of the model is acceptable for the validation and calibration period as is presented by the numerical analysis critique shown in Table 3. For valida- tion period (flood years 2002-2004) Nash-Sutcliffe ef- fecttiveness (CR3) is more than 0.92 along with elevated levels of water which are created with some effectiveness (CR5) of an increased rate of 0.94. For the validation, the model also estimates the water level with a perfected pre- cision as both CR3 falls between 0.79 - 0.90 and CR5 be- tween 0.87 - 0.92. For the calibration period (1986-1999).
Table 2. Calibrated manning coefficient for Neka river flood plane
No.
Section Right Bank Main channel Left Bank
Number of cross section
1 0.05 0.04 0.05 1 - 46
2 0.035 0.03 0.035 46 - 121
[image:6.595.59.287.631.735.2]3 0.03 0.025 0.03 121 - 200
Table 3. Evaluation criteria for the assessment of model per- formance.
Period flow hydrograph NSE (CR3)
NSH
(CR5)Adjusted R
2MSE
(cm) RMSE
(cm)
Oct - 87 0.86 0.89 0.944 10.7 3.28
Oct - 87 0.90 0.92 0.952 1.6 12.8
Mar - 89 0.81 0.92 0.99 1.8 13.3
Nov - 96 0.79 0.88 0.973 4.8 22
calibration period
Nov - 97 0.79 0.87 0.981 3.90 19.8
validation
period May - 03 0.92 0.94 0.984 2.80 16.7
5. Conclusion
The HEC-RAS model is used for the downstream flood- plain in the Neka river basin by employing the upstream inputs. For calibration and validation of the HEC-RAS model the recorded stage hygrographs located at the sta- tions of Ablu and Nozarabd were used. The HEC-RAS model was calibrated by adjusting the Manning’s coeffi- cients. The peak flood levels at Neka river are well si- mulated with a maximum mean square error of 10.7 cm when compared with observations. The model perform- ance is satisfactory for calibration and verification peri- ods. Nash-Sutcliffe effectiveness (CR3) is more than 0.92 along with water levels which are created with some effectiveness (CR5) of an increased rate of 0.94 for the validation period. The result proves that the model is appropriate for estimating flood hazards. The main diffi- culty of this part of the research is the inability to find proper flood plain observed data to use in checking the model. The lack of proper quality and details of rainfall and cross section data cause huge problems to allow for significant “hydrological” research in the region.
REFERENCES
[1] M. Morita, “Modeling of Conjunctive Two-Dimensional
Surface-Three-Dimensional Subsurface Flows,” Journal
of Hydraulic Engineering, Vol. 128, No. 2, 2002, p. 184. doi:10.1061/(ASCE)0733-9429(2002)128:2(184)
[2] J. E. Brandmeyer and H. A. Karimi, “Coupling
Method-ologies for Environmental Models,” Environmental
Mod-elling and Software, Vol. 15, No. 5, 2000, pp. 479-488. doi:10.1016/S1364-8152(00)00027-X
[3] Y. Lian, I. C. Chan, J. Singh, M. Demissie, V. Knapp and
H. Xie, “Coupling of Hydrologic and Hydraulic Models for the Illinois River Basin,” Journal of Hydrology, Vol. 344, No. 3-4, 2007, pp. 210-222.
doi:10.1016/j.jhydrol.2007.08.004
[4] A. Pistocchi and P. Mazzoli, “Use of HEC-RAS and
HEC-HMS Models with ArcView for Hydrologic Risk
Management,” iEMSs2002 Congress Proceedings, Lugano,
2002.
[5] R. G. Kamp and H. H. G. Savenije, “Hydrological Model
Coupling with ANNs,” Hydrology and Earth System
Sci-ences, Vol. 11, No. 6, 2007, pp. 1869-1881. doi:10.5194/hess-11-1869-2007
[6] V. Anselmo, G. Galeati, S. Palmieri, U. Rossi and E.
Todini, “Flood Risk Assessment Using an Integrated Hy-drological and Hydraulic Modelling Approach: A Case Study,” Journal of Hydrology, Vol. 175, No. 1-4, 1996.
pp. 533-554. doi:10.1016/S0022-1694(96)80023-0
[7] DHI, “A Modelling System for Rivers and Channels,”
Reference Manual, in DHI Software 2003, DHI Water &
Environment,Hørsholm, 2003.
[8] V. T. Chow, D. R. Maidment and L. W. Mays, “Applied
Hydrology,” McGraw-Hill, New York, 1988, p. 570.
[9] P. B. Bedient and W. C. Huber, “Hydrology and
Flood-plain Analysis,” Addison-Wesley, Reading, 1988, p. 650.
[10] N. M. Hunter, P. D. Bates, M. S. Horritt and M. D.
Wil-son, “Simple Spatially-Distributed Models for Predicting
Flood Inundation: A Review,” Geomorphology, Vol. 90,
No. 3-4, 2007, pp. 208-225. doi:10.1016/j.geomorph.2006.10.021
[11] U. S. A. C. o. E. USACE, HEC-RAS, River Analysis
System User’S Manual, Hydrological Engineering Centre, Davis, 2008.
[12] S. Mosquera-Machado and S. Ahmad, “Flood Hazard
Assessment of Atrato River in Colombia,” Water Resources
Management, Vol. 21, No. 3, 2007, pp. 591-609. doi:10.1007/s11269-006-9032-4
[13] K. Hardmeyer and M. A. Spencer, “Using Risk-Based
Analysis and Geographic Information Systems to Assess Flooding Problems in an Urban Watershed in Rhode Is-land,” Environmental Management, Vol. 39, No. 4, 2007,
pp. 563-574. doi:10.1007/s00267-005-0149-7
[14] E. C. Tate, D. R. Maidment and R. University of Texas at