PICOGRAM LEVEL QUANTIFICATION OF
*Srikanth
Department of Pharmaceutical Sciences, University College of Pharmaceutical Sciences,
Acharya Nagarjuna University, Guntur
ARTICLE INFO ABSTRACT
A simple, sensitive and accurate liquid chromatography tandem mass spectrometric method has been developed and validated for determination of
C18, 4.6 x 75 mm, 3.5 μm, 80
phase was used for Chromatographic separation of
monitored by electrospray ionization in positive ion multiple reaction monitoring (MRM) mode used to detect the
liquid extraction
validated over a linear concentration range of 50.0
≥ 0.9997. Both drug and Internal standards (IS) were stable in plasma sampl
Copyright©2017, Srikanth and Prameela Rani. This
unrestricted use, distribution, and reproduction in any medium, provided the original work is properly cited.
INTRODUCTION
Afatinib (AT) is presented as the dimaleate salt, with the chemical name N-(4-((3-Chloro-4-fluorophenyl)amino 7-(((3S)tetrahydro-3-furanyl)oxy)-6-quinazolinyl
lamino)-2-butenamide. Afatinib dimaleate is a white to brownish yellow powder, water soluble and hygroscopic, with
an molecular formula of C24H25ClFN5O3
weight of 485.93. It was used in the treatment for non small
cell lung cancer (Ravikumar et al., 2015).
reveals that very few analytical methods have been reported for the determination of Afatinib which includes Pharmacokinetics
studies (Miller et al., 2012; Yang et al., 2012
2013; Wu et al., 2014; Seiwert et al., 2014
2012), High performance liquid chromatography
et al., 2015), ultra-performance liquid chromatography
(Helvenstein et al., 2014; Marwa Fouad et al
chromatography-Mass spectroscopy (Adnan A.
2016; Peter Stopfer et al., 2012; Hideki Hayashi
is important to develop the superior bio analytical method with proper deuterated or analogue based internal standards interms of matrix effect and reproducibility. Moreover, Should not consider the runtime always to minimize the analysis rather than reproducibility and stability for long analytical batches. The present study describes, for the first time, the development and validation of an isocratic LC-MS/MS with highly efficient,
*Corresponding author: Srikanth, I.
Department of Pharmaceutical Sciences, University College of Pharmaceutical Sciences, Acharya Nagarjuna University, Guntur-522510
ISSN: 0975-833X
Article History:
Received 18th December, 2016
Received in revised form
20th January, 2017
Accepted 15th February, 2017
Published online 31st March, 2017
Key words:
LC-ESI-MS/MS, Afatinib, Human plasma.
Citation: Srikanth, I. and Prameela Rani, A. 2017.
International Journal of Current Research, 9, (03), 47555
RESEARCH ARTICLE
PICOGRAM LEVEL QUANTIFICATION OF AFATINIB IN HUMAN PLASMA SAMPLES
BY LC–ESI-MS/MS
Srikanth, I. and Prameela Rani, A.
Department of Pharmaceutical Sciences, University College of Pharmaceutical Sciences,
Acharya Nagarjuna University, Guntur-522510
ABSTRACT
A simple, sensitive and accurate liquid chromatography tandem mass spectrometric method has been developed and validated for determination of Afatinib
C18, 4.6 x 75 mm, 3.5 μm, 80 Å column, 5mM ammonium formate: acetonitrile (10:90 v/v) mobile phase was used for Chromatographic separation of Afatinib. The
monitored by electrospray ionization in positive ion multiple reaction monitoring (MRM) mode used to detect the Afatinib at m/z 486.10 /112.10 and
Afatinib-liquid extraction was employed in the extraction of analytes from human plasma. This method is validated over a linear concentration range of 50.0–10000.0 pg/mL with a correlation coefficient ( ≥ 0.9997. Both drug and Internal standards (IS) were stable in plasma sampl
This is an open access article distributed under the Creative Commons Att use, distribution, and reproduction in any medium, provided the original work is properly cited.
Afatinib (AT) is presented as the dimaleate salt, with fluorophenyl)amino)- quinazolinyl)-4(dimethy
butenamide. Afatinib dimaleate is a white to brownish yellow powder, water soluble and hygroscopic, with and a molecular treatment for non small Literature review reveals that very few analytical methods have been reported for which includes Pharmacokinetics
2012; Sequist et al.,
2014; Stopfer et al.,
, High performance liquid chromatography (Ravikumar performance liquid chromatography-DAD
et al., 2015), Liquid
Adnan A. Kadi et al.,
Hideki Hayashi et al., 2016). It
is important to develop the superior bio analytical method with or analogue based internal standards interms of matrix effect and reproducibility. Moreover, Should not consider the runtime always to minimize the analysis rather than reproducibility and stability for long analytical batches. , for the first time, the development MS/MS with highly efficient,
Department of Pharmaceutical Sciences, University College of Pharmaceutical 522510
more specific and highly sensitive,
linear method for quantitative determination of AT in human plasma with the small amount of plasma usage
MATERIALS AND METHODS
Chemicals and reagents
Afatinib (AT) reference standard (purity, 99.5%) was purchased from Symed labs, Afatinib
Torront research chemicals Canada (Fig.1). Tertiary butyl methyl ether (TBME), HPLC grade methanol and acetonitrile were purchased from J.T. Baker USA.
phosphate (KH2PO4, reagent grade), Ammonium formate
(reagent grade) was purchased from Merck Limited, Worli, Mumbai. Human plasma was obtained from Navajeevan blood bank, Hyderabad, India. Ultra pure water from MilliQ
(Millipore) was used through the study.
Instrumentation
The 1200 Series HPLC system (Agilent Technologies, Waldbronn, Germany). Mass spectrometric detection was performed on an API 4000 triple quadrupole instrument (ABI SCIEX, Toronto, Canada) using MRM. A turbo
interface in positive ionization mode was used. Data processing was performed on Analyst 1.4.1 software package (SCIEX).
International Journal of Current Research Vol. 9, Issue, 03, pp.47555-47560, March, 2017
INTERNATIONAL
OF CURRENT RESEARCH
2017. “Picogram level quantification of Afatinib in human plasma samples by LC 47555-47560.
IN HUMAN PLASMA SAMPLES
Department of Pharmaceutical Sciences, University College of Pharmaceutical Sciences,
A simple, sensitive and accurate liquid chromatography tandem mass spectrometric (LC/MS/MS) Afatinib in human plasma. Zorbax SB-Å column, 5mM ammonium formate: acetonitrile (10:90 v/v) mobile
The Afatinib and Afatinib-D4 were monitored by electrospray ionization in positive ion multiple reaction monitoring (MRM) mode was -D4 (IS) at 490.90 /112.10. Liquid-was employed in the extraction of analytes from human plasma. This method is 10000.0 pg/mL with a correlation coefficient (r) of ≥ 0.9997. Both drug and Internal standards (IS) were stable in plasma samples.
is an open access article distributed under the Creative Commons Attribution License, which permits
more specific and highly sensitive, simple extraction, good for quantitative determination of AT in human with the small amount of plasma usage.
MATERIALS AND METHODS
(AT) reference standard (purity, 99.5%) was Afatinib -D4 was obtained from Torront research chemicals Canada (Fig.1). Tertiary butyl methyl ether (TBME), HPLC grade methanol and acetonitrile were purchased from J.T. Baker USA. Potassium dihydrogen , reagent grade), Ammonium formate (reagent grade) was purchased from Merck Limited, Worli, Mumbai. Human plasma was obtained from Navajeevan blood bank, Hyderabad, India. Ultra pure water from MilliQ-system
) was used through the study.
The 1200 Series HPLC system (Agilent Technologies, Waldbronn, Germany). Mass spectrometric detection was performed on an API 4000 triple quadrupole instrument (ABI-SCIEX, Toronto, Canada) using MRM. A turbo electrospray interface in positive ionization mode was used. Data processing was performed on Analyst 1.4.1 software package INTERNATIONAL JOURNAL OF CURRENT RESEARCH
Detection
The mass transitions were selected as m/z 486.10/112.0 and
m/z 490.90/112.10 for quantification of AT and ATD4
respectively (Figure-3 &4).
Chromatographic conditions
chromatographic separation was achieved with 5 mM ammonium formate: acetonitrile (10:90v/v), gave the best peak shape and low baseline noise was observed using the Zorbax
SB-C18, 4.6 x 75 mm, 3.5 m 80 Å. The total analysis time
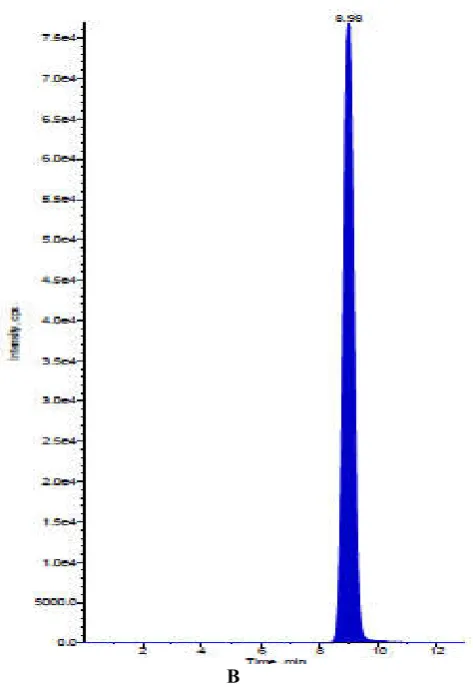
was 12 min and flow rate was set to 0.6 mL/min. The temperature was set to 40°C for the column oven. The sample volume for the injection into mass spectrometry was adjusted to 20 µL for better ionization and chromatography. Afatinib-D4 (ATAfatinib-D4) was selected as IS (internal standard) due to its compatibility with analyte chromatographic conditions. The analyte and internal standard were eluted at 9.2 (AT), 8.2 (ATD4) minutes with total runtime of 13 minutes for each injection.
Calibration standards and quality control Samples
Standard Stock solutions of AT (100.0 µg/mL) were prepared in methanol. From each stock solution 500.0 ng/mL, 25.0 ng/mL, 2.5 ng/mL intermediate dilutions were prepared in plasma. Aliquots of 500.0 ng/mL, 25.0 ng/mL and 2.5 ng/mL were used to spike blank human plasma in order to obtain calibration curve standards of 50.0, 100.0, 500.0, 1000.0, 2000.0, 4000.0, 6000.0, 8000.0 and 10000.0 pg/mL. Four levels of QC concentrations at 50.0, 150.0, 3000.0 and 8000.0 pg/mL (LLOQ, LQC, MQC and HQC) were prepared by using the different plasma. Spiked calibration curve standards and
Quality control standards were stored at -30 oC. Standard stock
solutions of ATD4 (100.0 µg/mL) were prepared in methanol. ATD4 was further diluted to 30.0 ng/mL (Spiked concentration of internal standard) using 50% methanol and stored in the
refrigerator 2-8 0C until analysis.
Sample preparation
Liquid-liquid extraction was carried out to extract the drug and IS for this purpose 100 µL of respective concentration of plasma sample was taken into polypropylene tubes and mixed with 50µL of internal standard (30.0 ng/mL). This was
followed by addition of 100 L of 10mM KH2PO4 solution
and 2.5 mL of methyl tertiary butyl ether and vortexed for approximately 5 minutes. Then the Samples were centrifuged at 4000 rpm for 10 minutes at 20°C. Further, the supernatant was transferred into labeled polypropylene tubes and evaporated with nitrogen gas at 40°C. Then the samples were reconstituted with the reconstitution solution (Acetonitrile: 5mM ammonium formate (90:10)) and vortexed for 2 minutes. Finally, Sample was transferred into auto sampler vials to inject into the LC-MS/MS.
Selectivity and specificity
Selectivity was performed by analyzed the human blank
plasma samples from six different sources (donors) with an additional hemolysed group and lipedimic group to test for interference at the retention times of analytes. The peak area of AT in blank samples should not be more than 20% of mean peak area of LOQ of AT. Similarly, peak area of ATd4 in a
blank sample should not be more than 5% of mean peak area of LOQ of ATd4.
Precision and accuracy
Precision and accuracy was determined by replicate analysis of
quality control samples (n = 6) at LQC (low quality control),
MQC (medium quality control) and HQC (high quality control) levels. The % CV should be less than 15%, and accuracy should be within 15% except LLOQ where it should be within 20%.
Matrix effect
The matrix effect due to plasma was used to evaluate the ion suppression/enhancement in a signal when comparing the absolute response of QC samples after pretreatment (Liquid-liquid extraction with MTBE) with that of the reconstituted samples. Experiments were performed at MQC levels in triplicate with six different plasma lots. The acceptable precision (%CV) of ≤ 15% was maintained.
Recovery
The extraction efficiencies of AT and ATd4 were determined by analysis of six replicates at each quality control concentration level and at one concentration for the internal standard ATd4. The percent recovery was evaluated by comparing the peak areas of extracted standards to the peak areas of non extracted standards (spiked into mobile phase).
Limit of detection and quantification (LOD and LOQ)
The limit of detection (LOD) is a parameter that provides the lowest concentration in a sample that can be detected from background noise but not quantitated. LOD was determined using the signal-to-noise ratio (s/n) of 3:1 by comparing test results from samples with known concentrations of analytes with blank samples. The limit of quantitation (LOQ) is defined as the lowest concentration of analyte that can be determined with acceptable precision and accuracy. The LOQ was found by analyzing a set of mobile phase and plasma standards with a known concentration of AT.
Stability (Freeze- thaw, Auto sampler, Room temperature, Long term)
Stock solution stability was performed by comparing the area response of analyte and internal standard in the stability sample, with the area response of sample prepared from fresh stock solution. Stability studies in plasma were performed at the LQC and HQC concentration level using six replicates at each level. Analyte was considered stable if the % Change is
less than 15% as per US FDA guidelines 13. The stability of
spiked human plasma samples stored at room temperature (bench top stability) was evaluated for 48 h. The stability of spiked human plasma samples stored at -30 °C in autosampler (autosampler stability) was evaluated for 55.5 h. The autosampler sample stability was evaluated by comparing the extracted plasma samples that were injected immediately (time 0 h), with the samples that were reinjected after storing in the autosampler at 20°C for 55.5 h. The reinjection reproducibility was evaluated by comparing the extracted plasma samples that were injected immediately (time 0 h), with the samples that were re-injected after storing in the autosampler at 20°C for 27
h. The freeze–thaw stability was conducted by comparing stability samples that had been frozen at –30 °C and thawed three times, with freshly spiked quality control samples. Six aliquots each of LQC and HQC concentration levels were used for the freeze–thaw stability evaluation. For long term stability evaluation the concentrations obtained after 71days were compared with initial concentrations.
A
[image:3.595.317.554.55.399.2]
B
Fig.1. Chemical Structures of A) Afatinib (AT) B) (ATD4)
A
thaw stability was conducted by comparing the 30 °C and thawed three times, with freshly spiked quality control samples. Six aliquots each of LQC and HQC concentration levels were used thaw stability evaluation. For long term stability luation the concentrations obtained after 71days were
(AT) B) Afatinib-D4
[image:3.595.48.281.451.799.2]Figure 2. Chromatograms of A) (ATd4)
RESULTS AND DISCUSSION
Method development and validation
The goal of this work is to develop and validate a simple, rapid and sensitive assay method for the quantitative determination of AT from plasma samples. LC
of the most powerful analytical tool in clinical
pharmacokinetics for its selectivity, sensitivity and
reproducibility. The MS optimization was performed by direct infusion of solutions of AT and AT d4 into the ESI source of the mass spectrometer. The vital parameters like ionization type, temperature, voltage, gas parameters
and heater gases, compound parameters like DP, EP, FP, CE and CXP were optimized to obtain a better spray shape and ionization to form the respective productions from the protonated AT and AT d4 molecules.
conditions, especially, composition of the mobile phase, selection of suitable column was optimized through several trials to achieve the best resolution and increase the signal of analyte and internal standard. Different extraction methods like solid phase extraction, Liquid
methods were optimized for extraction of AT and AT d4 from the plasma sample. A good separation and elution were achieved using 5 mM ammonium formate: acetonitrile (10:90v/v) as the mobile phase, at a flow
mL/minutes and injection volume of 20 µL. Liquid extraction was chosen to optimize the drug and internal standard. The retention time was optimized 9.2 minutes for AT and 8.2 minutes for AT d4 (Figure
B
A) Afatinib (AT) B) Afatinib -D4 (ATd4)
RESULTS AND DISCUSSION
Method development and validation
The goal of this work is to develop and validate a simple, rapid and sensitive assay method for the quantitative determination of AT from plasma samples. LC-MS/MS has been used as one
of the most powerful analytical tool in clinical
s selectivity, sensitivity and
reproducibility. The MS optimization was performed by direct infusion of solutions of AT and AT d4 into the ESI source of the mass spectrometer. The vital parameters like ionization type, temperature, voltage, gas parameters such as nebulizer and heater gases, compound parameters like DP, EP, FP, CE and CXP were optimized to obtain a better spray shape and ionization to form the respective productions from the
protonated AT and AT d4 molecules. Chromatographic
cially, composition of the mobile phase, selection of suitable column was optimized through several trials to achieve the best resolution and increase the signal of analyte and internal standard. Different extraction methods like quid-liquid extraction, precipitation methods were optimized for extraction of AT and AT d4 from the plasma sample. A good separation and elution were achieved using 5 mM ammonium formate: acetonitrile (10:90v/v) as the mobile phase, at a flow-rate of 0.6 mL/minutes and injection volume of 20 µL. Liquid-liquid extraction was chosen to optimize the drug and internal standard. The retention time was optimized 9.2 minutes for AT
47558 Srikanth and Prameela Rani, Picogram level quantification of afatinib in human plasma samples by LC–ESI-MS/MS
[image:4.595.107.497.57.764.2]Figure 3. MRM scan of Afatinib (AT)
Linearity
Calibration curve was plotted as the peak area ratio (AT/AT d4) versus (AT) concentration. Calibration was found to be linear over the concentration range of 50.0 – 10000.0 pg/mL.
The correlation coefficient (r2) was greater than 0.9997 for all
curves (Table 1).
Selectivity
The selectivity of the method assessed by comparing chromatograms of blank plasma. There were no significant endogenous peaks were observed at respective retention time of AT and AT d4. The results indicate that the method exhibited both good specificity and selectivity.
Precision and Accuracy
Precision and accuracy for this method were controlled by calculating the Within-run and Between-run variations at three concentrations (150.0, 3000.0 and 8000.0 pg/mL) of QC samples in six replicates. As shown in Table 2 the Within-run Precision and Accuracy were between 1.1 to 7.4 and 90.67 to 112.76 % for AT. Similarly, the Between-run Precision and Accuracy were between 3.5 to 3.77 and 92.78 to 106.44 % for AT. These results indicate the adequate reliability and reproducibility of this method within the analytical range.
Matrix effect
The ion suppression/enhancement in the signal at MQC level was found % CV 1.21. These results indicating that there is no effect on ion suppression and ion enhancement.
Recovery
The %recoveries of AT were determined at three different concentrations 150.0, 3000.0 and 8000.0 pg/mL, were found to be 99.6 ±3.53, 88.2 ±2.7 and 97.60 ± 4.7 %. The overall average recoveries of AT and AT d4 was found to be 95.1 ± 6.1 and 98.1 ± 4.47%. Recoveries of the analyte and IS were consistent, precise and reproducible.
Limits of Detection and Quantification (LOD&LOQ)
The LOQ & LOD signal-to-noise (S/N) values found for six injections of AT at LOQ & LOD concentrations were 31.95pg/ml and 10.5pg/ml.
Stability (Freeze - thaw, Auto sampler, Room temperature, Long term)
[image:5.595.45.551.75.173.2]Stock solution stability was performed to check stability of AT and ATd4 in stock solutions prepared in methanol and stored at 2-8 °C in a refrigerator. The freshly prepared stock solutions were compared with stock solutions prepared before 26 days. The % change for AT and ATd4 were -0.02% and 0.03% respectively indicate that stock solutions were stable at least for 26 days. Room temperature and autosampler stability for AT was investigated at LQC and HQC levels. The results revealed that AT was stable in plasma for at least 72 h at room temperature, and 78 h in an auto sampler. It was confirmed that repeated freezing and thawing (three cycles) of plasma samples spiked with AT at LQC and HQC levels did not affect their stability. The long-term stability results also indicated that AT was stable in a matrix up to 71days at a storage Table 1. Calibration curve details of Afatinib
Spiked plasma concentration (pg/mL) Concentration measured (mean) (pg/mL) (n = 5) Precision RSD. (n = 5) Accuracy %
50.0 51.0 ± 1.3 2.5 102.00
100.0 96.6 ± 4.7 4.9 96.60
500.0 498.4 ± 24.7 5.0 99.68
1000.0 1000.0 ± 17.1 1.7 100.00
2000.0 2013.0 ± 74.6 3.7 100.65
4000.0 4008.4 ± 206.6 5.2 100.21
6000.0 5956.5 ± 190.7 3.2 99.28
8000.0 7952.2 ± 165.6 2.1 99.40
[image:5.595.40.554.209.280.2]10000.0 10317.1 ± 487.6 4.7 103.17
Table 2. Precision and accuracy (analysis with spiked plasma samples at three different concentrations)
Spiked plasma
concentration (pg/mL)
Within-run (n=6) Between-run (n=6)
Concentration measured (pg/mL) (mean±S.D.)
Precision RSD
Accuracy %
Concentration measured (pg/mL) (mean±S.D.)
Precision RSD
Accuracy %
50.00 51.4±2.3 4.19 105.57 55.5±4.1 7.08 114.75
150.00 154.9±3.4 2.36 106.1 157.9±5.7 3.46 106.44
3000.00 3103.8±102.0 7.41 112.76 3133.0±108.2 3.5 105.01
8000.00 7297.1±89.9 1.1 90.67 7278.7±275.5 3.8 92.78
Table 3. Stability of Afatinib in human plasma samples
Stability experiments Storage
condition
Spiked plasma concentration (pg/ml)
Concentration measured (n=6) Mean ± SD
RSD (n=6) (%)
Accuracy (%)
Bench top in plasma RT
48 hr
150.0 148.3 ± 8.1 5.45 95.48
8000.0 6728.3±206.3 3.05 98.75
Processed (extracted sample)
Autosampler 55.5 hr
150.0 162.3 ± 2.4 1.54 108.03
8000.0 7536.7±294.5 3.97 97.48
Freeze/Thaw stability -300C
Cycle-3
150.0 156.5 ± 4.0 2.53 104.53
8000.0 7381.7±173.4 2.34 93.61
Long-term stability in human plasma - 300C
71 days
150.0 160.3±13.2 8.25 95.64
[image:5.595.49.546.311.421.2]temperature of -30 °C. The results obtained from all these stability studies are tabulated in Table 3. Precision (%CV) is less than 5 for Room temperature, long-term, Freeze thaw, auto sampler stability.
Conclusion
The proposed research work is highly specific due to the inherent selectivity of tandem mass spectrometry and has significant advantages over other described methods in previously. Quantification of Afatinib was compared with respective isotope labeled internal standards. Extraction of analyte and IS were achieved by using LLE. Linearity range, column, mobile phase, flow rate, injection volume, plasma usage volume for analysis was improved. Hence this method has significant advantages over previously reported methods in-terms of Selectivity, sensitivity, Linearity, Reproducibility.
Acknowledgements
Authors wish to thank the support received from IICT (Indian institute of chemical technology) Hyderabad India for providing Literature survey, APL Research Pvt. Ltd. Hyderabad India to carry out this Research work.
REFERENCES
Adnan A. Kadi, Ali S. Abdelhameed, Hany W. Darwish, Mohamed W. Attwa, Nasser S. Al-Shakliah. 2016. A highly efficient and sensitive LC-MS/MS method for the determination of afatinib in human plasma: application to a
metabolic stability study. Biomedical Chromatography, 30
(8), 1248–1255.
Guidance for industry. May 2001. Bioanalytical method validation, U.S. Department of Health and Human Services, food and drug administration, center for drug evaluation and research (CDER), Center for biologics evaluation and research (CBER).
Helvenstein, M., S. Hambye, and B. Blankert, 2014. “Determination of three tyrosine kinase inhibitors and one active metabolite by an identical and validated ultra-performance liquid chromatography-DAD method in
human plasma,” Current Pharmaceutical Analysis, vol.10,
no.3, 161–168.
Hideki Hayashi, Yutaro Kita, Hirotoshi Iihara, Koumei Yanase, Yasushi Ohno, Chiemi Hirose, Maya Yamada,
Kenichiro Todoroki, Kiyoyuki Kitaichi, Shinya
Minatoguchi, Yoshinori Itoh, Tadashi Sugiyama. 2016. Simultaneous and rapid determination of gefitinib, erlotinib
and afatinib plasma levels using liquid
chromatography/tandem mass spectrometry in patients with
non-small-cell lung cancer. Biomedical Chromatography:
BMC, 30 (7): 1150-4.
Marwa Fouad, Maxime Helvenstein, Bertrand Blankert. 2015. Ultra High Performance Liquid Chromatography Method for the Determination of Two Recently FDA Approved TKIs in Human Plasma Using Diode Array Detection.
Journal of Analytical Methods in Chemistry, 1-6.
Miller, V. A., V. Hirsh, J. Cadranel et al. 2012. “Afatinib
versus placebo for patients with advanced, metastatic non-small-cell lung cancer after failure of erlotinib, gefitinib, or both, and one or two lines of chemotherapy (LUX-Lung 1):
a phase 2b/3 randomised trial,” The Lancet Oncology,
vol.13,no.5,.528–538.
Peter Stopfer, Kristell Marzin, Hans Narjes, Dietmar Gansser, Mehdi Shahidi, Martina Uttereuther-Fischer & Thomas Ebner. 2012. Afatinib pharmacokinetics and metabolism
after oral administration to healthy male volunteers. Cancer
Chemother Pharmacol., Apr;69(4):1051-61.
Ravikumar.Vejendla, CVS Subramanyam, G Veerabhadram. 2015. New RP-HPLC method for the determination of afatinib dimaleate in Bulk and pharmaceutical dosage
forms. Indo American Journal of Pharmaceutical
Research, Vol 5, Issue 05.
Seiwert, T. Y., J. Fayette, D. Cupissol et al. 2014. “A
randomized, phase II study of afatinib versus cetuximab in metastatic or recurrent squamous cell carcinoma of the
head and neck,” Annals of Oncology, Vol.25, No.9,1813–
1820.
Sequist, L. V., J. C.-H. Yang, N. Yamamoto et al. 2013.
“Phase III study of afatinib or cisplatin plus pemetrexed in patients with metastatic lung adenocarcinoma with EGFR
mutations,” Journal of Clinical Oncology, Vol.31, No.27,
3327–3334.
Stopfer, P., K. Marzin, H. Narjes et al. 2012. “Afatinib
pharmacokinetics and metabolism after oral administration
to healthy male volunteers,” Cancer Chemotherapy and
Pharmacology, Vol.69, No. 4, 1051–1061.
Wu, Y.-L., C. Zhou, C.-P. Hu et al. 2014. “Afatinib versus
cisplatin plus gemcitabine for first-line treatment of Asian patients with advanced non-small-cell lung cancer harbouring EGFR mutations (LUX-Lung 6): An
open-label, randomised phase 3 trial,” The Lancet Oncology,
Vol.15, No.2, 213–222.
Yang, J. C. H., J. Y. Shih, W. C. Su et al. 2012. “Afatinib for
patients with lung adenocarcinoma and epidermal growth factor receptor mutations (LUX-Lung 2): a phase 2 trial,”
The Lancet Oncology, 13(5), 539–548.
47560 Srikanth and Prameela Rani, Picogram level quantification of afatinib in human plasma samples by LC–ESI-MS/MS