Abstract— Crack formation in polyurethane material is an exceedingly non-linear and complex phenomenon. A 2-D plain strain, linear and non-linear analysis to understand the influence of central cracks and crack sizing is discussed under Mode 1 of crack displacement i.e. Opening Mode.
Cracks in solid rocket propellant disturb the geometry and require design characteristics .This research work deals with investigation of stress intensity factor determined experimentally and Finite Element based simulations, which can be used to help explain the severity of the associated crack in a given material.
This investigation involves single polyurethane material sheets which have Photo elastic characteristics. The global geometry used for this purpose is rectangular. The stress intensity factors were examined and a comparison between linear and non-linear analysis of crack propagation is presented for central crack propagation in the opening mode.
The result shows stress intensity factor for a range of loads in Linear Elastic Fracture Mechanics(LEFM) and Elastic Plastic Fracture Mechanics (EPFM) and helps in introducing a correction factor to have an estimated idea for the Crack Tip Opening Displacement (CTOD) in EPFM.
Index Terms—LEFM, EPFM, Stress Intensity Factor, CTOD, Photoelasticity,
I. INTRODUCTION
Over recent years, Polyurethane material has been used extensively in various applications. The material is used as a solid rocket propellant, as a part of home furniture, freezers, and for thermal insulation panels in the construction sector. In all above applications the failure of the material becomes important as material undergoes static and dynamic loadings.
Fracture mechanics mostly deals with 2-dimensional problems, where no quantity depends on third co-ordinate i.e. z co-ordinate. Two special cases are plane stress and plane strain conditions [1].
This work was supported by College of Electrical and Mechanical Engineering, National University of Sciences and Technology (NUST). Financial support was provided by Higher Education Commission, Pakistan.
Mr. Mubashir Gulzar is Lecturer at Department of Mechanical Engineering, NUST College of Electrical and Mechanical Engineering. (Tel: 0092-51-9278050,
email: [email protected])
For soft solids, e.g. the case under discussion; modulus is much lessto the physical value for cohesive strength. Consequently, cracks undergo a very large deformation before fracture and blunting at crack tip is also in question [2]. So if we considered the experimental technique for crack propagation analysis, it is crucial to understand photo elasticity theory in this regard. The basic principles behind Photoelasticity have been around for about 200 yrs [3]. Transmission Polariscope provides an experimental platform to apply Photo elasticity theory on Photo elastic materials. The Photo elasticity model is an extremely versatile, simple, and powerful source tool for helping the engineer or designer by providing the design data before expensive parts or structures with potential design errors are made [4]. Circular and Plane Polariscope arrangements are used for finding out the Principal Stress magnitudes and directions respectively at crack tips [5].
On the other hand for simulation of crack propagation Newman and Armen [6] and Ohji et al. [7] were the first to investigate the 2-D, finite-element analyses of the crack-closure problem. Elber [8] had investigated the same phenomenon experimentally. Newman and Armen [6] and Ohji et al. [7] results under plane-stress conditions were confirming the results of Elber [8]. Under plane-strain conditions Blom and Holm [9] and Fleck and Newman [10-11] studied crack-growth and closure and compared crack propagation characteristics to plane stress problems. Wu and Ellyin [12] have used a truss element together with pairs of contact elements and the element death option for crack propagation simulation.
The phenomenon of plasticity-induced fatigue crack closure under plane strain conditions is one of the most controversial topics concerning the mechanics of crack propagation [13]. LEFM is more likely to be applicable for small cracks compared to the overall length of specimen. In case the length of the crack is very small, the size of the plastic zone will no longer be smaller as compared to the crack length, so the EPFM theory is considered. There are many parameters that can be used but still the J-integral and the Crack Opening Displacement (COD) are generally accepted approaches. [14].J-integral is related to the rate of change of potential energy, it is a feasible parameter for describing the fracture of the non-linear elastic materials. But the restrictions to the application of J-Integral, are
1. Monotonic stresses and no unloading.
2. Better results for very small deformations.[15] In ductile materials the deformation can occur in the plastic zone where the deformations can no longer be considered small. The crack tip opening displacement, (CTOD),
Mubashir Gulzar
Linear and Non Linear Analysis of Central
Crack Propagation in Polyurethane Material
formerly the crack opening displacement (COD), was first proposed by Wells [16] to describe the fracture behavior in the vicinity of the crack tip. It was conjectured that the opening of the notch faces, namely the crack tip opening displacement, could be used to characterize this behavior??
Fig.1 Typical view of Crack Tip Opening Displacement (CTOD) [1]
II. MATHEMATICAL MODEL
By linear elastic theory it can be derived that for any crack propagating phenomenon at any point near the crack, the stresses can be given by the relation [1].
(1)
The term ‘K’ in the above equation signifies the magnitude of stress at that location therefore it is called “stress intensity factor”. Stress intensity factor is different from the well-known stress concentration factor, the latter being the dimension-less ratio of increase in stress level relative to the nominal stress. By performing dimensional analysis the value of ‘K’ can be determined as linearly related to the stress and directly related to the characteristic length
K=σ√(πa) (2)
A central cracked plate under external normal loading is shown in Fig.2
Fig.2 Finite width central crack plate [1]
Purely empirical, correction factor ‘C’ is due to Feddersen [17]. As an approximation to Isida’s results he suggested that Feddersen (accurate to 0.3% for a/W = .35)
K = Cσ√ (πa) (3) Where,
C = √ (πa/W)
SIF ‘K’ serves as the characterizing parameter for LEFM. The relationship of apparent stress intensity factor ‘Kap’ with maximum shear stress can be given as
Kap = 2
τ max
√ (2 л r) (4) In case where plastic zone is not so small the concepts of LEFM cannot be applied and the problem has to be solved elasto-plastically.A direct relationship exists between the CTOD and K which can be given as:
CTOD = K2 / (Eσys) (5)
This relation is true only for the case where σ >> σys. The
actual relationship between K and CTOD also depends upon stress state and material behavior. This can be incorporated in the equation by introducing a constant C. So
CTOD = K2 / (CEσys) (6) where C is taken as 1.0 in case of plane stress and 2.0 for plane strain.
III. LINEAR ELASTIC FRACTURE MECHANICS A. Experimental Work
Specimen Material
A Photoelastic experiment was performed on Transmission Polariscope using a specimen made of Polyurethane material i-e PSM 4.
The material properties of PSM-4 are Elastic Modulus = 4.14 MPa
Poisson’s Ratio = 0.5
B. Specimen Configuration
A rectangular sheet of polyurethane material sheet PSM-4 manufactured by Photo elastic Divisions USA is selected for experimental investigations of stress intensity calculations. The geometry of the specimen is described in Fig.3. The specimen has a width of 5 inches, a height of 10 inches, and a central crack of length 1 inch exactly in the middle of the plate. The thickness of the plate is 0.25 inches.
Fig.3 Dimensions for the Specimen used C. Experimental Procedure
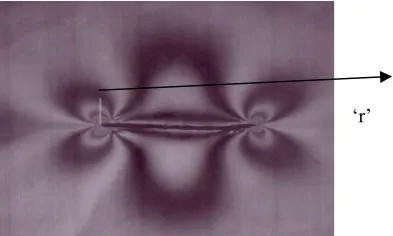
The specimen prepared according to the configurations mentioned above was then clamped in the Transmission Polariscope and the tensile load was applied. Due to the application of the normal loading, fringes appeared. Black and white photographs of these fringes were taken with the help of a digital camera. The procedure was repeated for different conditions of load. These photographs were then studied to determine the values of ‘r’, the distance of the fringe from the crack tip at right angle as shown in Fig. 4. Knowing the values of ‘r’, ‘a’ (half of the crack length), and ‘N’ (fringe order), the Smith Extrapolation method was used to determine the value of the Stress Intensity Factor (K). Photographs obtained are full field records of fringe orders ‘N’. Results of fringe pattern photographs for different loading can be traced on paper and complete distribution of stresses can be found by the basic techniques of Photo elasticity. Following is the photograph of fringes pattern taken by digital camera at 35N load.
[image:3.595.75.264.50.273.2]
‘r’
Fig.4 Fringe pattern at 35N load for central crack specimen PSM4, where ‘r’ is shown as vertical distance from crack tip to Fringe.
[image:3.595.331.522.50.173.2]The fringe pattern for other loading conditions of 25N and 15N were also considered, the fringe pattern photographs are shown as follows:
Fig. 5 Fringe pattern at 25 N load for central crack specimen PSM-4
Fig. 6 Fringe pattern at 15 N load for central crack specimen PSM-4 Results obtained are as shown in the table1.
TABLE1
VALUES OF (R/A) AT DIFFERENT LOADS
Load 15N Load 25N Load 35N
(r/a)
N (Fringe Order)
(r/a)
N (Fringe Order)
(r/a) N (Fringe Order) 0.03 1 0.02 1 .02 1 0.35 2 0.3 2 0.23 2
0.56 3 0.43 3
0.62 4
The data given in the table 1 was used to obtain the stress intensity factor at the crack tip with the help of Smith Extrapolation Method.
D. Smith Extrapolation Method
[image:3.595.70.267.533.651.2]In this method, the Least Square technique [18] was employed to fit the non linear data. The graphs were plotted using √(r/a) along x-axis and ‘K/K0’ along y-axis. The extrapolated line for 35N load is
[image:3.595.310.543.623.751.2]By using the data in the Table 1, other loads are also taken to get Smith Extrapolations for finding the ratio of apparent stress intensity factor to nominal stress intensity factor at the crack tip which is the value at y-intercept
Fig.8(a)Smith Extrapolation for 25N Fig.8(b)Smith Extrapolation for 15N K/K0 value obtained by above technique was 0.9068 for 35N Load as shown in Fig 5.
Now the K0 can be obtained by the formula
K0 = a. (7) Where ‘a’ is the half of the crack length and = P / td (where t= thickness of plate & d= diameter of the hole). The value of K0 for this case comes out to be K0 = 166.45 Pam. The relation for K/K0 was then used to calculate the value of K which comes out to be 150.9 Pam. The same method was utilized to calculate the value of K for other loads. The results are shown in Table 2.
TABLE 2
VALUES OF K FOR DIFFERENT LOADS S. No. Load
(N)
Value of K (Pam ) 1 15 64.67 2 25 107.81 3 35 150.9
E. Simulation Results
Results Using ANSYS 11.0
ANSYS is an engineering tool which develops general-purpose analysis. For the specimen under consideration we implemented 2-D crack analysis on rectangular sheet whose dimensions are already discussed under the topic of specimen configuration. Mesh concentration around crack tip is focused by using mesh tool in ANSYS 11.0 [19]. Here for LEFM, we solve the fracture mechanics problem for finding stress concentration factor (K).
Assumptions and Approach
a. Linear elastic fracture mechanics (LEFM) b. Plane strain problem
c. As we have used LEFM assumption, the SIFs at a crack tip may be computed using the ANSYS KCALC command. The analysis used a fit of the nodal displacements in the vicinity of the crack tip. d. Due to the symmetry of the problem, only a
quarter model is analyzed
e. The crack-tip region is meshed using quarter-point (singular) 8-node quadrilateral elements (PLANE82).
Since solution for central crack specimen is under
specimen is focused and solved for evaluation of stress intensity factor (K).
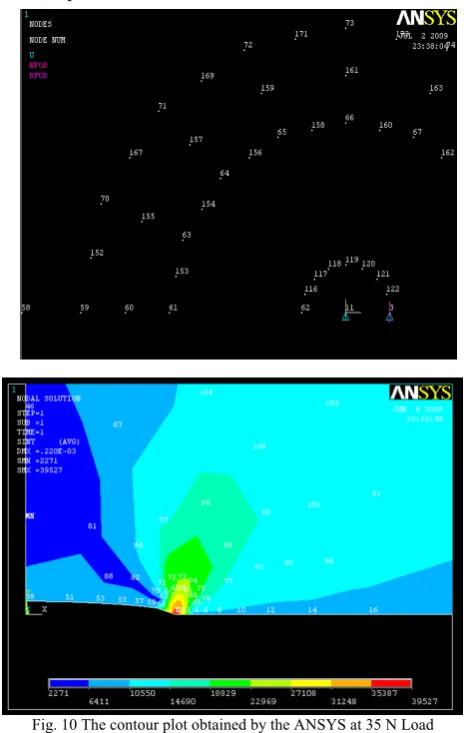
[image:4.595.46.298.107.205.2]After preprocessing and meshing the solution was done in post processing by giving the path on the crack face in terms of nodes. The value of stress intensity is evaluated for Mode 1 for this path.
Fig. 9 Defining Define Crack-Face Path
Fig. 10 The contour plot obtained by the ANSYS at 35 N Load The corresponding Stress Intensity for 35N load is K = 136.29 Pam. Similar results were obtained for other loads which are discussed in Table 3.
F. Results Using Pro-Mechanica
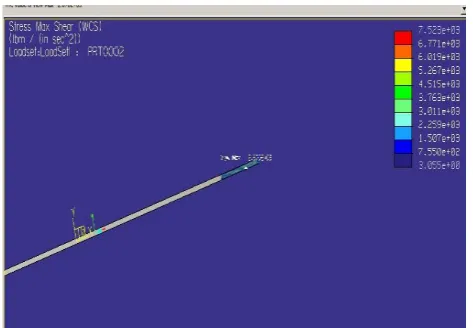
[image:4.595.310.545.120.487.2] [image:4.595.95.244.355.462.2] [image:4.595.325.532.634.769.2]The value of Apparent Stress Intensity Factor at the crack tip can be given by the relation
Kap = 2 τ max √ (2 л r) (8) The value of τ max for 35N is 3.175e +3 as shown in the above simulation result. This value was then used in the above formula to calculate the K, which came out to be 137.85 Pa√m. Assuming that Stress Intensity is taken at the crack tip; the value of r used was 0.000075m, which was very close to zero.
Similarly, the stress intensity factors for other two loads can be determined by finding out their respective maximum shear stresses at the crack tip.
IV. ELASTIC PLASTIC FRACTURE MECHANICS The main question concerning fatigue crack growth is: how long does it take for a crack to grow from a certain initial size to the maximum permissible size, i.e. the crack size at which failure of a component or structure is just avoidable [1].
Since Photoelasticity technique and related Transmisiion Polariscope experimental setup is helpful for LEFM, therefore the non linear characteristic complexity of crack propagation behavior is estimated by simulations with the help of Pro-Mechanica.
A. Results Using Pro Mechanica Hyper-Elastic Approach
A hyper elastic or Green elastic material is an ideally elastic material for which the stress-strain relationship derives from a strain energy density function. The hyper elastic material is a special case of a Cauchy elastic material.
In this model the data required was the value of the constants C10 and D1, where
C10 = G (Shear Modulus of Material) D1 = 2 / K (Bulk Modulus of Material)
These two constant G and K have a direct relationship with the (E) Elastic Modulus of material to use Neo-Hookean Model appropriately [28]. The relationships of E with K and G are
G = E / 2(1 + υ) K = E /3(1 - 2υ)
For finding out the stress intensity factor at the crack tip we have the relation between the apparent stress intensity factor and the maximum shear stress of the material.
Kap = 2
τ max
√ (2 л r) (9) [image:5.595.304.541.48.212.2]Therefore, at 35N the value of
τ max came out to be 2.870e
+3 as shown in following figure.Fig. 12 The Maximum shear Stress at left tip of central crack for Neo-Hookean model
Similarly for other loadings of 25N and 15N the results for maximum shear stress at crack tip can be obtained. Now CTOD can be calculated by the formula
t = 4K12/ys (10) where ys = 45 MPa So, CTOD at different loads can be given as
TABLE 3 CTOD VALUES
Load (N) CTOD (mm)
15 0.0629 20 0.1071 25 0.175 35 0.439
V. DISCUSSION AND COMPARISON OF RESULTS A. Comparison of Results in LEFM
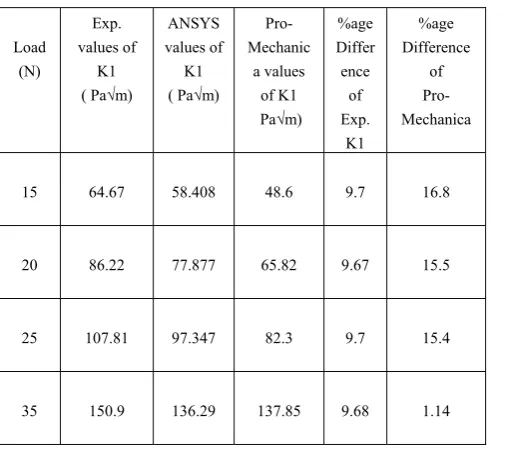
The experimental and simulation results (ANSYS & Pro-Engineer) are compared to get the idea of values of stress intensity factor (K1) for central crack in our specimen of PSM 4 sheet at different loading. ANSYS results are taken as reference for comparison with other two sources of results.
TABLE 4
COMPARISON OF RESULTS WITH DIFFERENCE BY TAKING ANSYS RESULTS AS REFERENCE
B. Comparison of Results of LEFM & EPFM in Pro-Mechanica
For comparison of results of LEFM and EPFM the relationship of ‘CTOD’ with ‘K’ is used for plane strain case as given by equation (6). The obtained results can be compared as shown in Table 5
TABLE 5
COMPARISONS OF LEFM AND EPFM RESULTS
Load (N)
K in LEFM ( Pa√m)
K in EPFM ( Pa√m)
%age Difference 15 48.6 47.15 2.12 20 65.82 61.52 6.53 25 82.3 78.54 4.57
35 137.85 124.6 9.61
VI. CONCLUSIONS
Central crack propagation behavior can be well judged by Photoelasticity experiments and analysis of stresses at crack tip in commercial FEM codes like ANSYS and Pro-Engineer with appropriate difference. The nature of the material creates an interesting crack growth phenomenon. When a crack is created in the PSM4 sheet under some load, blunting is experienced at the crack tip. After the blunting has reached a maximum level, the crack then begins to grow in considered specimen. So the experiment on centrally cracked specimen of Photoelastic material (PSM-4) is useful for understanding of crack growth in solid propellant and other applications of polyurethane material in LEFM and EPFM. Table 5 helps in defining correction factor at a range of considered loads separately in terms of percentage difference. It clearly shows that considering the non linear phenomenon with CTOD characteristics results in a decrease of the value of stress intensity for each loading in opening mode.
REFERENCES
[1] M. Janssen, J. Zuidema and R. J. H. Wanhill, Fracture Mechanics, Second edition, Spon Press, Oxfordshire, 2004
[2] C. -Y. Hui, A. Jagota, S. J. Bennison, J. D. Londono., “Crack Blunting and the Strength of Soft Elastic Solids” Proceedings: Mathematical, Physical and Engineering Sciences, Vol. 459, No. 2034, 2003, pp. 1489-1516
[3] Dally, J. W. and Riley, W. F., Experimental Stress Analysis, McGraw-Hill Book Company, New York, 1991.
[4] James F. Doyle and James W. Phillips, Manual on experimental
Stress Analysis, Fifth Edition, Society for Experimental Mechanics
[5] Kevin T. Gloss, A Photoelastic Investigation into the Effects of Cracks and Boundary Conditions on Stress Intensity Factors in
Bonded Specimens, M Sc Thesis, Virginia Polytechnic Institute and
State University, USA; May 2000
[6] Newman JC Jr, Armen H Jr. “Elastic plastic analysis of a propagating crack under cyclic loading”, AIAA Journal Vol. 13, 1975; pp.1017-1023.
[7] Ohji K, Ogura K, Ohkubo Y. “Cyclic analysis of a propagating crack and its correlation with fatigue crack growth”. Eng. Fract. Mech. Journal Vol. 7. 1975;pp. 457-464
[8] W., Elber “The significance of fatigue crack closure”, ASTM STP 486, 1971: pp. 230-242
[9] Blom AF, Holm DK. “An experimental and numerical study of crack closure”. Eng. Fract. Mech. Journal Vol. 22, 1985: pp. 997-1011. [10] Fleck NA. “Finite-element analysis of plasticity induced crack closure
under plane strain conditions”. Eng. Fract. Mech. Vol.25 Journal 1986: pp. 441-449
[11] Fleck NA, Newman JC Jr. “Analysis of crack closure under plane strain conditions”. ASTM STP 982, 1988: pp.319-341.
[12] Wu J, Ellyin F. A study of fatigue crack closure by elastic–plastic finite element analysis for constant-amplitude loading. Int J Fract, Vol. ,82, 1996, pp.43–65
[13] L. C. H. Ricardo “Crack Propagation In Plane Strain Under Variable Amplitude Loading” Iberian Conference on Fracture and Structural Integrity, Portugal, 2010. pp. 441-446
[14] A. Saxena, J. D. Landes, J. L. Bassani , Nonlinear Fracture
Mechanics Vol.2, ASTM, 1988.
[15] Kumar, Kumar Prashant Elements Of Fracture Mechanics, Tata McGraw-Hill Publishing Company Limited 2009.
[16] Wells, A.A., “Unstable Crack Propagation in Metals - Cleavage and
Fast Fracture”,Cranfield Crack Propagation Symposium, Vol.1,1961, p. 210,
[17] David Broek., Elementary Engineering Fracture Mechanics Second
Edition, Springer,1986
[18] Erwin Kreyszig, Advanced Engineering Mathematics, Ninth Edition
JOHN WILEY AND SONS INC.,2006.
[19] Dr. A.-V. Phan, ANSYS TUTORIAL – 2-D Fracture Analysis ANSYS
Release 7.0,University of South Alabama
Load (N)
Exp. values of
K1 ( Pa√m)
ANSYS values of K1 ( Pa√m)
Pro-Mechanic
a values of K1 Pa√m)
%age Differ
ence of Exp.
K1
%age Difference
of Pro-Mechanica
15 64.67 58.408 48.6 9.7 16.8
20 86.22 77.877 65.82 9.67 15.5
25 107.81 97.347 82.3 9.7 15.4