Abstract. —The aim of this paper is to examine factors affecting the adoption of ICT for the teaching of word problems. This aim is achieved within the theoretical framework of the Technology Acceptance Model (TAM) by the quantitative analysis of data collected from a questionnaire based survey of 102 foundation phase teachers (grades 2, 3, & 4). These teachers were selected from 36 schools from the Kwa-Zulu Natal province of South Africa. According to the statistical and descriptive analysis of the survey data, teachers’ awareness of ICT, their attitude towards ICT, their perceptions on the usefulness and on the ease-of-use of ICT are moderate; but their level of adoption of ICT for the teaching of word problems is generally low. The inferential statistical analysis of these variables also shows that all the above listed factors significantly influence the adoption of ICT for the teaching of word problems. In addition, this research found that among the teachers that are aware of the general importance of ICT in teaching, there are higher levels of ICT adoption for the teaching of word problems in urban areas compared to rural areas. The novelty of this study can mainly be credited to its focus on the teaching of word problems compared to existing literature usually concerned with ICT adoption factors either for the teaching of mathematics in general, or for general teaching.
Index Terms—ICT Adoption, Mathematics Teaching and Learning, Technology Acceptance Model, Word Problems
I. INTRODUCTION
here is enough evidence from existing literature that “teachers are slow to recognize the benefits of new technologies” (Edyburn, 2000 in Zahari, 2005). This pushes Forgave (2002) in Zahari (2005) to state that the learning opportunities provided by the increasing use of technology in classrooms are not being exploited by schools generally and in particular for remedial programs. Polly et al (2010) further stresses that, even in the limited occasions that technology is being used, it is still not being used effectively by teachers and therefore it does not impact on learners’ performance (Polly et al, 2010). This is a serious concern especially for difficult subjects such as mathematics where learners’ performance is usually low. For lower grades in primary education, word problems are a major part of the mathematics curriculum and they are used for the
K. M. Cassim is with the Durban University of Technology, Department of Information Technology, 41-43 Centenary Road, P.O. Box 1334, Durban, 4001, South Africa, phone: 031-373-5339; fax: 031-373-5543; e-mail: [email protected].
S. D. Eyono Obono is with the Durban University of Technology, Department of Information Technology, 41-43 Centenary Road, P.O. Box 1334, Durban, 4001, South Africa, phone: 5692; fax: 031-373-5543; e-mail: [email protected].
enhancement of learners’ analytical and arithmetic skills (Greer, 1997; Hergaty et al, 1995). Still, they are one of the areas in which learners’ experience serious difficulties as it requires both literacy and numeracy skills. Therefore it is important to lessen learners’ difficulties in the learning of word problems, by trying to understand why existing ICT based strategies so far proposed to assist in the teaching of word problems, are not being massively adopted by teachers. These strategies include: remedial work (Zahari, 2005), group work (Zahari, 2005), and personalization (Balta et al, 2009; Ku, n. d). The aim of this research is therefore to examine factors affecting the adoption of ICT for the teaching of word problems.
II. THEORETICAL FRAMEWORK
This research is grounded within the theoretical framework of the technology acceptance model (TAM) designed by Davis (1989) on the factors that influence users’ adoption of technology in general. According to Davis (1989), users’ acceptance of a given technology is affected by their perceptions on the usefulness and ease-of-use of that technology. TAM was initially designed by Davis (1989) for Information Technology systems within the context of organizational job performance. In this context, perceived usefulness was defined by Davis (1989) as “the degree to which a person believes that using a particular system would enhance his or her job performance” (Davis, 1989) and perceived ease-of-use of a system was also defined by Davis (1989) as “the degree to which a person believes that using a particular system would be free of effort” (Davis, 1989). In this paper, TAM will guide the examination of factors affecting the adoption of Information and Communication Technologies (ICT) for the teaching of word problems both for administrative duties and for curriculum delivery.
III. LITERATURE OVERVIEW
According to Kumar et al (2008), “there is a need to examine the factors affecting teachers’ computer use and its implications to teachers’ professional development strategies”; and this is amplified by existing research on the factors influencing ICT adoption by teachers. This literature is summarized in this section in addition to literature specific to the adoption of ICT for the teaching of mathematics because word problems form part of the mathematics curriculum. ICT adoption factors presented in this section include attitude and motivation (Sang et al, 2009; Zhao & Cziko, 2001), demographics (Kumar et al, 2008), training
On the Factors Affecting the Adoption of ICT
for the Teaching of Word Problems
K. M. Cassim, S. D. Eyono Obono
and skills (Richardson, 2009), confidence (Chrysostomou and Mousoulides, 2009), technical support (Keong et al, 2005), and peer influences (Crisan, 2004).
Attitude and Motivation
According to Sang et al (2009) and Zhao & Cziko (2001), teachers’ educational beliefs impact on their use of ICT. This was the result of a quantitative survey conducted by Sang et al (2009) on 873 primary school teachers from 11 Chinese provinces and municipalities, and of a literature survey by Zhao & Cziko (2001). The same study by Sang et al (2009) which also identifies attitude and motivation as factors influencing the adoption of ICT is supported by the results of a study conducted by Kumar et al (2008) as described in the next section.
Demographics
Kumar et al (2008) conducted a survey of Mathematics, Science and English (MSE) teachers from 65 Malaysian secondary schools. A multiple regression statistical procedure was then used to model socio-demographic factors against AUC and technology acceptance constructs. It was found that, in addition to the attitude and motivation factor already mentioned above, gender; age and computer training have an effect on the Actual Usage of Computers (AUC) by teachers. The next section presents other research papers on the impact of training on the adoption of ICT by teachers.
Training and Skills
Results from the survey of 360 teachers from an ICT training project in Cambodia indicate that most teachers make use of their acquired ICT skills in some way after training, and some teachers actually re-invent the way to use their acquired skills. However, according to the results of the same study, the integration of ICT in teaching is still difficult for some teachers and these teachers require more training and practice (Richardson, 2009). This need for more training and practice is also supported by Jones (2004), Hennessy et al (2005) and Keong et al (2005). These papers are further described in the following sections except for Hennessy et al (2005) hereby presented. Hennessy et al (2005) interviewed 18 focus groups of English, Mathematics and Science teachers from 6 secondary schools around Cambridge in the United Kingdom.
Confidence
A questionnaire based survey of 74 elementary school mathematics teachers from 9 elementary schools in Cyprus by Chrysostomou and Mousoulides (2009) found that teachers’ confidence affects their adoption of ICT for teaching. A similar result was obtained by a questionnaire based survey of 170 teachers and practitioners conducted by Jones (2004) to complement the findings of his literature review.
Technical Support
A survey of 111 mathematics in-service teacher trainees in Malaysia found that lack of technical support is a barrier to the successful integration of ICT in teaching (Keong et al, 2005). This finding is also supported by Jones (2004).
Peer Influences
A case study in which seven secondary school mathematics teachers were observed and interviewed by Crisan (2004) found that the use of ICT by teachers is influenced by the sharing of teaching and learning experiences among colleagues.
Other Factors
Other factors found by existing research as affecting the adoption of ICT for the teaching of mathematics include: teachers perceptions on how mathematics should be taught (Crisan, 2004), teachers perceptions on the value of historical education practices (Crisan, 2004), a lack of time for ICT adoption (Jones, 2004; Keong et al, 2005), a lack of resources (Jones, 2004; Hennessy et al, 2005; Keong et al, 2005), teachers age (Jones, 2004), and teachers perceptions on the effectiveness and usefulness of ICT (Chrysostomou and Mousoulides, 2009).
IV. RESEARCH DESIGN
A questionnaire based survey was used to gather data on teachers’ perceptions on the factors that affect their adoption of ICT for the teaching of word problems. These teachers were selected from a sample of primary schools in the Kwa-Zulu Natal (KZN) province of South Africa. Even though the Republic of South Africa has nine provinces, only one province was surveyed by this research mainly due to time and cost restraints. However, the choice of the KZN province has the benefit of representing a large part of South Africa both in terms of surface area and in terms of population. The KZN province has approximately 3839 primary schools, and 36 schools were randomly selected from the list of KZN primary schools provided by the provincial Department of Education. For each of the selected schools, only teachers of grades 2, 3, & 4 were requested to participate in this survey based on the understanding that word problems are first introduced to learners during this foundation phase of education. One teacher was selected for each grade by their principals’ according to their availability and in all instances, school principals and teachers willingly participated in the survey. The filling of the survey questionnaire by teachers never took place during “contact time”, but it was done either during tea or lunch breaks or after school. The final sample of the survey consisted of 102 teachers from the 36 schools as a result of the existence of “combined classes” in certain schools. These teachers were requested to fill a questionnaire designed for the purpose of gathering data on teachers’ perceptions on the factors affecting their adoption of ICT for the teaching of word problems.
A. Research Variables
The following research variables were examined by this study: teachers’ demographics, their general attitudes towards ICT in teaching, their ICT awareness opportunities for the use of ICT in teaching, their perceptions on the usefulness and ease of use of ICT for teaching, and their level of ICT adoption for the teaching of word problems.
Teachers’ demographics consisted of four nominal items namely gender, ethnicity, grades taught and school location, and six ordinal items namely age, highest qualification, teaching experience, computer access, internet access, and school type. Teachers’ attitude was measured by 5-point Likert-scale items on issues such as teachers fear to use technologies in their teaching, and the distraction that learners experience through their use of ICT, etc. The ICT awareness variable was also measured by 5-point Likert-scale items on teachers’ exposure to ICT awareness opportunities offered by the Department of Education, workshops, and discussions with colleagues, etc. Similarly, 5-point Likert-scale items were used to measure teachers’
perceptions on the usefulness and ease-of-use of ICT tools such as word processors, spread sheets, and photo-copying machines, etc. Lastly, the dependent variable, the perceived adoption of ICT, also used 5-point Likert-scale items to measure teachers’ adoption of ICT tools such as the Internet, online games, databases, etc., for the teaching of word problems.
B. Data Analysis
Data collected from the questionnaire was analysed using the SPSS software package within a quantitative research approach. First, data was tested for reliability and validity. Thereafter, demographic attributes as well as all the reliable and valid Likert-scale based research variables were analysed using descriptive statistics (frequencies and means). The following inferential statistical tests were also used to test the correlations on one hand between Likert-scale based research variables, or between these variables and the demographic attributes: Pearson’s correlation, multiple linear regressions, ANOVA, and ANCOVA. Pearson’s correlation tests were conducted with a confidence level of 99% and all other tests were performed with a confidence level of 95% unless otherwise specified.
V. RESEARCH RESULTS
This section presents the results of the reliability and validity tests performed on the data of this survey. It also presents this survey’s descriptive and inferential statistical tests results.
A. Data Reliability and Validity
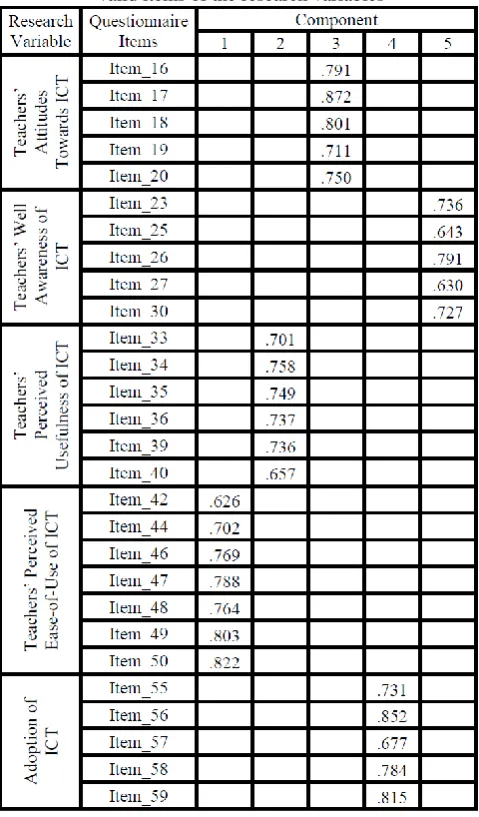
Table 1 shows that the data collected by this questionnaire based survey is reliable (all Likert-scale based research variables have a Cronbach’s alpha (a) value of > 0.800). Table 2 also shows that this data is valid (the research variables items split nicely into five separate components). One can also see from these two tables that only few questionnaire items did not pass the reliability and validity tests, in support of the quality of the initial design of this
[image:3.595.301.550.109.204.2]survey’s questionnaire, and of the soundness of its implementation.
Table 1: Reliability Table for the research variables
[image:3.595.303.543.282.691.2]According to Field (2005:254), reliability coefficients less than 0.700 are poor, between 0.700 and 0.799 are acceptable, and above 0.800 are good.
Table 2: Factor Analysis Rotated Component Matrix for the valid items of the research variables
B. Descriptive Statistics
1. Demographics
Descriptive statistics on the demographic data collected by this research indicate that: The typical teacher surveyed by this research is an African (71.6%) middle aged (50%) female (90.2%) with a diploma (52.9%) and with a substantial teaching experience (52%); almost all schools surveyed are public schools (98%) evenly geographically distributed between urban areas (49%) and rural areas (51%); approximately half of the teachers have no computer and Internet access (44.1% and 57.8% respectively) and the remainder of teachers are evenly distributed between either having access at home only (both 20.6%) or at both school and home (28.4% and 13.7% respectively).
2. Teachers Attitudes, Teachers Awareness, Perceived Usefulness, Perceived Ease-of-Use, and The Adoption of ICT
[image:4.595.302.548.71.223.2]Research results presented by Table 3 indicate the moderate nature of the perceptions of the surveyed teachers on the usefulness of ICT (mean of 21.5098 out of 36.00), on the ease-of-use of ICT (mean of 24.2255 out of 42.00), their attitudes towards ICT (mean of 14.7157 out of 29.00), and their awareness of ICT (mean of 16.8529 out of 30.00). However, Table 3 also shows that teachers’ perceptions on their adoption of ICT (mean of 11.9314 out of 30.00) is slightly lower than moderate. In addition, variances for the above mentioned research variables are relatively high, showing that teachers’ perceptions on these issues are in general on the extremes (either extremely positive or extremely negative).
Table 3: Descriptive statistics for Likert-scale based research variables
C. Inferential Statistics
Statistical tests were performed in this study to assess whether the positive adoption of ICT for the teaching of word problems was affected by any of the independent research variables. The results of these tests are presented in this section.
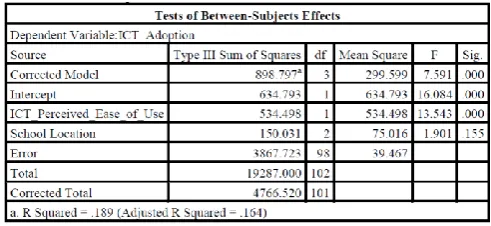
Table 4 indicates that the following demographic factors significantly (p < 0.05) affect teachers’ perceived adoption of ICT for the teaching of word problems: teaching experience (p = 0.018), computer access (p = 0.000), internet access (p = 0.009), and school location (p = 0.020). However, from these demographic factors, only school location satisfied the ANOVA assumptions (normality and homogeneity of variances tests).
[image:4.595.300.547.265.518.2]Table 4: ANOVA results
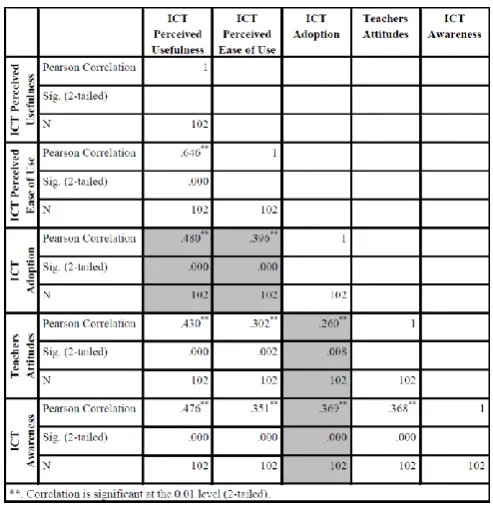
[image:4.595.45.292.497.582.2]Table 5: Pearson’s correlation analysis of the research variables
Table 6: ANCOVA for the teachers’ attitudes covariant and school location fixed factor
[image:4.595.301.546.566.695.2]perceived usefulness of ICT (p = 0.000), and teachers’ perceived ease-of-use of ICT (p = 0.000).
Table 4 shows that only the school location demographic factor passed the ANOVA test of normality and of homogeneity of variance. Therefore, ANCOVA was only performed on this demographic factor against each of the Likert-scale based research variables of this study.
Table 7: ANCOVA for the perceived usefulness covariant and school location fixed factor
Table 8: ANCOVA for the perceived ease-of-use covariant and school location fixed factor
Table 9: ANCOVA for the ICT awareness covariant and school location fixed factor
Results of the ANCOVA tests from Table 6 indicate that when combined, school location and teachers’ attitudes both became non-significant in influencing the adoption of ICT for the teaching of word problems. However, according to the results of Table 7, when combining school location with teachers’ perceived usefulness, only the ICT perceived usefulness factor still influences the perceived adoption of ICT. Similarly, Table 8 shows that for the combination of school location and teachers’ perceived ease-of-use, only the ICT perceived ease-of-use factor still influences the adoption of ICT. Lastly, Table 9 also indicates that, when combining
school location and ICT awareness, only the ICT awareness factor still influences the perceived adoption ICT.
Table 10: Contrast results of school location when school location is combined with ICT awareness
Table 11: Estimates table for the combination of school location and ICT awareness
The analysis of contrast tables from the above mentioned ANCOVA tests show that only Table 9 has a significant contrast (out of the four combinations of variables represented by Table 6, Table 7, Table 8, and Table 9). Table 9 considers the possible combination of school location and ICT awareness as factors influencing the perceived adoption of ICT; and contrast results for school location in Table 10 suggest that ICT adoption levels in urban areas significantly differ from ICT adoption levels in rural areas when ICT awareness is taken into account. These levels differences are further confirmed by the ‘mean values’ from Table 11 which also show that there are significantly higher levels of ICT adoption in urban areas than rural areas. It is worth mentioning that all the above ANCOVA tests passed the Levene’s test and satisfied the assumption of homogeneity of regression slopes.
VI. DISCUSSION
[image:5.595.290.544.120.300.2] [image:5.595.47.296.190.306.2] [image:5.595.299.545.348.434.2] [image:5.595.45.291.351.464.2] [image:5.595.46.293.510.636.2]grounding within a well-established theoretical framework, the Technology Acceptance Model (TAM) framework (Davis, 1989). However, the research method of this study, a questionnaire based survey, is similar to other studies from the existing literature on ICT adoption for teaching (Keong et al, 2005; Kumar et al, 2008; Sang et al, 2008; Richardson, 2009; Chrysostomou and Mousoulides, 2009).
The results of this research on the low levels of ICT adoption for the teaching of word problems also complement existing literature which indicate low levels of ICT adoption for teaching in general (Zhao & Cziko, 2001; Zahari, 2005; Sang et al, 2008; Richardson, 2009) and for mathematics in particular (Crisan, 2004; Kumar et al, 2008; Chrysostomou and Mousoulides, 2009). Furthermore, three (teachers’ attitudes, teachers’ perception on the usefulness and ease-of-use of ICT) of the four Likert-scale based factors found to affect the adoption of ICT for the teaching of word problems can be seen as a confirmation of similar existing results on the adoption of ICT for teaching in general and for mathematics (Crisan, 2004; Kumar et al, 2008; Chrysostomou and Mousoulides, 2009). This study also adds value to the body of knowledge by presenting evidence on teachers ICT awareness and school location as new factors which affect the adoption of ICT for the teaching of word problems.
VII. CONCLUSION
This paper shows that, teachers’ demographic profiles, their positive attitudes, their awareness of successful and effective ICT integration in teaching, and their positive perceptions on the usefulness and ease-of-use of ICT, contribute to higher levels of ICT adoption for the teaching of word problems. These results have possible implications for the general acceptance of ICTs by teachers for the design of relevant intervention strategies towards the improvement of learners’ academic progression. These results can also be used in the definition of requirements for the design of computer assistive software for the teaching of word problems. The need for the continuous training of teachers on the effective use of new technologies is also reinforced by the results of this study.
Ideas for future research on the results of this paper include: further analysis of the survey data, software personalization for teaching of word problems, and learners adoption of ICT for mathematics in general and for word problems in specific.
APPENDIX The Questionnaire
Section A - Demographics
1.Gender (Male, Female)
2.Ethnicity (African, Indian, Colored, White)
3.Age (<=29 years, 30-39 years, 40-49 years, 50-59 years, >=60 years)
4.Highest Qualification (Matric, Diploma, Bachelor’s degree, Honors degree, Master’s degree, PhD) 5.Teaching Experience (1 to 5 years, 6 to 10 years, 11 to
15 years, 16 to 20 years, 21 years and above)
6.Computer Access (None, Home only, School only, Home and School, Other)
7.Internet Access (None, Home only, School only, Home and School, Other)
8.Grade(s) Taught (2, 3, 4)
9.School Location (Urban area, Rural area, Township) 10. School Type (Public, Private, Semi-private, Other)
Section B – Teachers Attitudes
11. To me teaching is normally about books, pens, pencils, chalk and the blackboard.
12. I find that computers cannot cater for most of the emotional aspects of teaching and learning.
13. Computers and technologies are quite scary and frustrating to me because I have limited or no understanding of them.
14. Computers are a luxury for most of my learners considering their poor social background.
15. I prefer to get other people to do computer related tasks for me than do it myself (e.g. my wife/husband/children types out my exam papers using a word processor).
16. Most of my learners spend too much time playing computer games and using mxit, Facebook, twitter, etc. rather than doing their work.
17. Most of my learners get their eyesight damaged by computer screens.
18. Computers and technologies usually make my learners lose interest in reading and writing with a negative effect on their spelling, speech and handwriting.
19. Computers usually provide my learners with opportunities to cheat and plagiarize using cut & paste.
20. The World Wide Web, mxit, Facebook, and twitter, etc. usually allows my learners easy access to a whole lot of adult content, online dating, etc.
Section C – Teachers Awareness
21. I regularly receive the Department of Education software packages to manage registers, work schedules, and year-end mark schedules, etc.
22. Most of the new textbooks provided to me have their solutions and teaching resources on the World Wide Web.
23. I regularly attend workshops that promote computer technologies for teaching purposes.
24. Most of my learners recommend computer technologies that they have used at home.
25. My principal regularly makes announcements during staff meetings about the opportunities provided by ICT for teaching purposes.
26. I usually come across success stories on the use of ICT for teaching in general, on staff notice boards, newsletters, and the media (e.g. Newspapers, television).
27. I often have discussions with colleagues on the use of ICT for certain aspects of teaching.
as a topic.
29. Parents of learners regularly inform me about computer technologies that are usually successful in assisting their children at home.
30. Youngsters from my family regularly have discussions with me on computer technologies that their teachers usually use at school.
Section D – Perceived Usefulness
31. The general use of ICT for teaching usually reduces learners' boredom as it makes my lessons more interesting.
32. The general use of ICT for teaching usually improves my learners' performances.
33. PowerPoint, projectors and animations are usually valuable to me for the designing of exciting visual aids for learners.
34. Word processors usually help me to set tests and exams question papers.
35. Spreadsheets are usually helpful to me for the analysis of learners' performances.
36. The World Wide Web usually offers me a wider range of interesting teaching resources (e.g. textbooks, notes, worksheets, games, quizzes, and puzzles).
37. SMSs, emailing, blogs, and forums, etc., usually allow me to interact with other teachers after working hours (e.g. the sharing of spontaneous teaching ideas).
38. Photo-copy machines usually save me effort in the production of class notes for my learners.
39. E-learning websites such as web-city usually allow me to introduce my learners to new learning strategies.
40. Databases usually allow me to keep a proper record of teaching materials and other information such as marks, registers, disciplinary records, etc. (e.g. The 2011 system that would allow for easy access to learners' disciplinary records).
Section E – Perceived Ease of Use
How easy is it for you to execute the following ICT related tasks?
41. Sending emails & SMSs to share teaching ideas and teaching resources with other teachers.
42. Using Google to search for textbooks, lesson notes, and worksheets, etc., and download them.
43. Using a photo-copying machine (handle the keypad, paper-jams, paper-feed, and other errors with the machine) to make copies of teaching materials. 44. Using a spreadsheet application (e.g. Microsoft
Excel, Open Office Calc) to create registers and mark sheets.
45. Using a word processor application (e.g. Microsoft Word, Open Office Writer) for tests, exams, and lessons notes.
46. Creating formulas to analyze learners' marks from databases.
47. Delivering PowerPoint lessons presentations to a
class.
48. Interacting with E-learning systems such as web-city. 49. Uploading files to email.
50. Setting up an Internet connection for instant Internet access from a cellphone.
Section F – Teachers Adoption of ICT
51. I often keep a computer database of word problems examples and exercises on a personal computer. 52. I regularly use the Internet (e.g. Google) to search
and download word problems videos, notes and practice examples to use in my lessons.
53. I regularly use online games to make my word problems lessons exciting.
54. I regularly communicate with other teachers via SMSs, emails, blogs and forums to seek teaching advice, share ideas, give & receive teaching materials, etc. with regards to word problems. 55. I often use presentation applications (e.g. Microsoft
PowerPoint, Open Office Impress) to design colorful slide shows for delivering word problems lessons. 56. I regularly use personalization software to generate
individualized word problems exercises for learners. 57. I often send SMSs and emails to the parents of my
learners to give them feedback of their children's progress with word problems classwork and homework.
58. I regularly use spreadsheet applications (e.g. Microsoft Excel, Open Office Calc) to capture learners' marks and to analyze their strengths and weaknesses in word problems.
59. I regularly use word processors (e.g. Microsoft Word, Open Office Writer) for word problems test materials and class notes.
60. I regularly use a photo-copying machine for word problems worksheets, exercises and class notes.
REFERENCES
[1] Balta, O.C., Simsek, N., and Tezcan, N. 2009. A Web Based Generation System for Personalization of E-Learning Materials. World Academy of Science, Engineering and Technology 49, pp. 419-422.
[2] Chrysostomou, M. and Mousoulides, N. 2009. Teachers’ Beliefs about the Adoption of New Technologies in the Mathematics Curriculum. Proceedings of CERME 6, pp. 1270-1279.
[3] Crisan, C. 2004. Mathematics Teachers’ Learning About and Incorporation of ICT into Classroom Practices. Proceedings of the British Society for Research into Learning Mathematics. 24(2), pp. 15-20.
[4] Davis, F.D. 1989. Perceived Usefulness, Perceived Ease of Use, and User Acceptance of Information Technology. MIS Quarterly, 13(3), pp. 319-340.
[5] Field, A. 2005. Discovering Statistics Using SPSS (Introducing Statistical Methods). 2nd Edition, Sage Publications Inc. CA. ISBN 978-1-84787-906-6.
[6] Greer, B. 1997. Modelling Reality in Mathematics Classrooms: The Case of Word Problems. Learning and Instruction, 7(4), pp. 293-307. [7] Hegarty, M., Mayer, R.E., Monk, C.A. 1995. Comprehension of Arithmetic Word Problems: A Comparison of Successful and Unsuccessful Problem Solvers. Journal of Educational Psychology, 87(1), pp. 18-32.
[9] Jones, A. 2004. A Review of the Research Literature on Barriers to the Uptake of ICT by Teachers. UK: Becta.
[10] Keong, C.C, Horani, S. and Daniel J. 2005. A Study on the Use of ICT in Mathematics Teaching. Malaysian Online Journal of Instructional Technology. 2(3), pp. 43-51.
[11] Krishnakumar, P. Geeta, M.G., and Palat, R. 2006. Effectiveness for Individualized Education Program for Slow Learners. Indian Journal of Pediatrics. 73, pp. 135-137
[12] Ku, H. and Sullivan, H. J. 2002. Student Performance and Attitudes Using Personalized Mathematics Instruction. ETR&D. 50(1), pp. 21-34.
[13] Kumar, N., Rose, R.C. and D’SIiva, J.L. 2008. Predictors of Technology Deployment among Malaysian Teachers. American Journal of Applied Sciences. 5(9), pp. 1127-1134.
[14] Kumar, N., Rose, R.C. and D’SIiva, J.L. 2008. Teachers’ Readiness to Use Technology in the Classroom: An Empirical Study. European Journal of Scientific Research. 21(4), pp. 603-616.
[15] Ling, Q.M. n. d. Teaching Slow-Learning Children. Teaching and Learning, 1(2), pp. 60-69.
[16] Polly, D., Mims, C., Shepherd, C.E., Inan, F. 2010. Evidence of impact: Transforming teacher education with preparing tomorrow’s teachers to teach with technology (PT3) grants. 26, pp. 863-870. [17] Richardson, J. W., 2009. Providing ICT Skills to Teacher Trainers in
Cambodia: Summary of Project Outputs and Achievements. Journal of Education for International Development. 4(2), pp. 1-12.
[18] Sang, G., Valcke, M., Van Braak, J. and Tondeur, J. 2009. Factors support or prevent teachers from integrating ICT into classroom teaching: A Chinese perspective. Proceedings of the 17th International Conference on Computers in Education. Hong Kong: Asia-Pacific Society for Computers in Education.], pp. 808-815. [19] van Wyk, G., and Louw, A. 2008. Technology-Assisted Reading for
Improving Reading Skills for young South African Learners. The Electronic Journal of e-Learning. 6(3), pp. 245-254.
[20] Zahari, Z. 2005, Enhancing Remedial Learners Reading through eLearning. Proceedings of the Second International Conference 2005: eLearning for Knowledge-Based Society, 4-7 August. Bangkok, Thailand, pp. 20.1 – 20.7