Abstract— This paper proposes a new technique using
discrete wavelet transform (DWT) and support vector machines (SVM) to classify the fault types on transmission systems. The DWT is used to detect the high frequency components from fault signals. Positive sequence current signals are used in fault detection decision algorithm. The variations of first scale high frequency component that detects fault are used as an input for the SVM. Various cases studies based on Thailand electricity transmission systems have been investigated so that the algorithm can be implemented. SVM is also compared with the comparison of the coefficients DWT technique as well as back-propagation neural network algorithm. The proposed method gives satisfactory accuracy, and will be very useful in the development of a modern protection scheme for electrical power transmission systems.
Index Terms—Wavelet Transform, Fault Classification,
Transmission Line, Support Vector Machines
I. INTRODUCTION
Protecting transmission line is an important task to safeguard electric power system. The precision protection scheme is necessary to be detected, classified and located accurately, and cleared as soon as possible. The development in power system protection technology has been progressed, especially in recent years. In several research papers, the fault classification can be obtained by employing trial and error method [1-5]. In previous research works [3], by considering the pattern of the spectra, the comparison of the coefficients from first scale that can detect fault is considered. The division algorithm between the maximum coefficients of DWT at ¼ cycle of phase A, B, C is performed. For identifying the phase with fault appearance, the comparisons of the maximum ratio obtained from division algorithm have been performed so that the types of fault can be analysed. Although the wavelet transform is very effective in detecting transient signals generated by the faults, but the wavelet transform may not be adequate to complete characterization. In addition, artificial intelligence (AI) has been reported in the literature for fault classification [6-11]. In several research papers, the back-propagation neural network (BPNN) [8] is employed as well as Probabilistic neural
Manuscript received January 8, 2012.
K. Kunadumrongrath and A. Ngaopitakkul are with Department of Electrical Engineering, Faculty of Engineering, King Mongkut’s Institute of Technology Ladkrabang, Bangkok 10520, Thailand (e-mail:
network in order to identify types of fault on the transmission line. Even if artificial neural network algorithm can give precise results for fault types, it is partly limited by the slow training performance. This drawback of artificial neural networks should be improved, otherwise the other types of artificial intelligence should be developed instead. It is interesting to investigate an appropriate support vector machines if the fault types on the transmission line can be identified using wavelet transform and support vector machines for being included in newly-developed protection systems.
Therefore, this paper presents a development of a new decision algorithm used in the protective relays in order to classify types of fault along the transmission systems. The fault conditions are simulated using ATP/EMTP. The current waveforms obtained from the simulation, then, are extracted using the DWT. The validity of the proposed algorithm is tested with various fault inception angles, fault locations and faulty phases. In addition, the construction of the decision algorithm is detailed and implemented with various case studies based on Thailand electricity transmission systems. Moreover, the results from the proposed algorithm are compared with those from the trial-error [3] and the BPNN [8] in order to show the advantage of the proposed method.
II. POWER SYSTEM SIMULATION USING EMTP The ATP/EMTP is used to simulate fault signals at a sampling rate of 200 kHz. The fault types are chosen based on the Thailand’s transmission system as shown in Figure 1. Fault patterns in the simulations are performed with various changes in system parameters as follows:
- Fault types considered in this study are : single line to ground (SLG : AG, BG, CG), double-line to ground (DLG : ABG, BCG, CAG), line to line (L-L : AB, BC, CA) and three-phase fault (3-P : ABC).
- Fault locations are varied from 10% to 90%, with the increase of 10% of the transmission line length measured from the bus MM3.
- Inception angle on a voltage waveform is varied between 0°-330°, with the increasing step of 30°. Phase A is used as a reference.
- Fault resistance is equal to 10 Ω.
Discrete Wavelet Transform and Support Vector
Machines Algorithm for Classification of Fault
Types on Transmission Line
Fig. 1 The system used in simulation studies [12].
The example of simulated fault signals by ATP/EMTP is illustrated in Figure 2. This is a fault occurring in phase A to ground at 30% of transmission line length measured from the bus MM3 as depicted in Figure 1. The fault signals generated using ATP/EMTP are interfaced to MATLAB for the fault detection algorithm.
Fig. 2 Example of simulated fault signals by ATP/EMTP for AG fault at sending end.
The Clark’s transformation matrix is employed for calculating the positive sequence and zero sequence of currents. With several trial and error processes, the fault detection decision algorithm on the basis of computer programming technique is constructed as shown in Fig. 3.
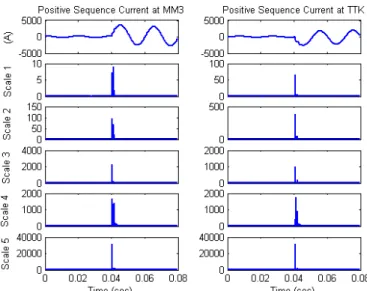
Fig. 3. Wavelet transform from scale 1 to 5 for the positive sequence of current signal shown in Fig. 2.
-500 0
500 Positive Sequence Current at MM3
(A
)
-500 0
500 Positive Sequence Current at TTK
0 0.0001
S
cal
e 1
0 0.002
0 0.0001
S
cal
e 2
0 0.0005 0.001
0 0.0005
S
cal
e 3
0 0.0005 0.001
0 0.005
S
cal
e 4
0 0.005 0.01
0 0.05 0.1
0 0.05
Time (sec)
Sc
al
e 5
0 0.05 0.1
0 0.05 0.1
Time (sec)
Fig. 4. Wavelet transform from scale 1 to 5 for the positive sequence of current signal in normal condition.
The mother wavelet daubechies4 (db4) [3, 8, 13] is employed to decompose high frequency components from the positive sequence current signals. Fault detection decision algorithm [3, 8] is proceeded using positive sequence current signal. Coefficients obtained using DWT of signals are squared so that the abrupt change in the spectra can be clearly found, and it is clearly seen that the coefficients of high frequency components, when fault occurs, have a sudden change compared with those before an occurrence of the faults as shown in Fig. 3. The fault detection decision algorithm has been proposed that if coefficients of any scales are change around five times before an occurrence of the faults, there are faults occurring on transmission lines.
From Fig. 4., the coefficient in each scale of the wavelet transform does not clearly change then it presumes that these signals are in normal operating condition. By performing many simulations, it has been found that the coefficient in scale 1 from DWT seems enough to indicate the fault inception on the single circuit transmission line. As a result, it is unnecessary to use other coefficients from higher scales in this algorithm, and the coefficients in scale 1 from DWT are used in training processes for the neural networks later.
III. DECISION ALGORITHM AND RESULT
From the simulated signals, DWT is applied to the quarter cycle of voltage and current waveforms after the fault inception. The coefficients of scale 1 obtained using the DWT are used for SVM. The basic idea of SVM is to map the training data from the input space into a higher dimensional feature space via kernel function. In this feature space optimal hyper plane is determined to maximize the generalization ability of the classifier.
Table 1 Output of SVM for classifying the fault types Models of
SVM
Output of SVM Classification of fault type Types of fault 1 Phase A to ground fault AG 2 Phase B to ground fault BG 1
3 Other fault NA
4 Phase C to ground fault CG 5 Phase A,B to ground fault ABG 2
6 Other fault NA
7 Phase B,C to ground fault CAG 8 Phase C,A to ground fault BCG 3
9 Other fault NA
10 Three phase fault ABC 11 Phase A to phase B fault AB 4
12 Other fault NA
13 Phase C to phase A fault CA 14 Phase B to phase C fault BC 5
15 Other fault NA
During training process, five SVM models are investigated and each model contains two fault types as shown in Table 1. For each SVM model, the adjusted parameters with minimum error are selected as the most appropriate parameters so that the obtained output is only determined as fault or other fault.
After the training process, case studies are varied so that the decision algorithm capability can be verified. The total numbers of the case studies are 360. Various case studies are performed with various types of faults at each location on the transmission line including the variation of fault inception angles and locations at each transmission lines as shown in Table 2 and Figure 6. In addition, the results obtained from the comparison of average accuracy among decision algorithm using the proposed technique, BPNN algorithm and decision algorithm using the comparison of the coefficients DWT which developed by Markming et al [3] are shown in Table 2. It is shown that the average accuracy of fault classification from the decision algorithm proposed in this paper is highly satisfactory. This is an improvement of the fault classification which is detected using the trial and error method developed by Markming et al [3] as well as BPNN [8].
IV. CONCLUSION
This paper proposed a new algorithm for fault classification on transmission lines, using DWT and SVM. Daubechies4 (db4) is employed as mother wavelet in order to decompose high frequency components from fault signals. Positive sequence current signal is used in fault detection.
The coefficients detail of DWT at the first peak time that positive sequence current can detect fault, were performed as an input pattern of SVM in a decision algorithm. The results show clearly that the accuracy of the combination of discrete wavelet transform and support vector machines algorithm is highly accepted as shown in Table 2. The further work will be the improvement of the algorithm by taking into account the effects of other transmission line configurations, instance loop circuits or double circuits for the development of the practical protection system.
0.0390 0.04 0.041 0.042 0.043
5
10 Phase A current at MM3
0.0390 0.04 0.041 0.042 0.043
1
2 Phase B current at MM3
0.0390 0.04 0.041 0.042 0.043
1
2 Phase C current at MM3
0.0390 0.04 0.041 0.042 0.043
1 2 3
Time (sec) Zero sequence current at MM3
(7.8238)
(1.6375)
(1.9678) (1.6375)
SVM Model 1
1 output which corresponding to the
types of faults X
SVM Model 2
SVM Model 3
SVM Model 4
SVM Model 5
Fig. 5 Structure of SVM for classifying types of fault.
Table 2 summary of overall accuracy obtained from the proposed algorithms Fault Classification Classification of the fault types Number of Case
Studies DWT and BPNN [8] DWT and SVM Trail and error method [3] Single line to ground fault 108 100.00% 100% 100.00% Double line to ground fault 108 98.12% 100% 42.59%
Line to line fault 108 100.00% 99.07% 100.00% Three phase fault 36 97.22% 100% 97.22%
(a) In case of single line to ground fault
(b) In case of double line to ground fault
(c) In case of line to line fault
0.00% 20.00% 40.00% 60.00% 80.00% 100.00%
10% 20% 30% 40% 50% 60% 70% 80% 90%
Wavelet and BP
Trial and Error
SVM
Double Line to Ground Fault
f
%
Av
er
ag
e
A
ccu
ra
cy
% lengths of transmission line
0.00% 20.00% 40.00% 60.00% 80.00% 100.00%
10% 20% 30% 40% 50% 60% 70% 80% 90%
Wavelet and BP
Trial and Error
SVM
Line to Line Fault
%
Av
er
ag
e
A
ccu
ra
cy
% lengths of transmission line
0.00% 20.00% 40.00% 60.00% 80.00% 100.00%
10% 20% 30% 40% 50% 60% 70% 80% 90%
Wavelet and BP
Trial and Error
SVM
Single Line to Ground Fault
%
Av
er
ag
e
A
ccu
ra
cy
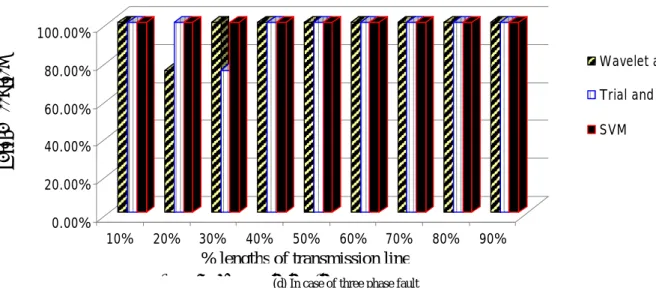
(d) In case of three phase fault
Fig 6. Comparison of average accuracy for fault classification at various lengths of the transmission lines that fault occurs References
[1] Omar A.S. Youssef, “Fault Classification Based On Wavelet Transforms”, IEEE/PES Transmission and Distribution Conference
and Exposition, Vol. 1, pp. 531-538, 2001.
[2] C.H. Kim, H. Kim, Y.H. Ko, S.H. Byun, R.K. Aggrawal and A.T. Johns, “A Novel Fault Detection Technique of High Impedance Arcing Faults in Transmission Lines Using the Wavelet Transform”, IEEE
Transaction on Power Delivery, Vol. 17, No. 4, pp.921-929, 2002.
[3] P. Markming, S. Bunjongjit, A. Kunakorn, S. Jiriwibhakorn and M. Kando, “Fault diagnosis in transmission lines using wavelet transform analysis”, IEEE/PES Transmission and Distribution Conference and
Exhibition 2002 : Asia Pacific, 2002, Vol. 3, pp. 2246-2250, 2002.
[4] M. Jayabharata Reddy and D.K. Mohanta, “A wavelet-fuzzy combined approach for classification and location of transmission line faults”,
Electrical Power and Energy Systems, Vol. 29, pp. 669-678, 2007.
[5] S. El Safty, A. El-Zonkoly, “Applying wavelet entropy principle in fault classification”, Electrical Power and Energy Systems, Vol. 31, pp. 604-607, 2009.
[6] R. N. Mahanty and P.B. Dutta Gupta, “Comparison of fault classification Methods Based on Wavelet Analysis and ANN”, Electric
Power Components and Systems, Vol. 34, No. 1, 47-60, 2006.
[7] K.M. Silva, B.A. Souza and N.S.D. Brito, “Fault Detection and Classification in Transmission Lines Based on Wavelet Transform and
ANN”, IEEE Trans. on Power Delivery, Vol. 21, No. 4, 2058-2063, 2006.
[8] P. Chiradeja and A. Ngaopitakkul, “Identification of Fault Types for Single Circuit Transmission Line using Discrete Wavelet transform and Artificial Neural Networks”, In Proceedings of 2009 International
Conference on Electrical Engineering (ICEE2009), Hong Kong,pp.
1-6, 2009.
[9] K.M. Silva, B.A. Souza and N.S.D. Brito, “Fault Detection and Classification in Transmission Lines Based on Wavelet Transform and ANN”, IEEE Trans. on Power Delivery, Vol. 21, no. 4, pp. 2058-2063, 2006.
[10] J. Upendar, C.P Gupta, G.K. Singh, G. Ramakrishna, “PSO and ANN-based fault classification for protective relaying”, IET Generation, Transmission & Distribution, Vol .4, No. 10, 1197 – 1212, 2010.
[11] N. Perera, A.D. Rajapakse, Recognition of Fault Transients Using a Probabilistic Neural-Network Classifier, IEEE Transactions on Power
Delivery, Vol. 26, No. 1, 410 – 419, 2011.
[12] “Switching and Transmission Line Diagram”, Electricity Generation Authorisation Thailand (EGAT).
[13] N. S. D. Brito, B. A. Souza and F. A. C Pires, “Daubechies wavelets in Quality of Electrical Power,” Proc. IEEE/PES ICHQP, pp511-515, 1998.
0.00% 20.00% 40.00% 60.00% 80.00% 100.00%
10% 20% 30% 40% 50% 60% 70% 80% 90%
Wavelet and BP
Trial and Error
SVM
Three Phase Fault
%
Av
er
ag
e
A
ccu
ra
cy
% L h f T i i Li