Analysis of Inventory Management by Using
Economic Order Quantity Model - A Case Study
Indresh Nishad1, Dr. Arunkumar2 1
PG Student, Viva Institute of Technology
2
Principal, Viva Institute of Technology
Abstract: In today’s global market, companies are looking for growth and opportunities to reduce their total cost and management of companies would like to increase quality, efficiency and capability without increasing their investment. The success of many businesses is related to their ability to provide goods and services at right time and in right place. Different organization adopt different inventory control methods to manage their inventory to avoid stock-out and overstock. In this paper a case study of a company in Vasai, Maharashtra is considered. For this study the EOQ (Economic Order Quantity) technique of inventory management is considered. In this company inventory management is not proper which causes overstock and sometimes stock-out. In this paper inventory management technique is considered and costs are calculated to compare two methods, one is used by this company and other is recommended model.
Keywords: Inventory, EOQ, Ordering Cost, Holding Cost.
I. INTRODUCTION
Inventory management is one of the most important factor in organization and the proportion of inventories to total asset generally varies between 15 to 25%. Inventory management system has mainly two concerns, one is level of customer service i.e. to have right goods, in right place and at right time and other is cost of ordering and carrying inventories. Inventory management is not proper in this company which is situated in Vasai. In this paper it is named as company XYZ because the identity of this company is protected. The management of this company is facing many problems when overstock or stock out occurs in the warehouse. So to overcome these problems various methods can be used like JIT (Just in Time), Value stream mapping, EOQ and ROP etc. In this paper an EOQ method is selected for research work.
II. ORIGIN OF EOQ
Bill Roach 2005 [1], explains how the origin of the Economic Order Quantity started in his article, “Origin of the Economic Order Quantity formula; transcription or transformation?” published in 2005. Roach explains that the Economic Order Quantity (EOQ) has been a well-known formula that calculates the optimal economic order quantity. He also mentions how Ford W. Harris contribution to the EOQ formula was significant. He wrote formula of EOQ in 1915, when he was still an undergraduate student. The formula of EOQ is used in business, also in engineering.
III. ECONOMIC ORDER QUANTITY (EOQ) FORMULA
People in manufacturing industry businesses do not know or do not understand what EOQ means and how to use this technique? In this article, “The EOQ Inventory Formula” written by James A. Cargal [11] clarifies the fundamental theory of the Economic Order Quantity. Cargal published this article from Troy State University Montgomery. The article is straight forward and easy to understand. Cargal does a great job explaining each variable and how it’s used accordingly. The formula is written as illustrated in equation and described as the following,
Q = ∗ ∗
∗
Q = the EOQ order quantity. This is the variable we need to optimize. All the other variables are fixed quantities.
D = the annual demand of product in quantity per unit time. This can likewise be known as a rate.
S = the product order cost. This is the level expense charged for making any order and is independent of Q.
C = unit cost.
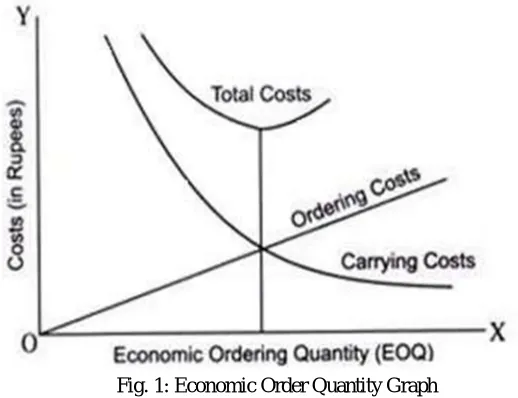
Fig. 1: Economic Order Quantity Graph
IV. ECONOMIC ORDER QUANTITY ASSUMPTION
A. EOQ model assumes that demand is known and is constant over time.
B. No shortages are allowed.
C. Lead time for the receipt of orders is constant.
D. The order quantity is received all at once.
E. The purchase price of item is constant.
V. LITERATURE REVIEW
Bill Roach 2005 [1], clears up how the origin of the Economic Order Quantity began in his article, "Origin of the Economic Order Quantity formula; transcription or transformation?" disseminated in 2005. Bug clears up that the Economic Order Quantity (EOQ) has been a remarkable formula that discovers the perfect economic order quantity. He in like manner determines how Ford W. Harris sense of duty regarding the EOQ formula was basic. Harris was constantly a self-prepared individual that solitary got formal tutoring that connected all through auxiliary school. He made sense of how to make and convey the economic order quantity formula in 1915 as a student understudy. McComas 1995 [2], recommends that the following actions take place within a company in the management of inventory:
A. Establish purchasing review criteria to review the inventory characteristics
B. Purchase only the amount of raw materials needed for a production run or a period of time
C. Collaboration with vendors to improve the purchasing practice
D. Improve inventory control through application of effective inventory control systems
E. Encourage materials exchange within the company.
F. Consider just-in-time manufacturing.
Kisaka, 2006 [5], analyzed the role of Economic Order Quantity model in reducing the cost of raw material inventory at a dairy farm project. He compared total cost of raw material inventory incurred through the project-employed method with the total cost of raw material inventory which could have been incurred under the EOQ application. Kisaka found that there was cost saving which could have been observed through employing the EOQ model [30]. Wisner et al., 2014 [6], Inventory administration includes adjust between customer service, or item accessibility, and cost of stock. There are various variables that influence inventory decision making. In this paper, just two will be viewed as: the cost factor and the uncertainty factor, which incorporates demand uncertainty and time uncertainty. Tayur et al., 2012 [7], many management issues could be solved by removing abundance inventory. Since inventory is emphatically identified with customer service, it is worth close consideration.
Dr. Rakesh Kumar, 2016 [8], in this paper it is discussed that, the Economic Order Quantity is very useful tool for inventory control. It may be applied to finish goods inventories, work-in- progress inventories and raw material inventories. It regulate purchase and storage of inventory in such a way as to maintain an even flow of production at the same time avoiding excessive investment in inventories. Chambers, Lacey 2011 [9], this paper says thatinventory management involves a trade-off between the costs associated with keeping inventory versus the benefits of holding inventory. The benefit of an inventory is to assure that goods will be available as required. The primary costs of an inventory are the opportunity cost of the capital used to finance the inventory, ordering costs, and storage costs. Inventory management seeks to maximize the net benefit, the benefits minus costs of the inventory. Brigham, Daves 2004 [10], Financial managers have an obligation both for raising the capital expected to convey inventory and for the company's general profitability. The objectives of inventory administration are to guarantee that the inventories expected to manage activities are accessible, yet to hold the expenses of ordering and conveying inventories to the least conceivable level. There is dependably strain to diminish inventory as a feature of association's general cost regulation systems, and numerous organizations are finding a way to control inventory costs.
VI. OBJECTIVE OF THE STUDY
A. The main Objective of Inventory Control Are
1) To develop an effective inventory management system.
2) To maintain optimum level of inventory.
3) To minimize carrying cost and time.
4) To find optimal reorder level to make decision when to order.
5) To compare existing inventory with expected inventory for proposed model.
VII. CASE STUDY
This case study is carried out in company called as XYZ. This company was established in the year 2008, the company manufacture and supply different types of blowers. The Company has supplied their products to many customers in India. The Company has office in Nallasopara (E.), Maharashtra for marketing purpose. Raw material required for manufacturing blowers are H.R. Sheet, Motors of different H.P., C-channel, L-angle, nut-bolt and paint. The Main issue of this industry is inventory control for ordering raw material and supply of blowers to customers. To manage inventory of raw materials a case study is carried out and EOQmethod of inventory management has been adopted. To carry out the case study on inventory management company XYZ was approached.
A. The Problem
Current forecasting method used by this firm has brought some problem due to inaccurate forecasting. Forecasting method used is the simple average based on the average historical demand, but this has led to inaccurate prediction.
The purpose of this study is to recommend alternatives ways to help the company to reduce the stock and cost by using more effective prediction EOQ and ROP. For this purpose, analysis of a product of the company is done, using data of the last one year. Finally cost is estimated to see the importance and the difference is compared with the current and proposed model.
B. Determination of EOQ
C. Annual Demand
Annual demand for lug is calculated based on average monthly turnover in this firm. The demand for H.R. Sheet is 3000 kg per month
D = 3000 kg per month x 12 = 36000 kg per year Unit Cost:
Cost of one unit is Rs.60 per kg. Therefore, C = Rs.60/kg Ordering Cost:
According to Company’s current forecasting model, company makes order one time in a month and the total charge is Rs.200000/- According to company’s data cost of ordering is 10% of Rs.200000/-
So, ordering cost per order = Rs.20000/-
Therefore, cost of H.R. Sheet = Rs.200000 – Rs.20000 = Rs180000/-
Therefore no. of kg of H.R. Sheet purchased = . .. . = = 3000 kg
Company makes 1 order in a month, so number of orders = 12 orders in a year. Ordering cost per kg = ∗ = Rs80 per kg
After calculating costs we can estimate EOQ:
EOQ = ∗ ∗
∗
EOQ = ∗. ∗ ∗
= 1788.85 kg
Therefore, the EOQ for H.R. sheet is approximately 1789 kg. Since the firm currently orders 3000 kg, it should decrease the amount of orders to 1789 kg in order to minimize cost.
Total Cost calculation: For EOQ = 1789 kg
Holding cost = × H
= ×1.8
= Rs.1610.1
Ordering cost = No. of order * cost of order per kg
= × 80
= Rs.1609.84
Total cost = Holding cost + Ordering cost = 1610.1 + 1609.84
= Rs.3219.94
From Company’s data (Q = 3000 kg)
Holding cost = × H
= ×1.8
= Rs.2700
Ordering cost = No. of order * cost of order per kg
= × 80
= Rs.960
= 2700 + 960
= Rs.3660
The difference between total cost for Q = 3000 kg and for EOQ = 1789 kg = (3660 – 3219.94) = Rs.440.06 which is greater than EOQ quantity.
[image:5.612.70.547.183.283.2]The result is summarized as,
Table: 1.1 Summarization of result
Term EOQ Technique Company’s current technique
Annual Demand (kg) 36000 36000
Order Quantity (kg) 1789 3000
No. of Order 21 12
Holding Cost (Rs.) 1610.10 2700
Ordering Cost (Rs.) 1609.84 960
Total Cost (Rs.) 3219.94 3660
So optimal order quantity Q= 1789 kg is appropriate, which minimizes total cost for holding inventory.
D. Reorder Point ( How much to Order)
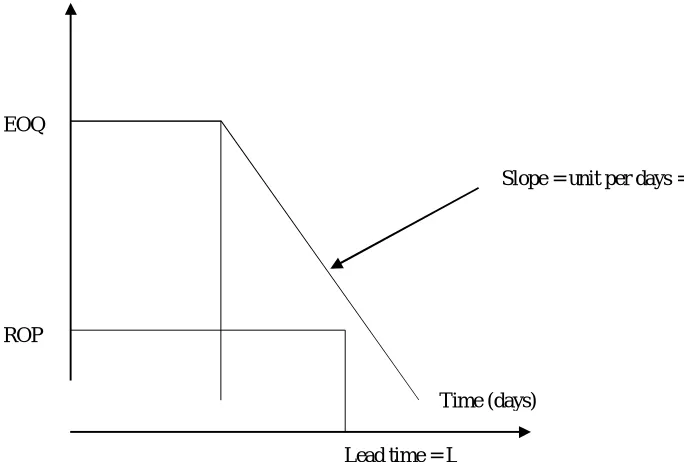
The simple EOQ model assumes that receipt of an order is instantaneous i.e. it is assumed:
1) A firm will place an order when the inventory level for that particular product reaches to zero.
2) It will receive the ordered product immediately.
The time between placing an order and reception of an order called lead time can be as sort as a few hours or as long as months. The reorder point is given as,
ROP = (Demand per day) * (Lead time for a new order in days) = D * L This equation for ROP assumes that demand during lead time and lead time itself is constant. The Demand per day is found by dividing the annual demand D by the number of working days in a year.
Figure 1.2: Reorder point ROP
EOQ
Lead time = L
Time (days)
[image:5.612.59.401.481.712.2]Calculation of ROP: Sheet H.R.
No. of working days in a year = 365 days Carrying rate, w = 0.03 per unit per year
Lead time, L = 10 days Annual demand, A = 36000 kg
Reorder Point = Demand per day × Lead time
ROP =
. ×
= × L
= × 10
= 986.30 kg
Since most significant interval is 10 days then the firm should make order when stock level is at 986.30 kg.
VIII. RESULT AND CONCLUSION
The EOQ technique of inventory management results in reduction in holding and ordering cost. Thus this reduces the total cost of the company. In this research paper total cost of inventory is reduced by approximately 10%.
From the above study it is found that in most of the cases industry does not follow the modern inventory management system. Here materials are ordered through experience or when inventory levels become low. They keep one month stock of the raw materials and then place order for the next lot. As a result the company faces the problem of overstocking or understocking.
Therefore, the company needs a dignified inventory system to minimize operational costs. If the Economic Order Quantity model is used with proper judgment by the management then holding costs and cost of ordering can be reduced to a greater magnitude. By using this model the company can know about the exact amount of materials to order and when to place new orders for each material. From reorder point calculation it can be determined when next order is to be placed.
Since there is no formal inventory control system employed by this company to manage inventories for its raw materials, some aspects need to be improved in order to minimize the raw materials inventory costs. The following are recommended:
A. Company should improve their ways of keeping records about purchasing. If possible, the company should computerize these systems.
B. Lack of mindfulness on the quantitative strategies of inventory administration shows that storekeepers and supplies staff are deficient in administration of business abilities, therefore these staff ought to be given a vocation preparing about stores and supplies administration to enhance their insight and capability in the field.
C. It is likewise recommended that occasional audit where inventory are surveyed in a normal interim might be the suitable approach for the organization to understand the 'when to order' issue.
IX. LIMITATION OF THE STUDY
Due to restriction as per company policy required data collection is not possible. Also it was so difficult to collect data from all available department. Economic order quantity calculation is based on some assumption. Here demand is assumed to be constant over the period. But in practice demand is variable during the period.
REFERENCES
[1] Roach/School of Business, Washburn University, Topeka, Kansas, USA, Bill. "Origin of the Economic Order Quantity formula; transcription or
transformation?" Management Decision 43.9 (2005): 1262-268. Emerald Group Publishing Limited. Web. 20 Nov. 2009.
[2] McComus, C. (1995). Controlling Purchasing and Inventory to Reduce Waste, Pollution Prevention Review,5.
[3] Nanaware*etal. “Inventory Management Technique in Construction” International Journal 0f Engineering Sciences & Research 6(9): September, 2017 ISSN:
2277-9655 pp. 225-230.
[4] Shim, J. K., Siegel, J. G. (2008). Financial Management, New York: McGraw Hill.
[6] Wisner, J. D., Tan, K. C., & Leong, G. K. (2014). Principles of supply chain management: A balanced approach. Cengage Learning.
[7] Tayur, S., Ganeshan, R., & Magazine, M. (Eds.). (2012). Quantitative models for supply chain management (17). Springer Science and Business Media.
[8] Dr. Rakesh kumar (2016). “Economic Order Quantity Model (EOQ)”. Global Journal of Finance and Economic Management. ISSN: 2249-3158, Volume5,
No.1, pp. 1-5.
[9] Chambers, D., Lacey, N. (2011). Modern Corporate Finance, Sixth Edition, Michigan: Hayden McNeil Publishing.
[10] Brigham, E. F., Daves, P. R. (2004). Intermediate Financial Management, Eight Edition, Ohio: Thomson.
[11] Balakrishnan, Anantaram., Pangburn, Michael S., and Stavrulaki, Euthemia. ""Stack Them High, Let 'em Fly": Lot-Sizing Policies When Inventories Stimulate
Demand." Management Science 50.5 (2004): 630-644. ABI/INFORM Global, ProQuest. Web. 10 Dec. 2009.
[12] Bassin, William M. "A Technique for Applying EOQ Models to Retail Cycle Stock Inventories." Journal of Small Business Management 28.1 (1990): 48- 55.
ABI/INFORM Global, ProQuest. Web. 10 Dec. 2009.
[13] Cargal, James M. "The EOQ Inventory Formula." http://www.cargalmathbooks.com. Web. 15 Nov. 2009.
<http://www.cargalmathbooks.com/The%20EOQ%20Formula.pdf>.
[14] Carter, Joseph, Bruce Ferrin, and Craig Carter. "On Extending Russell and Krajewski's Algorithm for Economic Purchase Order Quantities." Decision Sciences, 26.6 (1995): 819.
[15] Chen, Fangruo. "Echelon Reorder Points, Installation Reorder Points, and the Value of Centralized Demand Information." Management Science, 44.12 (1998):
221.
[16] Stockton, David John, and Liam Quinn. "Identifying Economic Order Quantities Using Genetic Algorithms." International Journal of Operations & Production