Osteoconductivity of Anodized Titanium with Controlled
Micron-Level Surface Roughness
Dai Yamamoto
1;*, Ikki Kawai
1;*, Kensuke Kuroda
1, Ryoichi Ichino
2,
Masazumi Okido
1and Azusa Seki
31Department of Materials Science & Engineering, Graduate School of Engineering,
Nagoya University, Nagoya 464-8603, Japan
2EcoTopia Science Institute, Nagoya University, Nagoya 464-8603, Japan 3Hamri Co., Ltd., Tokyo 110-0005, Japan
The aim of this study was to elucidate the relationship between the surface roughness and osteoconductivity of anodized titanium surfaces. Before anodizing, titanium substrates with different surface roughness were prepared by wet-polishing. These substrates were anodized at various voltages in H3PO4, H2SO4, and NaOH aqueous solutions, and their surface roughness was controlled simultaneously at the micron level.
Surface roughness of these coatings was expressed with the arithmetical means (Ra). The osteoconductivity of anodized samples was evaluated byin vivotests. Inin vivotests, samples were implanted in rats’ tibia for 14 d. Anatase type TiO2films were formed on all of the anodized
samples forin vivotests. It was newly found that TiO2film with small Ra value exhibited high osteoconductivity than that with high Ra value,
especially when Ra value was<0:3mm. In addition, the osteoconductivity of anodized samples with Ra/mm>0:3was not improved by anodizing, showing the same low osteoconductivity of as-polished samples. These tendencies were observed for all of the TiO2films regardless
of the type of electrolytes. [doi:10.2320/matertrans.M2011049]
(Received February 4, 2011; Accepted May 30, 2011; Published July 25, 2011)
Keywords: anodizing, osteoconductivity, surface roughness, titanium, titanium dioxide
1. Introduction
Titanium (Ti) is widely used in dental and orthopedic implants because of its good biocompatibility and high corrosion resistance. The long-term success rates of Ti
implants have been well documented.1,2) However, many
failures occur when the bone is of poor quality.3,4)Various
methods to improve the clinical performance of Ti implants in poor-quality bone and to shorten the healing period have been assessed. For example, hydroxyapatite (HAp), which is the main inorganic component of natural bone, is usually used in the form of a coating on a metallic substrate to compensate for its poor intrinsic mechanical properties. In
our previous studies, HAp with various crystal structures,5–9)
carbonate apatite (CO3Ap), CO3Ap/CaCO3composite films,
HAp/collagen10) and HAp/gelatin composite films,11) have
been fabricated on Ti substrates using the thermal substrate method and we have investigated their osteoconductivity in
in vivotests in rats’ tibia. These studies have revealed that a
specific crystal structure strongly accelerates calcification in the cancellous bone part.
Titanium dioxide (TiO2) is in the spotlight as an
osteoconductive substance, similar to HAp. TiO2 has been
shown to exhibit strong physicochemical bonding between an Ti implant and living bone because of its ability to induce
bone-like apatite in a body environment.12)It is thought that
the surface properties of Ti implants influence the biological responses at the interface between the bone tissue and the
implant.13–18) Therefore, the optimization of the surface
properties of TiO2 coatings is key point to improve the
osteoconductivity of implants. There are many types of TiO2
coating methods for Ti substrates, such as thermal
treat-ment,19) chemical methods,20–22) physical vapor
deposi-tion,23,24) and anodizing.25–28) Among these methods, we
chose anodizing as a processing route involving hydro-processing, as a hydrous environment is similar to the internal environment of the body. Anodizing can form
uniform TiO2 thin films on Ti substrates. Furthermore, thin
adhesive film can even be formed on substrates with a complicated topography. The surface morphology and
sur-face roughness of TiO2 films can be controlled using the
initial substrate roughness and anodizing conditions, such as the applied voltage and type of aqueous solution.
For Ti implants, it has been reported that a
macro-rough surface enhances bone formation.14,17,29)On the other
hand, for TiO2 coatings, it is not clear how the micron-level
surface roughness influences osteoconductivity. In this study,
TiO2 coatings were fabricated, and their surface roughness
was controlled using anodizing. These samples were im-planted into rats’ tibia for a period of 14 d, and the influence of the surface roughness on the osteoconductivity was investigated.
2. Materials and Methods
2.1 Preparation of Ti substrates
Cp-Ti plates (for evaluating the coatings, area = 1.13 cm2)
and rods (forin vivotesting, dimensions = 25mm) were
used as the substrates, and these were covered with epoxy resin, except for the face that would be in contact with the aqueous solution. Various degrees of surface roughness were obtained by polishing the samples in the same direction with emery paper (grid = #120, #220, and #400) followed by
buffing using Al2O3 particles (particle size = 0.05mm).
After polishing, the substrates were cleaned and then degreased with ethanol.
2.2 Anodizing in aqueous solutions
Ti substrates were used as the working electrode, and a Pt coil was used as the counter electrode. The aqueous solution was stirred while anodizing and was kept at a constant
temperature (298 K) in a water bath. Aqueous 0.1 M H2SO4,
0.1 M H3PO4, and 0.1 M NaOH solutions were used as
electrolytic baths, because they are often used in in vitro
studies of anodized titanium.30,31)A rapid rate of increase in
the voltage made it difficult to control the surface roughness of the substrates, so the anodizing potential was increased
slowly (0.1 V s 1) up to a potential of 200 V. All the samples
were evaluated after sterilization, and sterilization did not influence on evaluated surface properties of samples.
2.3 Analysis of coatings
All the samples were sterilized using an autoclave unit at 394 K for a period of 20 min. before analysis. The surface morphology of the substrates was observed using a scanning electron microscope (SEM). The coated films were identified using a thin-film X-ray diffraction (XRD) and a X-ray photoelectron spectroscopy (XPS). The surface roughness measurements were conducted by means of contactless probing using a confocal laser scanning microscope with a
measurement area of 150mm112mm. The arithmetical
means of the surface roughness (Ra) was used, as this value was not distorted by any local scarring of the sample.
2.4 In vivotests
Since the experimental procedure for ourin vivostudy was
almost the same as described in previous reports,9) it is
described in brief here. Before surgery, all the implants were cleaned in distilled water and immersed in a chlorhexidine gluconate solution. Ten-week-old male Sprague Dawley rats (Charles River Japan, Inc., Japan) were used in our experimental procedures. The samples were implanted in the tibial metaphysis of rats to contact with both cortical bone part and cancellous bone part. A slightly oversized hole, which did not pass through to the rear side of the bone, was created using a low-speed rotary drill. Subsequently, the implants were inserted into these holes, and then the subcutaneous tissue and skin were closed and sterilized.
The rats were sacrificed after a period of 14 d, and the implants with their surrounding tissue were retrieved. The samples were fixed in a 10% neutral buffered formalin solution, dehydrated in a graded series of ethanol, and embedded in methylmethacrylate. Following polymerization,
each implant block was sectioned longitudinally into 20mm
thick slices. These sections were then stained with toluidine blue.
Optical microscope was used for the observation of interface between bone and implant. The sum of the linear bone contact with the implant surface was measured and was expressed as a percentage over the entire implant length (the
bone-implant contact ratio,RB-I) in the cancellous bone and
the cortical bone parts. Significant differences in the bone-implant contact ratio were analyzed statistically using the
Tukey-Kramer method.32)Differences were considered
stat-istically significant at the p<0:05level (described as dotted
lines and stars in Fig. 5). This animal study was conducted in the laboratory of AAALAC International (Association for
Assessment and Accreditation of Laboratory Animal Care International).
3. Results and Discussion
3.1 Surface properties
Representative SEM images of Ti substrate surface before and after anodizing are shown in Fig. 1. No obvious scratches were observed on a buffed as-polished substrate (Fig. 1(a))
indicating that Ra/mm= 0.057, but scratches along the same
direction were clearly observed for the #400 polished substrate (Fig. 1(b)), which showed that Ra had increased
to 0.225mm.
A TiO2film was formed on the Ti substrate after anodizing
in a 0.1 M H2SO4solution (Fig. 2(a)). When anodized under
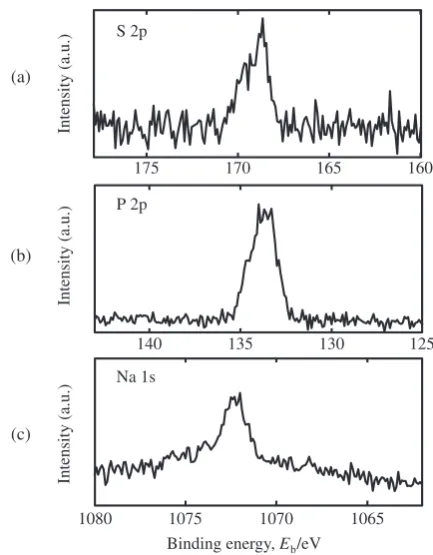
a potential of 100 V, an anatase peak was observed in the XRD data. The XPS data showed that the film contained
SO43 , which seemed to have derived from the aqueous
solution (Fig. 3). This film showed a yellow interference
color, indicating a film thickness of about 120 nm.33)
Regarding the buffed substrates, although small swellings were observed in spots on the film, other area were as flat as the as-polished ones. Because of these small swellings, the
Ra value changed slightly from 0.057mm to 0.084mm.
Regarding the #400 polished substrate after anodizing, scratch marks were clearly observed, and the value of Ra was almost equal to that of the as-polished sample, which implied that the initial surface morphology was maintained after anodizing at 100 V. When a potential of 200 V was applied to the substrates, the film became thicker and the surface morphology of both buffed and #400 polished substrates changed. Regarding the buffed substrate, the small swellings observed at a potential of 100 V increased, and some pores were observed in the film, which showed an
increase in Ra to 0.110mm. In the case of the #400 polished
substrates, pores were observed across the entire film, and no scratches were observed, resulting in an increase in the value of Ra. These observations seemed to be the result of a breakdown of the dielectric. Figure 4 shows the relationship between the applied voltage and the current density. From Fig. 4, a fluctuation in the current density at relatively high current densities was observed at potentials above 170 V, which represented a local breakdown in the film. As the applied voltage increased, the anatase peak became more dominant and a weak rutile was also detected, as shown in
Fig. 2(a). A similar oxide film was obtained by Cuiet al.34)
In the case of anodizing at 100 V and 80 V in 0.1 M H3PO4
and 0.1 M NaOH solutions, respectively, each of the films showed a yellow interference color, which was composed of
an anatase-type TiO2(Fig. 2(b)), indicating a similar value of
Ra to the initial Ra value (Fig. 1(a)(4) or (6), Fig. 1(b)(4) or
(6)), shown by the film anodized in a 0.1 M H2SO4solution.
Both anions and cations were also contained in the films
anodized in H3PO4 and NaOH (Fig. 3). When anodized at
200 V, the same behavior was observed as shown by the film
anodized in a 0.1 M H2SO4solution. A similar oxide film was
previously obtained by Kuromotoet al.35)
2 μμm
(1) (2) (4)
(5) (3)
(a)
(1) (2) (4)
(b)
(5) (3)
Ra/μm = 0.057
0.225 0.177 0.200
0.211 0.251
0.084 0.082
0.110 0.114
(6)
(7)
0.092
0.130
(6)
(7)
0.258
0.284
Fig. 1 SEM images of a substrate surface of an as-polished Ti sample, and after anodizing with surface roughness of Ra: (a) buffed sample, (b) polished with grid = #400, (1) as-polished, (2) anodized in H2SO4at 100 V, (3) anodized in H2SO4at 200 V, (4) anodized in
H3PO4at 100 V, (5) anodized in H3PO4at 200 V, (6) anodized in NaOH at 80 V, and (7) anodized in NaOH at 200 V.
2θ (degree, CuKα)
(a)
(b)
0 2000 4000 6000
8000 anatase rutile
24 25 26 27 28 29
0 200 400 600
800 anatase rutile
5000
10000 anatase rutile
(c)
0
Intensity (cps)
Fig. 2 XRD patterns of Ti substrates after anodizing at room temperature in (a) 0.1 M H2SO4, (b) 0.1 M H3PO4, and (c) 0.1 M NaOH aqueous
solutions. —: 100 (80) V, – –: 200 V.
(a)
(b)
(c)
125 130
135 140
1065 1070
1075 1080
Binding energy, Eb/eV P 2p
S 2p
Na 1s
160 165
170 175
Intensity (a.u.)
Intensity (a.u.)
Intensity (a.u.)
Fig. 3 High-resolution XPS spectra of the titanium substrate anodized at 100 V in: (a) 0.1 M H2SO4, (b) 0.1 M H3PO4, and (c) 0.1 M NaOH aqueous
[image:3.595.131.464.69.385.2] [image:3.595.315.532.469.747.2] [image:3.595.60.276.484.747.2]a potential of 100 or 80 V did not increase the surface roughness, and the initial morphology was maintained after anodizing, regardless of the degree of the initial surface roughness. However, application of a potential of 200 V to the Ti substrate brought about a serious change in the surface morphology in all of the aqueous solutions, resulted in the increase of Ra value. Previous papers reported that crystal structure and film thickness could affect the apatite formation
ability or osteoconductivity.31,34,36) Furthermore, we have
already found that the crystallinity of anatase film and
anions/cations contained in TiO2 film could influence on
their osteoconductivity. These findings will be reported in
next papers. Therefore, samples for in vivo test should be
prepared so that crystal structure, crystallinity, film thickness, and anions/cations in the film do not influence on the osteoconductivity of samples in evaluating the influence of surface roughness. From above viewpoints, samples with various surface roughness prepared by anodizing in 0.1 M
H2SO4, H3PO4, and NaOH aqueous solutions at 100 or 80 V
were used for the following in vivo test and evaluated for
every electrolytes.
3.2 In vivostudies
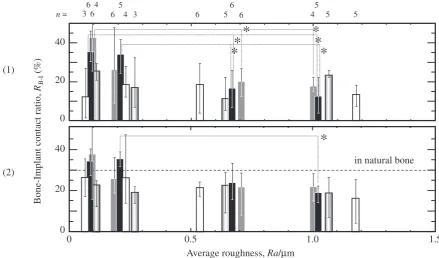
Figure 5 shows the effect of the surface roughness on the osteoconductivity in different aqueous solutions. In the cortical bone parts, the as-polished Ti implant had a low
RB-I value,<20%, irrespective of Ra value (Fig. 5(1)). The
surface roughness of Ti has been reported to influence the
osteoconductivity,14,17,29)but this tendency was not seen in
the region of Ra studied in this work, showing almost
constant lowRB-Ivalue of 20%. Similar lowRB-Ivalues were
also obtained for the samples with Ra/mm >0:3 after
anodizing in H2SO4aqueous solution. However, the samples
with Ra/mm<0:3had higher RB-I value of near 40% after
anodizing in H2SO4 aqueous solution. This result was not
unique in the case of H2SO4, but also shown in the case of
H3PO4and NaOH aqueous solutions. Furthermore, the same
tendencies were also obtained in cancellous bone part. In
our previous studies, Kuroda et al.precipitated HAp with a
needle-like crystal structure on Ti substrates and implanted
them in rats’ tibia for 14 d.9)The value ofRB-Iwas 34% in the
cortical bone parts, which was similar to theRB-Ivalues of the
anodized implants in this study. This demonstrates that TiO2
films with Ra/mm <0:3 formed in this study had high
osteoconductivity equivalent to HAp. About 30% of hard tissue formation was observed by measuring the ratio of hard tissue formation inside of cancellous bone, which was considered as natural hard tissue ratio in cancellous bone.
Since implants with Ra/mm <0:3 anodized in H2SO4 and
H3PO4 solution had higher RB-I value than 30%, enough
amount of hard tissue was formed. However, the influence of surface roughness on the mechanism of bone formation was
Current density
,
i
/A cm
-2
Anodizing voltage, E/V H2SO4
H3PO4 NaOH
0 10-4 10-3 10-2 10-1 100
100 200
Fig. 4 Change in current density with applied voltage to Ti substrates in 0.1 M H2SO4, 0.1 M H3PO4, and 0.1 M NaOH at 298 K.
40
20
0
Average roughness, Ra/μm 40
20
0
0.5 1.0 1.5
0
in natural bone
Bone-Implant contact ratio,
RB-I
(%)
*
*
*
*
*
*
(1)
(2)
*
3 6
6 6
5
4 6
6
4 5
5 3
4
n = 5 6 5
Fig. 5 Influence of the surface roughness, Ra, on the bone-implant contact ratio,RB-I: (1) cortical bone part, and (2) cancellous bone part.
[image:4.595.62.285.307.448.2] [image:4.595.75.515.498.756.2]not clear yet. This was because enough data has not been
obtained to discuss the mechanism since the results ofin vitro
evaluations37–39)did not always agree with the results ofin
vivoevaluations.40)Nevertheless, it was significant result that
TiO2 coatings with fine surface in micron-level tended to
show highRB-Ivalue.
4. Conclusions
In this research, the influence of micron-level controlled surface roughness on the osteoconductivity of anodized
TiO2coatings was investigated, and following findings were
obtained.
(1) Anatase-type TiO2 films were obtained by anodizing
cp-Ti in 0.1 M H2SO4at 100 V, 0.1 M H3PO4at 100 V,
and 0.1 M NaOH at 80 V. Surface roughness and morphology of these films were almost the same as those of initial substrates.
(2) When Ra value was<0:3mm, the anodized Ti implants
induced a high level of hard tissue formation at the interface between the implant and the bone.
(3) The osteoconductivity of anodized samples with Ra/
mm>0:3was not improved by anodizing, showing the
same low osteoconductivity of as-polished samples.
Acknowledgements
This work was partially supported by a Grant-in-Aid for Scientific Research (C) (No. 19560702, 21560719) and the Global COE program (COE for Education and Research of Micro-Nano Mechatronics) from the Japan Society for the Promotion of Science (JSPS).
REFERENCES
1) R. Adell, B. Eriksson, U. Lekholm, P. I. Branemark and T. Jemt: Int. J. Oral Maxillofac Implants.5(1990) 347–359.
2) D. van Steenberghe, U. Lekholm, C. Bolender, T. Folmer, P. Henry, I. Herrmann, K. Higuchi, W. Laney, U. Linden and P. Astrand: Int. J. Oral Maxillofac Implants.5(1990) 272–281.
3) R. A. Jaffin and C. L. Berman: J. Periodontol.62(1991) 2–4. 4) W. Khang, S. Feldman, C. E. Hawley and J. Gunsolley: J. Periodontol.
72(2001) 1384–1390.
5) K. Kuroda, R. Ichino, M. Okido and O. Takai: J. Biomed. Mater. Res.
59(2002) 390–397.
6) K. Kuroda, R. Ichino, M. Okido and O. Takai: J. Biomed. Mater. Res.
61(2002) 354–359.
7) K. Kuroda, Y. Miyashita, R. Ichino, M. Okido and O. Takai: Mater. Trans.43(2002) 3015–3019.
8) K. Kuroda, S. Nakamoto, R. Ichino, M. Okido and R. M. Pilliar: Mater. Trans.46(2005) 1633–1635.
9) K. Kuroda, S. Nakamoto, Y. Miyashita, R. Ichino and M. Okido: Mater. Trans.47(2006) 1391–1394.
10) K. Kuroda, M. Moriyama, R. Ichino, M. Okido and A. Seki: Mater.
Trans.49(2008) 1434–1440.
11) K. Kuroda, M. Moriyama, R. Ichino, M. Okido and A. Seki: Mater. Trans.50(2009) 1190–1195.
12) R. Hazan, R. Brener and U. Oron: Biomater.14(1993) 570–574. 13) D. Buser, N. Broggini, M. Wieland, R. K. Schenk, A. J. Denzer, D. L.
Cochran, B. Hoffmann, A. Lussi and S. G. Steinemann: J. Dent. Res.83
(2004) 529–533.
14) D. L. Cochran, D. Buser, C. M. ten Bruggenkate, D. Weingart, T. M. Taylor, J. P. Bernald, F. Peters and J. P. Simpson: Clin Oral Implants Res.13(2002) 144–153.
15) C. Eriksson, H. Nygren and K. Ohlson: Biomater.25(2004) 4759– 4766.
16) J.-W. Park, K.-B. Park and J.-Y. Suh: Biomater.28(2007) 3306–3313. 17) G. B. Schneider, R. Zaharias, D. Seabold, J. Keller and C. Stanford:
J. Biomed. Mater. Res.69(2004) 462–468.
18) G. Zhao, Z. Schwartz, M. Wieland, F. Rupp, J. Geis-Gerstorfer, D. L. Cochran and B. D. Boyan: J. Biomed. Mater. Res.74(2005) 49–58. 19) S. Fujibayashi, M. Neo, H.-M. Kim, T. Kokubo and T. Nakamura:
Biomater.25(2004) 443–450.
20) L. Jonasova, F. A. Muller, A. Helebrant, J. Strnad and P. Greil: Biomater.25(2004) 1187–1194.
21) F. Xiao, K. Tsuru, S. Hayakawa and A. Osaka: Thin Solid Films.441
(2003) 271–276.
22) J.-M. Wu, S. Hayakawa, K. Tsuru and A. Osaka: Scr. Mater.46(2002) 101–106.
23) K.-R. Wu, C.-H. Ting, W.-C. Lie, C.-H. Lin and J.-K. Wu: Thin Solid Films500(2006) 110–116.
24) L. S. Hsu, R. Rujkorakarn, J. R. Sites and C. Y. She: J. Appl. Phys.59
(1986) 3475–3480.
25) Y.-T. Sul, C. B. Johansson, S. Petronis, A. Krozer, Y. S. Jeong, A. Wennerberg and T. Albreksson: Biomater.23(2002) 491–501. 26) J. P. Schreckenbach, G. Marx, F. Schlotigg, M. Textor and N. D.
Spencer: J. Mater. Sci. Mater. Med.10(1999) 453–457.
27) B. Yang, M. Uchida, H.-M. Kim, X. Zhang and T. Kokubo: Biomater.
25(2004) 1003–1010.
28) L. A. de Sena, N. C. C. Rocha, M. C. Andrade and G. A. Soares: Surf. Coating Tech.166(2003) 254–258.
29) G.-L. Yang, F.-M. He, X.-F. Yang, X.-X. Wang and S.-F. Zhao: Oral Surg. Oral Med. Oral Pathol. Oral Radiol. Endod.106(2008) 516–524. 30) H.-J. Song, S.-H. Park, S.-H. Jeong and Y.-J. Park: J. Mater. Proc. Tech.
209(2009) 864–870.
31) K. Das, S. Bose and A. Bandyopadhyay: Acta Biomater.3(2007) 573– 585.
32) C. Y. Kramer: Biometrics12(1956) 307–310.
33) S. V. Gils, P. Mast, E. Stijns and H. Terryn: Surf. Coating Tech.185
(2004) 303–310.
34) X. Cui, H.-M. Kim, M. Kawashita, L. Wang, T. Xiong, T. Kokubo and T. Nakamura: Dent. Mater.25(2009) 80–86.
35) N. K. Kuromoto, R. A. Simao and G. A. Soares: Mater. Charact.58
(2007) 114–121.
36) C. Larsson, P. Thomsen, J. Lausmaa, M. Rodahl, B. Kasemo and L. E. Ericson: Biomater.15(1994) 1062–1074.
37) B. Feng, J. Weng, B. C. Yang, S. X. Qu and X. D. Zhang: Biomater.24
(2003) 4663–4670.
38) D. de Santis, C. Guerriero, P. F. Nocini, A. Ungersbock, G. Richards, P. Gotte and U. Armato: J. Mater. Sci. Mater. Med.7(1996) 21–28. 39) J. Y. Martin, Z. Schwartz, T. W. Hummert, D. M. Schraub, J. Simpson,
Jr. J. Lankford, D. D. Dean, D. L. Cochran and B. D. Boyan: J. Biomed. Mater. Res.29(1995) 389–401.