On the Selection of Strength for Fixed-strength
Interaction Coverage Based Prioritization
Rubing Huang
∗, Weiwen Zong
∗, Tsong Yueh Chen
†, Dave Towey
‡, Jinfu Chen
∗, Yunan Zhou
∗, Weifeng Sun
∗ ∗School of Computer Science and Communication Engineering, Jiangsu University, Zhenjiang 212013, P.R. China{rbhuang, vevanzong, jinfuchen, zhouyn}@ujs.edu.cn,[email protected]
†Department of Computer Science and Software Engineering, Swinburne University of Technology, Hawthorn 3122, Australia
‡School of Computer Science, University of Nottingham Ningbo China, Ningbo 315100, P.R. China
Abstract—Abstract test cases are derived by modeling the system under test, and have been widely applied in practice, such as for software product line testing, and combinatorial testing. Abstract test case prioritization (ATCP) is used to prioritize abstract test cases, and aims at achieving higher rates of fault detection. Many ATCP algorithms have been proposed, using different prioritization criteria and information. One ATCP approach makes use of fixed-strength level-combinations infor-mation covered by abstract test cases, and is calledfixed-strength interaction coverage based prioritization (FICBP). Before using FICBP, the prioritization strengthλneeds to be decided. Previous studies have generally focused on λ values ranging between 1 and 6. However, no study has investigated the appropriateness of such a range, nor how to assign the prioritization strength for FICBP. To answer these questions, this paper reports on an empirical study involving four real-life programs (each of which with six versions). The experimental results indicate thatλshould be set approximately equal to a value corresponding to half of the number of parameters, when testing resources are sufficient. Our results also show that when testing resources are limited or insufficient, either small or large λ values are suggested for FICBP.
Index Terms—Software testing; abstract test case prioritiza-tion; FICBP; prioritization strength; empirical study.
I. INTRODUCTION
A system under test can generally be influenced by many parameters or factors, such as environment variables, input parameters, and so on. Each such parameter may contain a finite number of levelsor values. Combinations of parameter levels are called abstract test cases (ATCs) [1] or model inputs [2]. Abstract test cases have been widely used in many testing environments, including in software product line testing [3], and combinatorial testing [4]. Due to limited testing resources, for example when conducting regression testing, ATC prioritization (ATCP) can be employed by reordering elements in the given test suite, with the goal of executing those ATCs that are more likely to detect failures.
Many ATCP methods have been proposed according to different intuitions [5], such as test case similarity based ATCP [3, 6]. A well-studied ATCP that uses information of level-combinations coverage of a fixed strength λ (called prioritization strength) directly obtained from ATCs
them-selves isfixed-strength interaction coverage based prioritiza-tion(FICBP) [7]. FICBP repeatedly chooses an element from candidate ATCs as the next test case such that it covers the largest number ofλ-wise level combinations that have not yet been covered by previously selected test cases. Many studies have shown that FICBP is an effective method for prioritizing ATCs [7–9].
Intuitively speaking, FICBP needs to assign a fixed value for the prioritization strengthλthat is usually between1and6 (inclusive) [7–11]. To the best of our knowledge, however, no study has yet examined whether or not theseλvalues are the most appropriate. In this paper, we report on an empirical in-vestigation into FICBP with all possible prioritization strength values for the programs under test. For example, when the test object haskparameters, the assignment ofλranges between1 andk. The investigation involved four widely-used programs written in C, each of which has six versions, to compare the testing effectiveness and efficiency of FICBP techniques with different prioritization strengths. In addition to the rate of interaction coverage, we also studied the rate of fault detection, and the prioritization cost.
In summary, the main contributions of this paper are: • We report on an empirical study to investigate the
selec-tion of prioritizaselec-tion strength assigned for FICBP. • We report on an investigation into the testing effectiveness
and efficiency of FICTP with all possible prioritization strength values, in terms of interaction coverage rate, fault detection rate, and prioritization cost.
• We present some guidelines for testers about how to choose the prioritization strength for FICBP under dif-ferent testing scenarios.
The rest of this paper is organized as follows: Section II introduces some background information. Section III presents details of the empirical study, and Section IV discusses some potential threats to validity. Finally, Section V concludes the paper, and discusses potential future work.
II. BACKGROUND
A. Factor-Level Model
The parameter-level model is used to model the system under test (SUT), describing information about the parameters and levels.
Definition 1: A parameter-level model, Model(F, L, C), is the model of the SUT, where F ={f1, f2,· · ·, fk} is the set of k impact parameters,L={L1, L2,· · ·, Lk} is a set ofk parameter-level sets such that each Li corresponds to each
fi (i = 1,2,· · · , k), and C is a set of constraints among different parameter levels.
Since the specific levels of each parameter have no im-pact on the model, without loss of generality, we can use an abbreviated version of the model in this paper: Model(|L1||L2| · · · |Lk|, C).
Definition 2: An abstract test case, denoted(l1, l2,· · ·, lk), is ak-tuple, whereli∈Li (i= 1,2,· · ·, k).
An ATC is also a test case, but not a concrete one. An ATC is said to bevalid ifC is satisfied (i.e., if all the model constraints are satisfied).
Definition 3: A η-wise level combination is aη-tuple φ= (li1, li2,· · ·, liη), wherelij ∈Vij (j = 1,2,· · ·, η),1≤li1< li2 <· · ·< liη≤k, and 0≤η≤k.
In general, a η-wise level combination is also called a η -level schema [4], with η being the size of the combination. Similarly, a η-wise level combination is said to be valid if it satisfies all constraints inC. Whenη=k, aη-wise level com-bination is an ATC for the SUT. An ATCtc= (l1, l2,· · · , lk) can cover a η-wise level combinationφ = (l′i
1, l
′ i2,· · · , l
′ iη),
if and only if for 1 ≤ j ≤ η, lij = l′ij, i.e., the levels of
the parameter fij are identical in tc andφ. Obviously, each
ATC could cover Ckη η-wise level combinations. For ease of description, we define a term Ψ(η, tc) as the set of η-wise level combinations covered by the test case tc. Similarly, we define a termΨ(η, T)as the set ofη-wise level combinations covered by all test cases inT,i.e.,Ψ(η, T) =∪tc∈TΨ(η, tc). B. TCP and FICBP
Test case prioritization(TCP) is used to schedule test cases in an order, so that, according to some criteria (e.g., condition coverage), test cases with higher priority are executed as early as possible. A well-prioritized test suite may improve the likelihood of detecting faults faster, which can be very important when testing resources are limited. The problem of TCP can be defined as [12]:
Definition 4: Given(T,Ω, g), whereT is a set of test cases,
Ωis the set of all prioritized test suites obtained by permuting test cases ofT, andgis a function from a prioritized test suite to an award value, the problem of TCP is to find an S ∈Ω
such that:
(∀S′) (S′∈Ω) (S′̸=S) [g(S)≥g(S′)]. (1)
Applying TCP to ATCs is called ATC Prioritization (ATCP) [5]. The most well-studied ATCP algorithm is fixed-strength interaction coverage based prioritization(FICBP) [7], which greedily chooses each element as the next ATC such that it covers the largest number ofλ-wise level combinations that
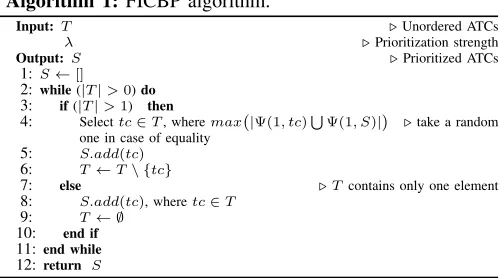
Algorithm 1: FICBP algorithm.
Input: T ◃Unordered ATCs
λ ◃Prioritization strength
Output:S ◃Prioritized ATCs
1: S←[]
2: while(|T|>0)do 3: if(|T|>1) then
4: Selecttc∈T, wheremax(|Ψ(1, tc)∪Ψ(1, S)|) ◃take a random one in case of equality
5: S.add(tc)
6: T←T\ {tc}
7: else ◃ Tcontains only one element
8: S.add(tc), wheretc∈T
9: T← ∅
10: end if 11:end while 12:return S
have not yet been covered by previously selected ATCs. The detailed information of FICBP is given in Algorithm 1.
An important aspect of the FICBP algorithm is that it is necessary to assign a value to the prioritization strength (λ) parameter in advance.
III. EMPIRICALSTUDY
This section reports on an empirical study conducted to evaluate the testing effectiveness and efficiency of FICBP with different prioritization strengths.
A. Research Questions
The following two research questions motivated the empir-ical study.
RQ1: Which prioritization strength for FICBP results in the best testing effectiveness?The answer to this question will help us to decide which level of interaction coverage information to use for FICBP.
RQ2: How do the testers choose the appropriate prior-itization strength for FICBP in different testing environ-ments? The answer to this question will help us decide the most appropriate prioritization strength to use when facing different testing scenarios. Although it would obviously be very convenient if the cheapest level could deliver the most effective result, even if this is not the case, we would still like to know the best option to choose.
B. Subject Programs and Test Suites
[image:2.612.314.565.56.195.2]We used four open-source programs (obtained from the GNU FTP server [13]) written in the C language: FLEX, GREP,SED, andGZIP. TheFLEXprogram is a lexical anal-ysis generator; GREP and SED are widely-used command-line tools for searching and processing text-matching regular expressions; andGZIPis a compression utility. Each program has six versions. These programs have been widely used in TCP research [2, 9, 12, 14, 15].
TABLE I SUBJECTPROGRAMS
Program Factor-Level Model TestPool Information V0 V1 V2 V3 V4 V5
FLEX Model(263251,C1),|C1|= 32 500
Version 2.4.3(1993) 2.4.7(1994) 2.5.1(1995) 2.5.2(1996) 2.5.3(1996) 2.5.4(1997)
LOC 8,959 9,470 12,231 12,249 12,370 12,366
#Faults - 32 32 20 33 32
GREP Model(213342516181,C2),|C2|= 58 440
Version 2.0(1996) 2.2(1998) 2.3(1999) 2.4(1999) 2.5(2002) 2.7(2010)
LOC 8,163 11,988 12,724 12,826 20,838 58,344
#Faults - 56 58 54 58 59
SED Model(27314161101,C
3),|C3|= 58 324
Version 3.0.1(1998) 3.0.2(1998) 4.0.6(2003) 4.0.8(2003) 4.1.1(2004) 4.2(2009)
LOC 7,790 7,793 18,545 18,687 21,743 26,466
#Faults - 16 18 18 19 22
GZIP Model(21331,C
4),|C4|= 69 159
Version 1.0.7(1993) 1.1.2(1993) 1.2.2(1993) 1.2.3(1993) 1.2.4(1993) 1.3(1999)
LOC 4,324 4,521 5,048 5,059 5,178 5,682
#Faults - 8 8 7 7 7
Infrastructure Repository (SIR) [17]. Table I also shows the number of faults for each program based on mutation analy-sis [18], which were used by Henardet al. [2].
C. Results and Discussion
This section presents some results from comparing the test-ing effectiveness and efficiency among the FICBP techniques with different prioritization strengths (λ). Based on the results, we also offer some guidelines for testers using FICBP to prioritize ATCs. For ease of presentation, the notation λW is used to abbreviate FICBP with prioritization strengthλ(for example, 4W represents the FICBP technique with λ= 4).
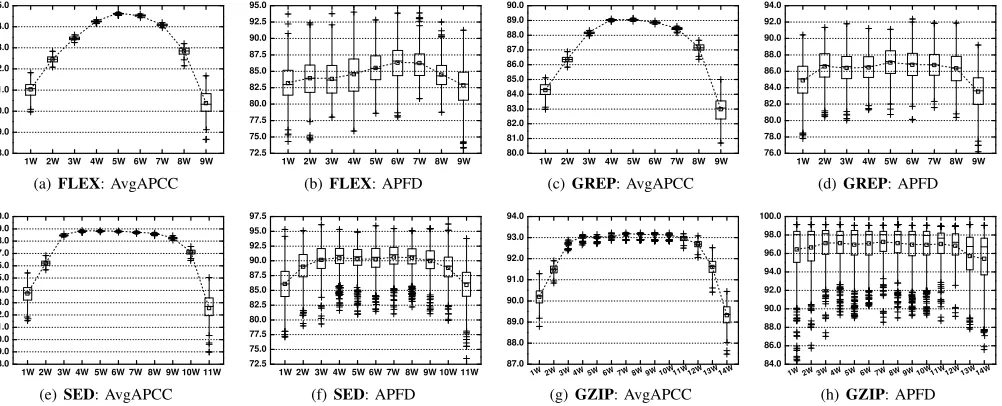
1) Efficacy Observations: For the evaluation metrics of test-ing efficacy, we consider two widely-used metrics: (a)Average Percentage ofλ-wise Combinations Covered(APCC) [9], and (b)Average Percentage of Faults Detected(APFD) [12]. Since the strengthλis a parameter required for APCC, in this paper we consider the average APCC values by consideringλvalues from 1 to 6, namely Average APCC(AvgAPCC) [19].
Figure 1 shows the effectiveness results of FICBPs with different prioritization strengths for programs FLEX,GREP, SED, and GZIP, respectively. Each program contains two subfigures: the first being the AvgAPCC results, and the second, APFD. Each box plot shows the mean (square in the box), median (line in the box), upper and lower quartile, and min/max AvgAPCC or APFD values for the prioritization technique. In each figure, the dashed line with squared points connects the mean values.
The experimental results show that different FICBP tech-niques have different performances for different subject pro-grams. We next attempt to summarize some common obser-vations from all subject programs.
• As the prioritization strength λ increases from 1 to k
(the maximum number of parameters), the AvgAPCC results can generally be divided into three parts: increas-ing; fluctuatincreas-ing; and decreasing. Formally, two strengths can be considered the turning points τ1 and τ2, where 1 ≤ τ1 ≤ τ2 ≤ k. This gives the three intervals
corresponding to the three trends: [1, τ1], [τ1, τ2], and [τ2, k]. Considering two prioritization strengths λ1, λ2
for FICBP, where1≤λ1< λ2≤k, the following trends can be identified:
λ1W is worse thanλ2W, if1≤λ1< λ2≤τ1; λ1W is similar toλ2W, ifτ1≤λ1< λ2≤τ2; λ1W is better thanλ2W, ifτ2≤λ1< λ2≤k.
(2)
The values ofτ1andτ2vary for different programs: With GREP, for example,τ1 is equal to 4, andτ2 is equal to 7; while for SED,τ1equals to 4, andτ2equals to 9. • The APFD situation is similar to that of AvgAPCC, with
the following two differences:
– Different turning points (τ1 and τ2 values) are
ob-tained compared with AvgAPCC. For example, with GREP, τ1 is equal to 3 while τ2 is equal to 8. Generally speaking, the APFD [τ1, τ2] interval is larger than that in AvgAPCC, which means that the fluctuating trend represents a larger proportion of the entire interval[1, k].
– Compared with AvgAPCC, the differences between highest and lowest APFDs appear less.
Figure 2 shows the ranking of the FICBP techniques with respect to the AvgAPCC and APFD, where each number rep-resents the prioritization strength. Each subfigure in Figure 2 contains some hexagons: FICBP techniques with no significant difference (according to the p-values [20]) are in the same hexagon, and those with significant differences are in dif-ferent hexagons. Additionally, the FICBPs with prioritization strengths from left to right become worse (as evaluated by the effect size Aˆ12 measure [20]), regardless of whether they are
in the same or different hexagons. Consider, for example, the APFD results for GREP(Figure 2(b)): two ordered sets are in the first two hexagons: O1 =⟨5,6⟩ andO2 =⟨6,7,2,3⟩. The difference between 5W and 6W inO1 is not statistically
significant, nor is the difference between any two FICBPs in
O2. Furthermore, 5W performs better than 6W, and 6W is
better than 7W, 2W, and 3W. From these figures, we have the following observations:
88.0 89.0 90.0 91.0 92.0 93.0 94.0 95.0 4W
3W 5W 6W 7W 8W 9W
2W 1W
(a)FLEX: AvgAPCC
72.5 75.0 77.5 80.0 82.5 85.0 87.5 90.0 92.5 95.0 4W
3W 5W 6W 7W 8W 9W
2W 1W
(b)FLEX: APFD
80.0 81.0 82.0 83.0 84.0 85.0 86.0 87.0 88.0 89.0 90.0 4W
3W 5W 6W 7W 8W 9W
2W 1W
(c)GREP: AvgAPCC
76.0 78.0 80.0 82.0 84.0 86.0 88.0 90.0 92.0 94.0 4W
3W 5W 6W 7W 8W 9W
2W 1W
(d)GREP: APFD
78.0 79.0 80.0 81.0 82.0 83.0 84.0 85.0 86.0 87.0 88.0 89.0 90.0 11W 10W 4W
3W 5W 6W 7W 8W 9W
2W 1W
(e) SED: AvgAPCC
72.5 75.0 77.5 80.0 82.5 85.0 87.5 90.0 92.5 95.0 97.5 11W 10W 4W
3W 5W 6W 7W 8W 9W
2W 1W
(f)SED: APFD
87.0 88.0 89.0 90.0 91.0 92.0 93.0 94.0 14W 4W
3W 5W 6W 7W 8W 9W 2W
1W 10W11W12W13W
(g)GZIP: AvgAPCC
84.0 86.0 88.0 90.0 92.0 94.0 96.0 98.0 100.0 14W 4W
3W 5W 6W 7W 8W 9W 2W
1W 10W11W12W13W
[image:4.612.60.561.50.253.2](h)GZIP: APFD
Fig. 1. Results for programFLEX.
prioritization strength (λ = 1) has the second worst. The results are similar for APFD: FICBP techniques with λ = 1 and λ = k generally have the two worst performances — an exception being forGZIP, for which 13W is the second worst, and 1W is actually the second best.
• In most cases, the FICBP techniques generally have the best (or close to best) performance, in terms of both AvgAPCC and APFD, when the prioritization strengthλ
is approximately equal to ⌈k2⌉. For example, forFLEX and GREP with k = 9, the FICBP techniques 5W or
ϱ ϲ ϰ ϳ ϯ ϴ Ϯ ϭ ϵ
ϲ ϳ ϱ ϰ ϴ Ϯ ϯ ϭ ϵ ǀŐW
W&
(a) Program FLEX(k= 9)
ϱ ϰ ϲ ϳ ϯ ϴ Ϯ ϭ ϵ
ϱ ϲ ϳ Ϯ ϯ ϰ ϴ ϭ ϵ ǀŐW
W&
(b)Program GREP(k= 9)
ϲ ϳ ϵ ϭϬ Ϯ ϭ
ϳ ϰ ǀŐW
W&
ϴ ϯ ϭϭ
ϴ ϱ ϲ ϯ ϵ Ϯ ϭϬ ϭϭ ϭ ϱ ϰ
(c)Program SED(k= 11)
ǀŐW ϳ ϵ ϴ ϭϬ ϰ ϱ ϲ ϭϭ ϯ ϭϮ ϭϯ Ϯ ϭ ϭϰ
W& ϯ ϳ ϴ ϰ ϱ ϲ ϵ ϭϬ ϭ Ϯ ϭϭ ϭϮ ϭϯ ϭϰ
(d)Program GZIP(k= 14)
Fig. 2. Statistical ranking of the FICBP techniques.
6W are generally the best performers, for both AvgAPCC and APFD. For SED with k = 11, 5W has the best AvgAPCC performance, and is in the top four in terms of APFD (it should also be noted that there is no statistically significant difference amongst the best five FICBP techniques for APFD). For GZIP(k= 14), 7W, 8W, and 9W are in the top three techniques in terms of AvgAPCC, and are in the top seven in terms of APFD (there is effectively no statistically significant difference among the top eight techniques for APFD).
To answerRQ1, the prioritization strength is recommended to be set at approximately ⌈k2⌉.
2) Efficiency Observations: Table II presents the prioritiza-tion cost of each FICBP technique for each subject program. Each cell in the table is a pair µ/ρ, where µ is the mean execution time, and ρ is standard deviation (calculated over the 100 independent runs performed per technique). It can be observed from the table that there is a turning point τ
satisfying the following:
• For two prioritization strengths λ1 and λ2 (where 1 ≤ λ1< λ2≤k), when1≤λ1< λ2≤τ, the prioritization
cost forλ2W is greater than that for λ1W.
• Whenτ ≤λ1≤λ2≤k,λ1W has a higher prioritization cost thanλ2W.
According to the mean prioritization time, µ, the turning point τ is generally equal to about half of the number of parameters: τ = ⌈k2⌉. In other words, when λ = τ, the prioritization time of λW is highest. Moreover, FICBP with
λ=kgenerally requires the least prioritization time among all possible prioritization strengths, with 1W requiring the second least.
[image:4.612.83.267.446.691.2]TABLE II
PRIORITIZATION TIME(µ/ρ)OF EACHFICBPTECHNIQUE(IN MILLISECOND)
FICBP Technique Subject Program
FLEX GREP SED GZIP
1W 35/6 32/8 22/7 17/8
2W 94/8 82/7 77/8 58/9
3W 234/21 202/6 274/31 250/10 4W 402/8 379/50 647/15 884/62 5W 452/16 410/13 1017/22 1865/29 6W 337/38 334/35 1100/24 3065/40 7W 174/8 213/9 980/21 4088/96
8W 62/7 77/7 573/16 3871/35
9W 27/9 28/6 257/11 2947/32
10W – – 84/8 1684/29
11W – – 20/6 734/20
12W – – – 187/10
13W – – – 38/7
14W – – – 8/6
and 6W requires 1.1 seconds for GZIP. In other words, FICBP with λ = ⌈k2⌉ seems comparable to that with other prioritization strengths for practical testing, according to the prioritization costs.
Based on these results and discussions, the answer to RQ2, therefore, is that no FICBP technique has the best testing effectiveness and efficiency. In other words, testing effectiveness and efficiency results seem contradictory when applying the FICBP technique to the prioritization of ATC-s. Nonetheless, the FICBP techniques with the best testing effectiveness require comparable prioritization time to other FICBP techniques, allowing us to conclude that they are the most cost-effective, especially when testing resources (such as prioritization cost) are not limited.
In conclusion, when applying the FICBP technique to prior-itize ATCs, we recommend setting the prioritization strength
λto approximately⌈k2⌉when testing resources are sufficient. However, when testing resources are limited, a small or high prioritization strength is suggested for FICBP.
IV. THREATS TOVALIDITY
In spite of our best efforts, our experiments may face some threats to validity. There are three potential threats to the external validity, listed as follows:
1) Subject Program Threat:We only examined four subject programs in this study, written in the C language, each of which being of a relatively medium size. However, the programs are all relatively small with respect to the number of parameters. Nevertheless, all the programs were obtained from a well-studied repository [13]. As discussed by Petke et al.[9], constraints could significantly reduce the number of parameters in the SUT. In other words, when the SUT contains a large number of parameters, constraints could be adopted to remove many of them. Therefore, when testing an SUT with many parameters, conclusions obtained from this study could also be relevant.
2) ATC Threat: We used the test suite of ATCs obtained from the SIR [17], for each program. These test suites were constructed using the Test Specification Language (TSL) [21]. There are many other types of ATC sets in the field of
combinatorial testing [4], includingcovering arrays[22], that could be constructed by many popular tools such asCovering Arrays by Simulated Annealing (CASA) [23].
3) Randomness Threat: Since FICBP contains some ran-domness, we ran all techniques 100 times, and also adopted inferential statistics to compare the results. This should mini-mize the validity threats related to the randomness.
In addition to the steps taken to address the potential threats to validity, further studies will be conducted in the future using more programs with more parameters, and more ATC test suites.
V. CONCLUSIONS ANDFUTUREWORK
ATCP aims at achieving higher rates of fault detection, and has been widely used to prioritize ATCs that are derived by modeling the system under test. One well-known method of ATCP is the fixed-strength interaction coverage based prioritization (FICBP), which chooses an element from the candidates as the next ATC such that it covers the largest number of fixed-strength level combinations that have not yet been covered by previously selected ATCs. It requires a fixed strength as the input, namelyprioritization strength. Previous studies have generally used prioritization strengths ranging in value from 1 to 6. To the best of our knowledge, however, no other study has yet examined whether or not these values are most appropriate. In this paper, we have attempted to answer this question. Based on our experimental results, we have the following observations:
• Asλincreases, the FICBP testing effectiveness generally increases, then reaches a peak, and then fluctuates around the peak. After this, the effectiveness generally decreases. • The FICBP techniques generally have worst performance when λ = 1 and λ = k, where k is the number of parameters that influence the system under test, regardless of the rates of interaction coverage and fault detection. • If testers attempt to apply FICBP to the prioritization of
ATCs, it is recommended that they set the prioritization strength λ to be approximately equal to half of the number of parameters, i.e., λ = ⌈k
2⌉, where k is the
number of parameters, especially when testing resources are not limited. However, when testing resources are not sufficient, a small or large prioritization strength is recommended.
The τ-wise covering array [22] is a special set of ATCs that covers all valid τ-wise level combinations, where τ is called the generation strength. As discussed in this paper, the prioritization strength is used in FICBP. Therefore, it is very promising to investigate the relationship between the generation strength and prioritization strength, which would provide some helpful insights for combinatorial testing users when using FICBP to prioritize covering arrays.
ACKNOWLEDGMENT
China under grant nos. 61502205, 61202110, and 71471092, the Natural Science Foundation of the Jiangsu Higher Educa-tion InstituEduca-tions of China under grant no. 15KJB520007, the Senior Personnel Scientific Research Foundation of Jiangsu University under grant no. 14JDG039, and the Ningbo Science and Technology Bureau under grant no. 2014A35006. This work is also supported by the Young Backbone Teacher Cultivation Project of Jiangsu University, and the sponsorship of Jiangsu Overseas Visiting Scholar Program for University Prominent Young & Middle-aged Teachers and Presidents. Dave Towey acknowledges the financial support from the Artificial Intelligence and Optimisation Research Group of the University of Nottingham Ningbo China, the International Doctoral Innovation Centre, the Ningbo Education Bureau, the Ningbo Science and Technology Bureau, and the University of Nottingham.
REFERENCES
[1] M. Grindal, B. Lindstr¨om, J. Offutt, and S. F. Andler, “An evaluation of combination strategies for test case s-election,”Empirical Software Engineering, vol. 11, no. 4, pp. 583–611, 2006.
[2] C. Henard, M. Papadakis, M. Harman, Y. Jia, and Y. L. Traon, “Comparing white-box and black-box test prioritization,” in Proceedings of the 38th International Conference on Software Engineering (ICSE’16), 2016, pp. 523–534.
[3] C. Henard, M. Papadakis, G. Perrouin, J. Klein, P. Hey-mans, and Y. L. Traon, “Bypassing the combinatorial explosion: Using similarity to generate and prioritize t-wise test configurations for software product lines,”IEEE Transactions on Software Engineering, vol. 40, no. 7, pp. 650–670, 2014.
[4] C. Nie and H. Leung, “A survey of combinatorial test-ing,” ACM Computer Survey, vol. 43, no. 2, pp. 11:1– 11:29, 2011.
[5] R. Huang, W. Zong, D. Towey, Y. Zhou, and J. Chen, “An empirical examination of abstract test case priori-tization techniques,” in Proceedings of the IEEE/ACM 39th International Conference on Software Engineering Companion (ICSE-C’17), 2017, pp. 141–143.
[6] M. Al-Hajjaji, T. Th¨um, J. Meinicke, M. Lochau, and G. Saake, “Similarity-based prioritization in software product-line testing,” inProceedings of 18th Internation-al Software Product Line Conference (SPLC’14), 2014, pp. 197–206.
[7] R. C. Bryce and A. M. Memon, “Test suite prioritization by interaction coverage,” in Proceedings of the Work-shop on Domain Specific Approaches to Software Test Automation (DoSTA’07), 2007, pp. 1–7.
[8] R. C. Bryce, S. Sampath, and A. M. Memon, “Develop-ing a s“Develop-ingle model and test prioritization strategies for event-driven software,” IEEE Transactions on Software Engineering, vol. 37, no. 1, pp. 48–64, 2011.
[9] J. Petke, M. B. Cohen, M. Harman, and S. Yoo, “Practical combinatorial interaction testing: Empirical findings on
efficiency and early fault detection,” IEEE Transactions on Software Engineering, vol. 41, no. 9, pp. 901–924, 2015.
[10] R. Huang, X. Xie, D. Towey, T. Y. Chen, Y. Lu, and J. Chen, “Prioritization of combinatorial test cases by incremental interaction coverage,” International Journal of Software Engineering and Knowledge Engineering, vol. 23, no. 10, pp. 1427–1457, 2013.
[11] R. Huang, J. Chen, T. Zhang, R. Wang, and Y. Lu, “Prioritizing variable-strength covering array,” in Pro-ceedings of the IEEE 37th Annual Computer Software and Applications Conference (COMPSAC’13), 2013, pp. 502–601.
[12] G. Rothermel, R. H. Untch, C. Chu, and M. J. Harrold, “Prioritizing test cases for regression testing,” IEEE Transactions on Software Engineering, vol. 27, no. 10, pp. 929–948, 2001.
[13] GNU FTP Server. http://ftp.gnu.org/.
[14] X. Qu, M. B. Cohen, and K. M. Woolf, “Combinato-rial interaction regression testing: A study of test case generation and prioritization,” in Proceedings of the 23rd International Conference on Software Maintenance (ICSM’07), 2007, pp. 255–264.
[15] B. Jiang, Z. Zhang, W. K. Chan, and T. H. Tse, “Adaptive random test case prioritization,” in Proceedings of the 24th IEEE/ACM International Conference on Automated Software Engineering (ASE’09), 2009, pp. 233–244. [16] cloc: Count Lines of Code. http://cloc.sourceforge.net/. [17] H. Do, S. G. Elbaum, and G. Rothermel, “Supporting
controlled experimentation with testing techniques: An infrastructure and its potential impact,” Empirical Soft-ware Engineering, vol. 10, no. 4, pp. 405–435, 2005. [18] Y. Jia and M. Harman, “An analysis and survey of the
development of mutation testing,”IEEE Transactions on Software Engineering, vol. 37, no. 5, pp. 649–678, 2011. [19] R. Huang, Y. Zhou, W. Zong, D. Towey, and J. Chen, “An empirical comparison of similarity measures for abstract test case prioritization,” inProceedings of the IEEE 41st Annual Computer Software and Applications Conference (COMPSAC’17), 2017, pp. 3–12.
[20] A. Arcuri and L. Briand, “A hitchhiker’s guide to s-tatistical tests for assessing randomized algorithms in software engineering,”Software Testing, Verification and Reliability, vol. 24, no. 3, pp. 219–250, 2014.
[21] T. J. Ostrand and M. J. Balcer, “The category-partition method for specifying and generating fuctional tests,” Communications of the ACM, vol. 31, no. 6, pp. 676– 686, 1988.
[22] M. B. Cohen, P. B. Gibbons, W. B. Mugridge, and C. J. Colbourn, “Constructing test suites for interaction test-ing,” inProceedings of the 25th International Conference on Software Engineering (ICSE’03), 2003, pp. 38–48. [23] B. J. Garvin, M. B. Cohen, and M. B. Dwyer,