1
Structure-properties relationships in fibre drawing of
bioactive phosphate glasses
Laura Muñoz-Senovilla1, Francisco Muñoz1,*, Gregory Tricot2, Ifty Ahmed3, Andrew J. Parsons3
1
Ceramics and Glass Institute (CSIC), Kelsen 5, 28049 Madrid (Spain)
2
LASIR UMR CNRS 8516, Université de Lille 1, 59655 Villeneuve d’Ascq Cedex (France)
3
Faculty of Engineering, University of Nottingham, Nottingham NG7 2RD (United Kingdom)
*Corresponding author: E-mail: [email protected] Tel: +34917355840
2 Abstract
New bioactive phosphate glasses suitable for continuous fibre production are investigated in this work. The structure of both bulk and fibres from Na2O-CaO-MgO-P2O5 glasses has been studied by means of Raman and 31P and 23Na Nuclear Magnetic Resonance spectroscopies, and the structural results have been correlated with the mechanical properties of the fibres and the dissolution rate of the bulk glasses. It has been observed that the mechanical properties of the phosphate glass fibres are influenced by the glass network connectivity, whilst the dissolution rates are governed by the Qi speciation of the PO4 units. As seen in previous studies, molar volume seems to play an important role in the fragility behaviour of phosphate glasses. Here, a lower molar volume resulting from the increase in the oxygen packing density, hinders the cooperative flow of the PO4 units throughout the glass network and, therefore, causes a reduction in the kinetic fragility.
3 1. Introduction
Phosphate-based glass fibres are a class of bioactive glasses that have generated considerable interest due to their potential to be used as active materials, either directly or as reinforcement phase, for resorbable implants and for hard and soft tissue engineering applications [1-4]. Their capacity to dissolve completely in aqueous media, through a surface erosion process that allows the maintenance of properties during degradation [5, 6], and the ability to control their degradation rates and mechanical properties through tailoring the glass composition are valuable properties. However, phosphate glasses present a higher kinetic fragility when compared with silicate glasses, which narrows their fibre drawing temperature range and makes them prone to crystallization when held in this range.
In order to design new bioactive phosphate glasses suitable for continuous fibre production and industrial implementation, it is necessary to determine the glass network structure and a complete knowledge of the viscosity behaviour with temperature. These fundamental studies will allow prediction of the drawing point with enough accuracy to support fibre processing and indicate preferential glass structures. Accordingly, a big effort has been done so far to determine the structure in several bioactive phosphate glasses for fibre drawing by means of Nuclear Magnetic Resonance and Raman spectroscopies [7-9]. But only a few works have been published about structural studies performed directly on the fibres due to the complexity of their determination [7]. More recently, several works have been published on the improvement of processing conditions for fibre drawing based on kinetic fragility determination [10, 11], enhancing the important role of the structure to predict the behaviour of bioactive glasses during processing [12].
4 properties and the viscosity behaviour of these glasses were studied through combined quasi-static and rotation methods and the theoretical fibre drawing points and fragility of the glasses were determined [11].
In order to highlight the importance of viscosity and structure on the design of bioactive phosphate glasses suitable for fibre drawing, this work aims to relate macroscopic properties, such as kinetic fragility (m) and molar volume (Vm), with the glass fibre structure determined directly by means of Raman and 31P and 23Na Nuclear Magnetic Resonance (NMR) spectroscopy. The structural features will be compared with those observed in the bulk glasses to elucidate if changes in the glass network structure occur during fibre processing. Static 31P nuclear magnetic resonance will be employed also, to obtain experimental evidence of the anisotropy generated on the glass fibre due to the mechanical load applied during fibre drawing. The structural results will be related to empirical observations made during fibre drawing, such as pulling temperature and the ease of continuous fibre manufacture. Additionally, the mechanical properties of the fibres and the dissolution rate of the glasses in phosphate buffered saline (PBS) media will be related to compositional changes in the glass network structure.
2. Materials and methodology
2.1 Glass production
5 The glasses were annealed at 10ºC above their glass transition temperature before sectioning into parallel faced, ~10mm long rods for durability tests.
2.2 Glass characterization
Glass density was measured by helium pycnometry in a Micromeritics AccuPyc 1330 on bulk samples (±1 Kg.m-3). The molar volume (Vm) was calculated by using the relation between the molar mass (M) and the density () of the glass (Vm=M-1).
23
Na magic angle spinning (MAS) NMR was performed on a Bruker Avance II spectrometer
operating at 105.87 MHz (9.4 T). The pulse length was 2 μs (corresponding to a /6 flip
angle) and a 2 s delay time was used. A total number of 256 scans were accumulated at a spinning rate of 12.5 kHz on the bulk glass. NaCl 1M was used as reference. The 23Na NMR spectra were simulated with the Dmfit software [13] using the Czjzek [14] distribution models.
31
P MAS-NMR spectra were recorded on a Bruker Avance II spectrometer operating at 161.96 MHz (9.4 T). The pulse length was 2 µs (corresponding to a /5 flip angle) and a 120
6 Raman spectroscopy analyses were performed on both bulk samples and single fibres on a
Witec Alpha300RA Raman-AFM confocal spectrometer with 532 nm laser wavelength excitation and 39 mW power in the range of 220-3800 cm-1. The laser polarization angle was located along the x-axis and microscope lens of 100 augments was used in all cases. The focus was adjusted to lie well beneath the surface of a single fibre in order to avoid any possible degradation on the fibre surface due to ambient moisture. The precision in the
determination of the Raman shifts is 1 cm-1.
2.3 Degradation studies
Degradation tests via hydrolysis were performed according to the standard BS EN ISO 10993-13:2010 on three replicate samples per glass composition, each sample being ~ 9 mm diameter and 10 mm length. The annealed samples were placed laid on their side at the bottom of the vial into 30 ml glass vials filled with phosphate buffered saline solution (PBS) (pH = 7.4±0.2) as degradation medium, and maintained at a constant temperature of 37°C. The samples were blot dried at each time point before taking weight and dimensional measurements. The time points that were used were 1, 3, 7, 14, 21, 28, 42, 56 and 84 days. After each time point measurement the solution was discarded and replaced with fresh PBS solution in order to maintain the pH. Before discarding the solution, the pH was measured in order to check for deviations in pH during the degradation test. Glass degradation has been expressed in terms of dissolution rate (DR) by equation (1):
DR =(mi – md)/(SAt) (1)
7 2.4. Glass fibre production
Continuous fibres with diameters ranging from approximately 10 to 25 m were produced via a melt-draw spinning process using a dedicated in-house facility. The speed was varied from 780 to 1620 rpm for each composition, in order to ensure fibres were obtained with similar diameters for strength comparison. The pulling temperature was adjusted to approximately 150ºC above the liquidus temperature in order to overcome the temperature gradient between the thermocouple controller and the actual temperature at the bottom of the platinum crucible.
2.5 Single Fibre Tensile Test (SFTT)
Tensile testing of single filaments was conducted in accordance with BS ISO 11566 by using a single fibre tensile tester Diastron LEX-810 (UK) at room temperature with a load capacity
of 0.2 N and a speed of 0.017 mms-1. A laser scan micrometre Mitutoyo LSM6200 attached to the tensile tester was employed prior to testing for the determination of the individual fibre diameter. The laser scan micrometre was calibrated with phosphate glass fibres of known diameters previously determined by SEM. The precision in diameter determination is considered to be ± 0.3 µm. At least 40 fibres were tested with a gauge length of 25 mm. Tensile strength (δf) and tensile modulus (Ef) were calculated following equations (2) and (3):
f = Ff/Af (2)
Ef = [(AF/Af)(L/L)]/[1-K(F/L)] (3)
Ff is the maximum tensile at break of the fibre and Af is the cross-section area of the filament.
On the other hand, ΔF and ΔL are the respective differences in force and length
corresponding to the strain limits selected in accordance with BS ISO 11566 and depending
on the nominal strain at break of the fibre, with L being the gauge length and K the system
8 The effect of composition on the tensile strength and tensile modulus was studied. Due to the brittle character of phosphate based glass fibres, a Weibull distribution was employed to statistically characterize the failure mode of the fibres via the statistical software Minitab ® 15.
3. Results and discussion
3.1 Structural Characterization
3.1.1 Magic Angle Spinning Nuclear Magnetic Resonance (MAS-NMR)
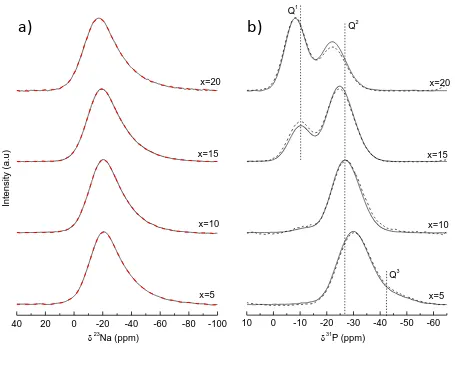
The 23Na and 31P MAS NMR spectra of the xNa2O.16CaO.24MgO.(60-x) P2O5 glass series are depicted in Figure 1a) and b), respectively.
9 in the degree of network polymerization within the structure produces an increase in the 23Na chemical shift [16]. The phosphate glasses show a different trend, where the variation in CQ is not significant, suggesting that the chemical environment around the sodium cations is constant. These results indicate that the Na+ ions are distributed around the phosphate units independently of the former oxide content and thus of the glass composition.
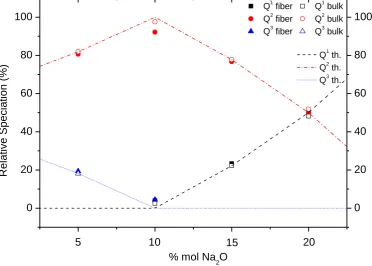
The evolution of the phosphate network is monitored by 31P NMR in Fig. 1b. Three signals can be observed at -42 ppm, between -30 and -20 ppm and at -5 ppm. These three resonances are attributed to different Qi sites. Since less shielded signals indicate an electronic density redistribution around phosphorous (with changing bridging to non-bridging oxygen), the three signals can be assigned to Q3, Q2 and Q1 site in a good agreement with previous studies [17]. In order to study the evolution of Qi units as a function of composition and to compare them with the theoretical values, the relative fraction of each species has been plotted as function of Na2O molar percentage in Figure 2. It can be observed that, as expected, Na2O content increases the glass network depolymerisation. Progressively, the presence of Qi units with fewer bridging oxygens, i.e. Q1, occurs at the expense of Q3 and Q2 groups. For both the bulk glass and the fibres, the relative speciation is very close to the theoretical values predicted by the structural model based on the nominal composition that was described following the work of Van Wazer [18] and is represented by equations (4) and (5), where x
represents the molar fraction of a modifier oxide in a glass with general composition x(R2O
or R’O)-(1-x)P2O5:
f(Q2)=x/(1-x); f(Q3)=(1-2x)/(1-x) where 0x0.5 (4)
f(Q1)=(2x-1)/(1-x); f(Q2)=(2-3x)/(1-x) where 0.5x0.67 (5)
10 bulk glasses at the expense of Q2 groups’ proportion. It is worth noting that for metaphosphate glass fibres composition (x=10), where the tetrahedral units should be of Q2 type (except for a small proportion of Q1 ending groups), a low but not negligible proportion of Q3 groups appear. The presence of these species could be caused by a disproportionation reaction of the type of Q2 groups into Q1 and Q3 units, causing the appearance of Q1 and Q3 units when compared with the bulk glass. The reaction is described in equation (6) [18]:
2Q2 Q1 + Q3 (6)
Q1 site disproportionation reactions are usually observed in pyrophosphate glasses, though a case of Q2 disproportionation has also been reported in a calcium metaphosphate composition [19].
The relative speciation of Qi units has been used to calculate the experimental P2O5 molar fraction present in the glass through equations (4) and (5). The values obtained are equal to the nominal ones, except for the x=10 where a deviation of 2 mol % on the P2O5 content has been observed. The experimental molar fraction of P2O5 has been used to calculate the network connectivity of the glasses (NC), defined as the number of bridging oxygens (BO) per network forming element [20], the average chain length (ñ) according to Bunker et al. [20], as well as the oxygen packing density [O] in the glass [21]. NC, ñ and [O] were calculated according to equations (7), (8) and (9), respectively:
(7)
11 (9)
where [M2IO] and [MIIO] are the molar fractions of the network modifiers and [P2O5] is the molar fraction of phosphate network forming oxide. is the density of the glass, (O) is the
number of oxygen atoms in the glass composition and M is the molar mass of the glass.
The values obtained and represented in Figures 3 and 4 are close to the nominal ones due to the similarity between the experimental and the nominal composition.
As seen in the 31P MAS-NMR spectra, the replacement of P2O5 by Na2O causes network depolymerisation. Progressively, the increase of the Qi units with fewer bridging oxygens, i.e. from Q3 to Q2 and Q1, results in shorter phosphate chains and lower network connectivity as Figure 3 shows. The depolymerisation caused by the addition of Na2O as modifier oxide induces a contraction of the glass network that leads to the densification of the glass and thus to a decrease in the volume occupied by one mole of glass, as depicted in Figure 4. The subsequent increasing amount of Na+ will force these ions to share the available NBO, resulting in coordination polyhedra that have to share corners and edges increasing the oxygen packing density (cf. Fig. 4).
The 31P chemical shift anisotropy (δCSA) provides information about the conformation of the Qi units. δCSA was determined from the integration of the MAS NMR spectra including the spinning sidebands using dmfit software [13]. Larger values of this tensor are found in structures in which there is a prevalence of rings arrangements instead of phosphate chains [17, 22]. In Table 2 the δCSA values obtained for the fibres and bulk glasses for Q2 units are collected.
12 Bulk glasses are isotropic materials with respect to their structure and physical properties. However, they can develop a certain degree of anisotropy as a result of the stress applied during conversion into glass fibres.
In the past, the orientation and alignment of the weakest bonds within the glass structure along the axis of the fibre have been discussed. Goldstein and Davies developed the concept of glasses as polymers consisting of glass forming atoms connected by oxygen that allows the formation of fibres with oriented linear chains, based on the similarity found between diffraction patterns of sodium metaphosphate glass fibres and organic fibres with oriented chain molecules [23]. Subsequently, Milberg and Daly investigated the structure of fibres made from the same glass composition and the results indicate that the sodium metaphosphate fibres were made up of long chains that are preferentially orientated along the fibre main axis, thus a strong structural anisotropy results from the rearrangements of the structural units [24]. Furthermore, Muñoz et al. [25] have studied the anisotropy of phosphate glass fibres through the measurements of optical birefringence and have correlated it with the drawing stress and the diameter of the drawn fibre. A permanent birefringence is observed in the case of glass fibres drawn by applying high shear stresses as a consequence of the alignment of anisotropic flow units.
13 in the 31P MAS NMR spectra of the bulk glass and fibres, -131 ppm and -130 ppm respectively, does not shed light on the discussion. On the other hand, the line shape of the minor amount of Q1 units present in the glass, as discussed above, will overlap with the Q2 dominating pattern. Braun et al. [26] have studied extruded calcium metaphosphate glasses by static and 2D MAS NMR. As in these glasses, they conclude that it is almost impossible to verify a noticeable local structural alignment of the phosphate chains in the glass fibres with ordinary static NMR.
Furthermore, it is known that different cooling rates might have a strong influence on the
fictive temperature of the fibers [27]. Within the scope of the present study we have not
looked at specific cooling rates in a wide enough range as that would be quite difficult to
determine in a drawn fiber. It is likely that the bulk glass and fibers have different fictive
temperatures though being highly difficulty to estimate a cooling rate for the fiber drawing
process we have not attempted here to quantify its effect. In any case, we cannot elucidate whether the chains of PO4 tetrahedra present in the glass fibres are randomly distributed or lie along the fibre main axis direction, but the good mechanical properties observed in these fibres that will be discussed in detail in section 3.3 may suggest that a structural orientation of the fibres is taking place.
3.1.2 Raman Spectroscopy
Raman spectroscopy was employed as a complementary method to study the structure of the bulk glasses and that of the fibres, specifically to determine if any changes occurred in the
14 appearing at about 700 cm-1 and 1170 cm-1, attributed to the symmetric stretching modes of phosphorous to bridging (P-O-P) and to non-bridging oxygen bonds (O-P-O) in Q2 units, respectively [28, 29]. The corresponding asymmetric modes appear as shoulders at ca. 790 cm-1 and 1260 cm-1 [28, 29]. The progression from a higher cross-linked Q3 network to a glass network based on chains or rings made up of Q2 units and a depolymerised glass with the presence of Q2 units and Q1 (not only as a chain terminal groups but forming pyrophosphate units) as the [O]/[P] ratio increases, can be followed by observing two significant bands. The band attributed to O-P-O bonds in Q1 units (~1050 cm-1) gradually increases in intensity and gets broader, while the band attributed to the symmetric stretching mode of P=O bonds in Q3 groups (~1300 cm-1) progressively disappears. Additionally, the P-O bond bending mode of Q2 and Q1 units appears as a broad signal in the range of 200 cm-1 to 400 cm-1 [28, 29]. If we look at the frequency of the dominant stretching modes of phosphorous linked to non-bridging oxygens from x=5 to x=20, we can observe a progressive
change from the mode attributed to P=O bonds in Q3 to the ones of O-P-O links in Q2 and further in P-O- in Q1 groups. This is an indication of the depolymerisation of the phosphate network, as has also been seen by NMR, and which is related to the progressive weakening of
the bonds between phosphorous and non-bridging oxygens upon sodium addition.
15 3.2 Glass solubility
While the poor chemical durability of phosphate glasses in aqueous environments has restricted their industrial applications, it was one of the main motivations for their use as temporary bone fracture fixation devices. The dissolution rate of phosphate glasses depends on the chemical composition, the thermal history and the ratio of surface area to volume, but also on the pH of the degradation medium and the degradation temperature [30].
After 84 days of experiment, a decrease in dissolution rate was observed with increasing Na2O content, as depicted in Figure 7. This trend is reflected in the pH values at each time point, with slightly lower values observed for the faster degrading glasses (average pH at
solution change for x=5 was 7.22, for x=10 it was 7.30, for x =15 it was 7.33 and for x=20 it
was 7.34, c.f. PBS initial pH of 7.4). The dissolution rate values are in the range of glasses studied previously that have a similar composition [31]. It has been suggested by Parsons et
al. that a degradation rate of around 5x10⁻¹⁰ Kgm-2s-1 or lower is required for phosphate glass fibres for bone repair applications [32]. The most durable glass found in this study, x=20, is in the range of the suggested optimum rate of performance.
16
structure and formation of Q1 groups make the glasses less susceptible to hydration as in the present case. As seen in the structural characterization, with increasing Na2O content the glass network depolymerises. The proportion of Q1 units increases at the expense of Q3 and Q2 groups, thus increasing the resistance to dissolution. Phosphate glass with 55 P2O5 mol % (x=5) has the highest dissolution rate with a value of 1.7 10-9 Kgm-2s-1. This can be explained based on the presence of potentially hydrolysable P-O-P bonds in Q3 groups for this glass composition. In the meta- and polyphosphate region the dissolution rate decreases with decreasing former oxide. As discussed above, the decrease in the fraction of more hydrolysable Q2 species, along with an increase on the oxygen packing density decreases the dissolution rate and thus enhances the chemical durability.
3.3 Mechanical properties of glass fibres
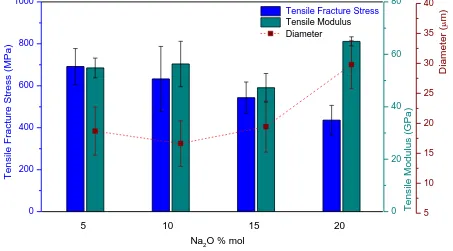
Phosphate glass fibres are brittle in nature, as it is seen by their low values of strain to failure. Figure 8 summarises the effect of increasing Na2O on the mechanical properties of glass fibres such as tensile fracture stress and modulus. A decrease in tensile fracture stress was seen with increasing Na2O content. The best mechanical properties of the phosphate glass fibres tested are given by the glass with higher network connectivity and lower oxygen packing density that corresponds to the glass with higher phosphate content (x=5). This is consistent with previous results obtained in similar bioactive glass systems [31]. The tensile modulus of a material is an intrinsic property and should follow the same trend as tensile fracture, but in the glasses under study the moduli of x=20 shows the highest value. The shorter chains present in this glass composition, as ñ shows, will be able to pack together tighter and thus create a more durable glass with greater tensile modulus.
17 multiple speeds were used in order to obtain fibres with comparable diameters, it was not possible to draw this fibre type successfully at a small enough diameter. The average diameter is about 10 µm higher for x=20 and this could contribute to the reduced strength values. However, the fibre diameter is not the only factor that could have an impact on the tensile strength. Lund et al. [37] argued that the glass structure could influence the normal strength of glass fibres in a different way. As is it known, the structural anisotropy of continuous glass fibres, i.e. orientation of structural units along the fibre axis, increases with the drawing speed, and enhances their tensile strength. As explained above, the fibres selected were those with closer diameters to the ones found for the remaining glass compositions. This could indirectly involve the selection of fibres drawn at the higher speeds due to the inverse relation between drawing speed and continuous fibre diameter, and therefore imply a higher structural anisotropy on these fibres that finally results in the comparably low strength of the x=20 glass.
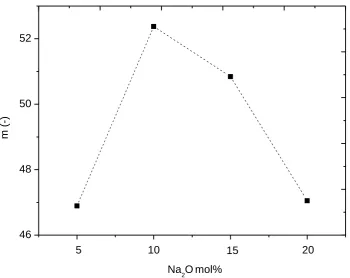
The Weibull distribution is a well-known and accepted statistical tool used to characterize the failure mode of brittle fibres [38]. Weibull modulus (m) indicates the fibre reliability. If this parameter takes large values, then the failure is predictable. However, a low Weibull modulus would introduce uncertainty about the strength of the fibre [39]. Weibull modulus and normalising stress for the bioactive glass fibres, together with the tensile fracture stress values are collected in Table 3.
18 shows the best compromise between both Weibull modulus and tensile fracture stress is that of the glass fibres with highest former oxide content, x=5 glass.
3.4 Kinetic fragility and fibre drawing ability
The fragility values that are going to be discussed here in terms of the structural features have been calculated from experimental viscosity data as determined by rotation and quasi-static viscosity methods along the high and low temperature range, respectively [11]. The values are reproduced in Figure 9 for convenience. The combination of these two techniques allows
19 determination by spectroscopic techniques, gives rise to a more branched and interconnected glass network that should be responsible for the significantly lower value of fragility. However, as suggested above, this value could be underestimated when taking into account experimental viscosity values nearby the transition range, and thus the drop on fragility could be less pronounced.
The fibre drawing ability of phosphate glasses strongly depends on the structure of the glass, in particular its Qi speciation [43]. As 31P MAS NMR spectra have shown, no significant changes occur in the glass network structure during fibre drawing. Therefore, the properties or structural features determined in the bulk glasses are applicable to the fibres structure. A less fragile behaviour will lead to a wider temperature window range for fibre drawing since the glass will have a lower tendency to crystallize. This extended temperature range together with compositions with elevated average chain length, i.e. glasses with a structure heavily dominated by Q2 species, should provide a glass that is easier to draw into fibres. In this work, the fibre drawing was carried out by varying the temperature to modulate the glass flow coming through the crucible filament. With increasing alkali content, the optimum temperature required to draw continuous glass fibres gets lower. Glass compositions x=10 and x=15 were the easiest to draw into fibres because of their polymeric nature due to the high proportion of Q2 groups. Fibre drawing was almost continuous and gave around 80% and 60% conversion of glass into fibre, respectively. However, it was also possible to draw fibres from x=5 and x=20 glass compositions, which present the lowest kinetic fragility values of the glass series under study (c.f. Fig. 9).
20 main reason for the higher diameters observed for the x=20 fibres, as discussed in section 3.3. Even though the glass with x=5 presents a lower proportion of Q2 groups compared with metaphosphate composition, it has Q3 groups that provide a higher degree of connectivity and a higher tensile strength. These glass network structural features may contribute to withstand the stress from the pulling process, even at the high temperatures employed to draw the fibres due to the higher viscosity of a glass with 55 mol % of P2O5.
4. Conclusions
The structural studies performed in the bulk glasses and on the fibres by means of 31P and 23
Na MAS NMR and Raman spectroscopies have shown that no significant differences occur in the glass network structure during fibre drawing, especially with respect to the Qi speciation and to the nature and orientation of the P-O bonds.
A decrease in dissolution rate was observed with increasing Na2O content, with the glass containing 40 mol % P2O5 being the most durable due to the presence of less hydrolysable Q1 units in the glass network and an increase in the oxygen packing density. Conversely, the glass with the highest P2O5 content shows the best mechanical properties with good reliability, according to Weibull distribution studies.
With increasing Na2O content, a denser glass network as a result of a higher proportion of short chains arrangements, will hinder the cooperative flow of the PO4 units through the glass
21 tested in order to confirm the fragility variation with composition in a wider compositional range.
Acknowledgements
F. Muñoz and L. Muñoz-Senovilla are thankful to the projects MAT2010-20459 and MAT2013-48246-C2-1-P from MINECO of Spain and L. Muñoz-Senovilla also thanks the MINECO for her PhD scholarship (BES-2011-044130). I. Ahmed and A. J. Parsons would like to thank the University of Nottingham for facilitating the hosting of L. Muñoz-Senovilla during her exchange visit. G. Tricot thanks would like to thank Region Nord Pas de Calais, Europe (FEDER), CNRS, University of Lille and TGIR-RMN-THC FR3050 CNRS for funding.
References
[1] Hench L.L, Hench J.W., Greenspan D.C. (2004) Bioglass: a short history and bibliography, J. Aust. Ceram. Soc. 40 (1):1-42.
[2] Knowles J.C. (2003) Phosphate based glasses for biomedical applications, J. Mater. Chem. 13:2395-2401.
[3] Parsons A.J., Ahmed I., Haque P., Fitzpatrick B., Niazi M.I.K., Walker G.S., Rudd C.D., Phosphate glass fibre composites for bone repair (2009) J. Bionic Eng. 6:318-323.
[4] Brauer D.S., Rüssel C., Vogt S., Weisser J., Schnabelrauch M. (2008) Degradable phosphate glass fibre reinforced polymer matrices : mechanical properties and cell response, J. Mater. Sci. Mater. Med. 19:121-127.
22 [6] Haque P., Ahmed I., Parsons A.J., Felfel R., Walker G.S., Rudd C.D. (2013) Degradation properties and microstructural analysis of 40P2O5-24MgO-16CaO-16Na2O-4Fe2O3 phosphate glass fibres, J. Non-Cryst. Solids 375:99-109.
[7] Massera J., Ahmed I., Petit L., Aallos V., Hupa L. (2014) Phosphate-based glass fiber vs. bulk glass: change in fiber optical response to probe in vitro glass reactivity, Materials Science and Engineering C 37:251-257.
[8] Massera J., Vassallo-Breillot M., Törngren B., Glorieux B., Hupa L. (2014) Effect of CeO2 doping on thermal, optical structural and in vitro properties of a phosphate based bioactive glass, J. Non-Cryst. Solids 402:28-35.
[9] Brauer D. S., Karpukhina N., Law R. V., Hill R. G. (2010) Effect of TiO2 addition on structure, solubility and crystallisation of phosphate invert glasses for biomedical applications, J. of Non-Cryst. Solids 356:2626-2633.
[10] Döhler F., Groh D., Chiba S., Bierlich J., Kobelke J., Brauer D. S. (2015) Bioactive glasses with improved processing. Part 2. Viscosity and fibre drawing, J. Non-Cryst. Solids 432:130-136.
[11] Parsons A.J., Sharmin N., Shaharuddin S.I.S., Marshall M. (2015) Viscosity profiles of phosphate glasses through combined quasi-static and bob-in-cup methods, J. Non-Cryst. Solids 408:76-86.
[12] Brauer D. S. (2015) Bioactive glasses-structure and properties, Angew. Chem. Int. Ed. 54:4160-4181.
23 [14] Czjzek G., Fink J., Gotz F., Schmidt H., Coey J.M.D., Rebouillat J.P., Lienard A. (1981) Atomic coordination and the distribution of electric field gradients in amorphous solids, Phys. Rev. B 23:2513-2530.
[15] Alam T.M., Conzone S., Brow R.K., Boyle T.J. (1999) 6Li, 7Li nuclear magnetic resonance investigation of lithium coordination in binary phosphate glasses, J. Non-Cryst. Solids 258:140-154.
[16] Xue X., Stebbins J.F. (1993) 23Na NMR chemical shifts and local Na coordination environments in silicate crystals, melts and glasses, Phys. Chem. Miner. 20:297-307.
[17] Grimmer A.R., Haubenreisser U. (1983) High-field static and MAS 31P NMR: Chemical shift tensors of polycrystalline potassium phosphates P2O5-xK2O (0x3), Chem. Phys. Lett.
99 (1983) 487-490.
[18] Van Wazer J.R. (1958) Phosphorus and its compounds vol. I, Interscience, New York. [19] Fletcher J.P., Kirkpatrick R.J., Howell D., Risbud S.H. (1993) 31P Magic angle nuclear magnetic resonance spectroscopy of calcium phosphate glasses, J. Chem. Soc. Faraday Trans. 89 (17):3297-3299.
[20] Hill R. (1996) An alternative view of degradation of bioglass, J. Mat. Sci. Lett. 15:1122-1125.
[21] Baikova L. G., Fedorov Y.K., Tolstoi M. N. (1991) Structural strength of phosphate glasses, Sov. J. Glass Phys. Chem. 16:211-217.
[22] Duncan T.M., Douglass D.C. (1984) On the 31P chemical shift anisotropy in condensed phosphates, Chem. Phys. 87:339349.
[23] Goldstein M., Davies T.H. (1955) Glass fibers with oriented chain molecules, J. Am. Ceram. Soc. 38:223-226.
24 [25] Muñoz F., Pritula O., Sedláček J., Rüssel C. (2008) A study on the anisotropy of phosphate glass fibres, European Journal of Glass Science and Technology Part A: Glass Technology, 49(1):47-52.
[26] Braun M., Yue Y.Z., Rüssel C., Jäger C. (1998) Two-dimensional nuclear magnetic resonance evidence for structural order in extruded phosphate glasses, J. Non-Cryst. Solids 241 (2-3):204-207.
[27] Yue Y.Z., Von der Ohe R., Jensen S. L. (2004) Fictive temperature, cooling rate, and viscosity of glasses, J. Chem. Phys. 120 (17): 8053-8059.
[28] Nelson B.N., Exarhos G.J. (1979) Vibrational spectroscopy of cation-site interactions in phosphate glasses, J. Chem. Phys. 71:2739-2747.
[29] Brow R.K., Tallant D.R., Myers S.T., Phifer C.C. (1995) The short-range structure of zinc pyrophosphate glass, J. Non-Cryst. Solids 191:45-55.
[30] Gao H., Tan T., Wang D. (2004) Dissolution mechanism and release kinetics of phosphate controlled release glasses in aqueous medium, Journal of Controlled Release, 96:29-36.
[31] Sharmin N., Parsons A.J., Rudd C.D., Ahmed I. (2014) Effect of boron oxide addition on fibre drawing, mechanical properties and dissolution behaviour of phosphate based glass fibres with fixed 40, 45 and 50 mol % P2O5, J. Biomat. Appl. 29 (5):639-653.
[32] Parsons A.J., Burling L.D., Scotchford C.A., Walker G.S., Rudd C.D. (2006) Properties of sodium-based ternary phosphate glasses produced from readily available phosphate salts, J. Non-Cryst. Solids 352:5309-5317.
25 [34] Vogel J., Wange P., Hartmann P. (1997) Effect of composition changes on the structure and properties of phosphate glasses in the pyrophosphate region, Glass Sci. Technol. 70:23-27.
[35] Vogel J., Wange P., Hartmann P. (1997) Phosphate glasses and glass-ceramics for medical applications, Glass Sci. Technol. 70:220-223.
[36] Vogel J., Wange P., Knoche S., Rüssel C. (2004) Chemical solubility of phosphate glasses in the system Na2O-CaO-MgO-P2O5-Al2O3-TiO2 in aqueous solutions of different pH values, Glass Sci. Technol. 77:82-87.
[37] Lund M. D., Yue Y.Z. (2010) Impact of drawing stress on the tensile strength of oxide glass fibers J. Am. Ceram. Soc. 93 (10):3236-3243.
[38] Kobayashi H.Y.L.S., Brauer D.S., Rüssel C. (2010) Mechanical properties of a degradable phosphate glass fibre reinforced polymer composite for internal fracture fixation, Mat. Sci. and Eng. C, 30 (7):1003-1007.
[39] Hull D., Clyne T. W. (1996) An introduction to composite materials. NY: Cambridge University Press.
[40] Muñoz-Senovilla L., Muñoz F. (2014) Behaviour of viscosity in metaphosphate glasses, J. Non-Cryst. Solids 385:9-16.
[41] Muñoz-Senovilla L., Venkatachalam S., Muñoz F., Van Wüllen L. (2015) Relationships between fragility and structure through viscosity and high temperature NMR measurements in Li2O-ZnO-P2O5 phosphate glasses, J. Non-Cryst. Solids 428:54-61.
[42] Angell C.A. (1995) Formation of glasses from liquids and biopolymers, Science 267: 1924-1935.
26 Figure captions:
Figure 1: a) 23Na MAS NMR spectra of xNa2O16CaO24MgO(60-x)P2O5 glasses where x denotes the molar fraction of Na2O oxide, accompanied by simulations (red dotted lines).b) Isotropic signals of 31P MAS NMR spectra of bulk (continuous lines) and fibre (dotted lines) glass.
Figure 2: Relative speciation of Qi units as function of Na2O content. Dotted lines correspond to theoretical values obtained from equations (7.6 and 7.7). Note: Q1 point in glass fibre x=10 and x=20 is not observed due to the overlap with other points.
Figure 3: Network connectivity (NC) and average chain length (ñ) as function of Na2O content. Dotted lines are drawn as guide for the eyes. Note: equation 7.10 can be only applied for glasses containing 50 mol % or less of P2O5.
Figure 4: Molar volume (Vm) and oxygen packing density ([O]) as function of Na2O content. Dotted lines are drawn as guide for the eyes.
Figure 5: 31P static NMR spectra of 10Na2O16CaO24MgO50P2O5 in bulk (black line) and fibres (red line).
Figure 6: Raman spectra of xNa2O16CaO24MgO(60-x)P2O5 glasses in bulk (continuous
lines) and fibres (dotted lines).Discontinuous coloured lines show the bands attributed to bending (δ) and stretching (ν) vibrational modes of P-O bonds.
27 Figure 8: Tensile fracture stress, tensile modulus and fibres diameter of the fibres in the glass
system xNa2O16CaO24MgO(60-x)P2O5 glasses in PBS at 37ºC after 84 days. Error bars represent the standard deviation. Dotted lines are drawn as a guide for the eyes.
Figure 9: Kinetic fragility as function of Na2O content. Dotted lines are drawn as guide for the eyes.
Table captions:
Table 1: Chemical shifts and quadrupolar constant (CQ) extracted from the 1D 23Na NMR spectra simulation. The errors on the values are estimated to ±0.2 ppm and ±0.1 MHz.
Table 2: Chemical shift anisotropy of Q2 units for bulk and glass fibers. The errors on the values are estimated to ±0.2 ppm.
28 Figure 1
40 20 0 -20 -40 -60 -80 -100
In
te
n
si
ty
(a
.u
)
23
Na (ppm) a)
x=5 x=10 x=15 x=20
10 0 -10 -20 -30 -40 -50 -60 Q1
Q2
Q3
x=20
x=15
x=10
x=5 b)
31
P (ppm)
29 Figure 2 0 20 40 60 80 100 20 15 10 R e la ti ve Spe ci a ti o n (% )
% mol Na
2O 5 0 20 40 60 80 100
Q1 fiber Q1 bulk
Q2 fiber Q2 bulk
Q3 fiber Q3 bulk
Q1 th.
Q2 th.
30 Figure 3
0 10 20 30 40
50 Av. Chain Length ( n)
Network Connectivity (NC)
Na2Omol%
n
5 10 15 20
1.4 1.5 1.6 1.7 1.8 1.9 2.0 2.1 2.2
31 Figure 4 32 33 34 35 36 37 38 39 40 V m [O] Na
2Omol% V m
(cm
3 .mo
l
-1 )
5 10 15 20
32 Figure 5
200 100 0 -100 -200
31
P (ppm) Bulk glass
33 Figure 6
0
200
400
600
800 1000 1200 1400
Raman Shift (cm
-1)
P=O (Q
3)
aS
Q
2(O-P-O)
S
Q
2(O-P-O)
S
Q
1(O-P-O)
aS
Q
2(P-O-P)
S
Q
2/Q
1(P-O-P)
P-O
Fibre
Bulk
x=20
x=15
34 Figure 7
2.8x10⁻¹⁰
5.6x10⁻¹⁰
8.3x10⁻¹⁰
1.1x10⁻⁹
1.4x10⁻⁹
1.7x10⁻⁹
1.9x10⁻⁹
Na2O mol %
D
issol
u
ti
o
n
ra
te
(Kg
m
-2 s
-1 )
35 Figure 8 0 200 400 600 800 1000 Ten s ile Fr ac tur e S tr es s ( MP a)
Tensile Fracture Stress Tensile Modulus Diameter
Na2O % mol
5 10 15 20
36 Figure 9
46 48 50 52
m
(-)
Na2Omol%
37
Table 1
Glass code δCS23Na (ppm) CQ (MHz)
x=5 -12.20 2.32
x=10 -11.83 2.27
x=15 -10.81 2.29
x=20 -8.53 2.32
Table 2
Glass composition Glass code
δCSA31P Q2 (ppm)
bulk glass
δCSA31P Q2 (ppm)
glass fibres
5Na2O.16CaO.24MgO.55P2O5 x=5 -139 -136
10Na2O.16CaO.24MgO.50P2O5 x=10 -131 -130
15Na2O.16CaO.24MgO.45P2O5 x=15 -131 -130
[image:37.595.67.529.537.693.2]20Na2O.16CaO.24MgO.40P2O5 x=20 -123 -123
Table 3
Glass code Tensile Fracture Stress (MPa) σ0(MPa) m (Weibull modulus)
x=5 692±86 737 9.33
x=10 632±155 699 5.42
x=15 543±75 574 9.51