A Study on Decision-making of Food Supply Chain Based on Big Data
Guojun Ji
a, Limei Hu
a, Kim Hua Tan
ba
Collaborative Innovation Center for Peaceful Development of Corss-Strait Relations;
School of Management, Xiamen University, 361005 Fujian China
[email protected],
[email protected]
b
Operations Management & Information Systems Division, Nottingham University Business
School
[email protected]
Abstract
As more and more companies have captured and analyzed huge volumes of data to improve the performance of supply chain, this paper develops a big data harvest model that uses big data as inputs to make more informed production decisions in the food supply chain. By introducing a method of Bayesian network, this paper integrates sample data and finds a cause-and-effect between data to predict market demand. Then the deduction graph model that translates products demand into processes and divides processes into tasks and assets is presented, and an example of how big data in the food supply chain can be combined with Bayesian network and deduction graph model to guide production decision. Our conclusions indicate that the analytical framework has vast potential for supporting support decision making by extracting value from big data.
Keywords: Big data; Bayesian network; deduction graph model; food supply chain / DOI: 10.1007/s11518-016-5320-6
/
CN11-2983/N1. Introduction
The data have now been woven into every sector of the global economy. Companies focus on capturing relevant information from multiple sources such as suppliers and customers made for a much clear and complete picture of the existing business process (Tien 2013). Big data analytics helps companies to identify new opportunities and requirements for new products and find ways of new services by integrating large amounts of trading information, real-time and historical information. Now, a complementary trend is under way. Information multiplies and is shared more widely around the world provides the basis for advance analysis of big data and enables us to find out new applications, such as the smartphone app that tells commuters when the next bus will arrive. This tendency carries profound significance for companies, governments, and individuals.
These developments have changed the operation management of the food supply chain beyond recognition. As companies capture, store, search, share and analyze huge volumes of data, radical customization and novel business models will be the new hallmarks of competition. Therefore, the application of big data in the food supply chain has been receiving increasing attention. Taylor & Fearne (2006) regard big data as the pre-requisites for the development of a more synchronised approach to demand and activity analysis for the food supply chain. Tien (2012) pointed out that big data analytics is a key support technology to implement mass-customization in food production such as nano-modified and nano-additives. Anica-popa (2012) indicates that data sharing in the food supply chain will improve the food quality and safety. All the analyses mentioned above show that the importance of big data to the food supply chain can never be denied.
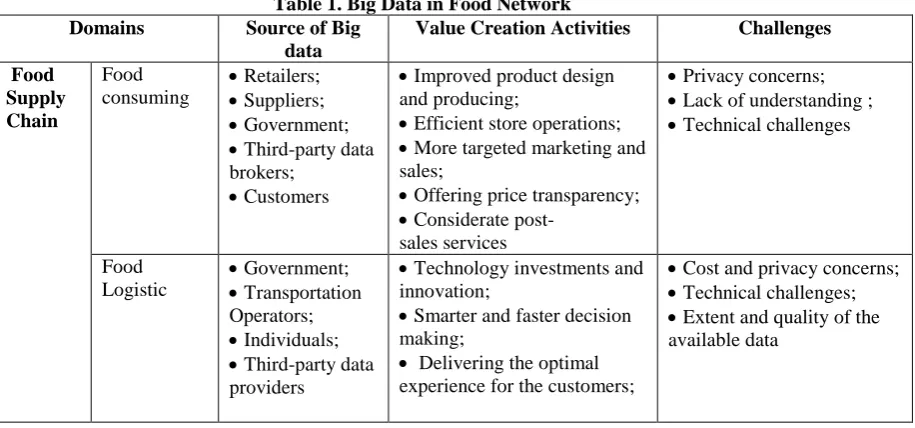
2. Value of Big Data in Food Network
Food supply chain is a changing system of organizations, people, activities, information, and resources engaged in production, processing, distribution and the disposal of food to move a product from farms to consumers (Yu & Nagurney 2013). Every year, $14 trillion of foods is produced, packaged, and sold in worldwide, through a series of transactions between suppliers, retailers and customers. It is estimated that $120 billion to nearly $150 billion in value per year could be achieved through the use of big data in food consumption. Big data has been applied to produce, package, sale, and use of food products (see Table 1, Source of Big Data). Suppliers track a large amount of useful data to understand better how customers evaluate the food and feed that information back into food design process. Retailers can make full use of big data to segment consumer types, carrying out precision marketing and cultivating the customers' loyalty. Also, customers have broader access to a massive amount of food information, making a more informed decision. For example, customers can be able to know the price of food ahead of time to decide which to buy.
[image:2.595.69.527.311.525.2]What is more, it has been estimated that hundreds of billions in value per year could be enabled by the use of big data in food logistic. These data are captured by government, transportation operators, individuals, and third-party data providers (see Table 1, Source of Big Data). One of the largest potential benefits can be obtained by using big data to enhance the ability to deliver and adapt to customers in real time. Another benefit is that companies can optimize every process step from procurement to producing to marketing by uncovering new insights that are hidden within the data.
Table 1. Big Data in Food Network Domains Source of Big
data
Value Creation Activities Challenges
Food Supply Chain Food consuming Retailers; Suppliers; Government;
Third-party data
brokers;
Customers
Improved product design
and producing;
Efficient store operations;
More targeted marketing and
sales;
Offering price transparency;
Considerate
post-sales services
Privacy concerns;
Lack of understanding ;
Technical challenges
Food Logistic Government; Transportation Operators; Individuals;
Third-party data
providers
Technology investments and
innovation;
Smarter and faster decision
making;
Delivering the optimal
experience for the customers;
Cost and privacy concerns;
Technical challenges;
Extent and quality of the
available data
Generally speaking, there are five main ways to leverage big data in food network that gain insights into opportunities and challenges and have implications on how organisation will have to be designed, organised, and managed.
1. Creating transparency: As big data in food network become more available across sectors, transparency
of data drives transformation, increases productivity and leads to informed decision making.
2. Enabling experimentation to identify anomalies, detect fraud and improve performance: Big data—
much of it unstructured or machine-generated—needs to be collected, integrated and analyzed in real time to discover anomalies and fraud that help organisations improve operations and develop services.
3. Micro-segmentation to customize actions: Big data make it possible to work through various streams of
customer data to enable the definition of increasingly finer segments and take precise marketing to
meetcustomers' needs.
4. Replacing/supporting decision making and data analysing with automated algorithms: Big data
analytics and visualization of automated algorithms allows organisations to find unknown patterns that occur in food network in a time-efficient and cost-effective manner.
5. Innovating new business models, products, and services: Using vast amounts of data provides new
3. Big Data Harvest Model
Although the potential value in big data is tremendous, it is extremely hard for existing analytics to analyze high volume (and variety) of data in real time and produce useful information (Tien & Goldschmidt-Clermont 2009). Although many data techniques might help managers to produce a lot of information, they are unfocused, and hence inefficient. So it is imperative to provide an analytical framework for structures and links various streams of data to create a coherent picture of a particular problem – so that a better insight into the issue been analyzed and could be gained.
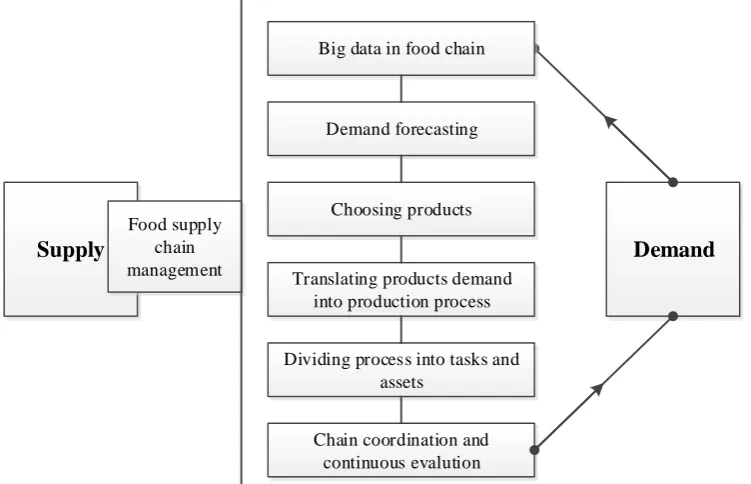
Therefore, we propose a better analytic infrastructure to make use of the available big data to gain competitive advantages in food network management (please see Fig. 1). Firstly, we identify the products that could meet future markets from big data analytics; then, we translate products demand into processes and divide processes into tasks and assets; finally, we meet the market demand through chain coordination and continuous evaluation.
Supply
Demand
Food supply chain management
Demand forecasting
Choosing products
Translating products demand into production process
Dividing process into tasks and assets
[image:3.595.111.487.242.484.2]Chain coordination and continuous evalution Big data in food chain
Fig. 1. Decision making based on big data in the food supply chain
For the first part, there are so many methods such as the Delphi method, time series analysis, regression analysis to predict the market demand for food. These methods mainly use historical data to forecast the market demand, but market demand depends on a variety of complex factors, including service quality, consumer groups and government policy. Moreover, these factors can be obtained from big data. If we adopt these factors into consideration, we can improve the precision of prediction to ensure product success. Because Bayesian networks can make effective use of all available data, diagnose what causes high preference and incorporate expert knowledge by representing the relationship among a set of variables (Heckerman et al. 1995, Jensen 1996), so that we use the Bayesian networks which link various streams of data in food chain to predict the market demand. Anderson et al. (2004) regard Bayesian network methodology as the implementation mechanism for causal modelling and build a Bayesian network model of customer service satisfaction. Corney (2000) applies Bayesian networks to a typical food design problem and the results show that they are powerful tools to aid consumer preference modelling from a combination of data and expertise. Further applications of Bayesian networks in food production include food security, food risk and consumer behaviours (Stein 2004, Albert et al. 2008, Van 2004).
The structure of a Bayesian network is a directed graphical model in which nodes mean random variables of interest and directed arcs represent direct causal or influential relation between nodes (Pearl 1986). Each node
X
has a probability distributionP X
( |
( )
X
)
which expresses the uncertainty of the interdependence of thewith the independence assumption, for a Bayesian network consisting of
n
nodes(
X X
1,
2,
,
X
n)
(X1, X2, ⋯ , Xn), we can factor out joint probability distribution:(1)
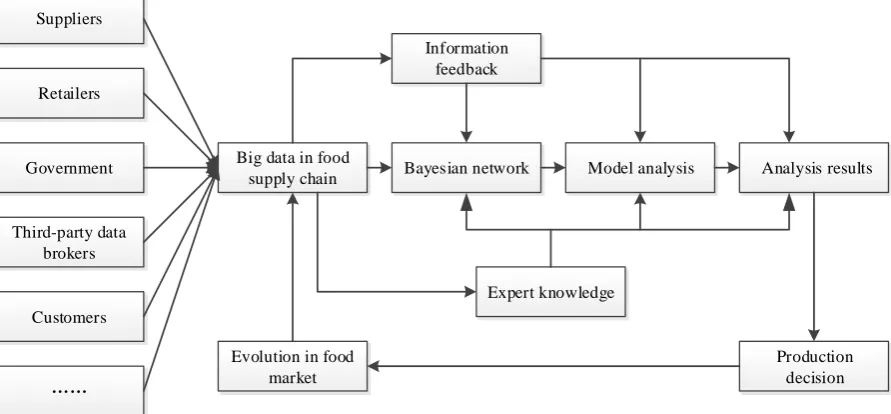
In particular, production decision will be provided by calculating and analyzing the Bayesian network which is set up based on the big data in the food supply chain. An analytical framework is presented in Fig. 2.
Suppliers
Retailers
Government
Third-party data brokers
Customers
……
Big data in food
supply chain Bayesian network Model analysis Analysis results
Production decision Evolution in food
market
Expert knowledge Information
[image:4.595.76.522.185.392.2]feedback
Fig. 2. An analytical framework based on big data in food supply chain
In the second part, to the products demand that the first part is analyzed, we probe into an analytic technique that translates products demand into processes and divides processes into tasks and assets.
Li (1994) proposes an analytic technique called deduction graph model that allows firms to incorporate their own competence sets with other firms. It provides a sequence of optimized expanding process in a visual way by linking different competence sets from various sources (Li et al. 1999). Although this approach has not been adopted in big data analytic area, we have developed it and make it possible to provide the right analytic capabilities to help firms to produce a detailed process design to enhance food supply chain innovation.
4. Numerical Examples
Our aim is to develop an optimisation model to extract value from big data to improve food supply chain performance, which can also help incorporating capabilities and information (big data) of group decision makers to maximize big data benefits. The following sections describe the detailed application of the proposed analytic approach in a food company.
4.1 Construction of a Bayesian network
A food company is keen to explore how to make use of the value from big data to acquire potential value and enhance their supply chain performance. The company analyzes the market demand through the use of the Bayesian networks. A brief description of the steps is represented below.
The first step is data collection. As the source and foundation of forecasting is always from purchasing behavior, searching recordings, and comments on their social networks, there is no doubt that “Big Data” can have a significant influence on customers’ preferences (Li et al. 2015). In order to select an appropriate sample data from the big data in the food supply chain, the company, combined with prior knowledge from food market, identifies and describes the factors that affect the market demands under advice from experts and decision makers. These factors mainly include food attributes and the chemical and physical properties of the product related to these attributes (Wolters & Van Gemert 1990). Once these factors are determined, they will be the
nodes (X1, X2, ⋯ , Xn) in the Bayesian network. Based on these factors, the company collects
The second step is to pre-processing the sample data. The values of factors need to be discrete by adopting the clustering algorithm or hierarchical category before modelling in order for the propagation and inference algorithms in the next couple of sections.
[image:5.595.93.500.382.705.2]The third step is designed to build a Bayesian network. Building a Bayesian network includes two parts. One is to identify the network structure. The other is to determine the conditional probability table. A selection of search algorithms which can be used in learning of the Bayesian networks is shown in Table 2 (Bidyuk et al. 2005).
Table 2. Search techniques of learning the network
Structure Observability Method
Known Complete Maximum-likelihood estimate
Known Partial Expectation maximization or a “greed” hill-climbing method, such
as K2
Unknown Complete Search in model space
Unknown Partial Structural algorithm of expectation maximization or bound
contraction
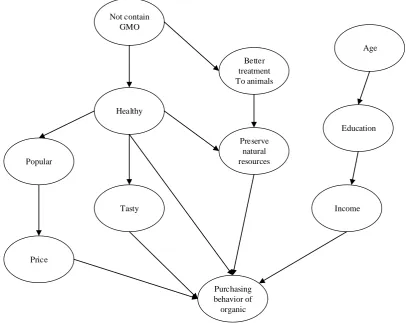
Figure 3 presents a part of a Bayesian Network for organic food preference, though it will be more complex in practice (Cene & Karaman 2015). And it is built by using the K2 algorithm (Cooper & Herskovits 1992),
Given the data
D
that the previous parts are processed, a Bayesian network is set up that maximizes(
h|
)
P S
D
. Based on the Bayesian theorem, then we haveNot contain GMO
Healthy
Popular
Price
Tasty
Better treatment To animals
Preserve natural resources
Purchasing behavior of
organic
Income Education
Age
(
) (
|
)
(
|
)=
( )
h h
h
P S P D S
P S
D
P D
(2)Where
S
h represents an arbitrary network structure containing the variables inD
.P
(
D
)
is a constantindependent of the network structure.
P
(
S
h)
is the prior probability. In addition, under the assumptions ofunconstrained multinomial distribution, the independence of parameters, Dirichlet prior distribution
Dir
(
a
)
and data integrity,
P
(
D
|
S
h)
is derived as1 1 1
(
)
(
)
(
|
)=
,(
1, 2,
,
1, 2
, ;
1, 2,
)
(
)
(
)
i i
q r
n
i j i j k ij k
h
i i
i j i j ij k i j k
N
P D S
i
n j
q k
r
N
(3)
Where a variable
x
i has
r
i possible value,p
i is the parent ofx
i,N
ijk is the number of consumers inD
when
x
i=
v
ik andp
i=
w
ij.Once such the network structure is found, numerical conditional probability table should be determined. Let
q
ijk denote the conditional probabilityP
(
x
i=
v
ik|
p
i=
w
ij)
. Letx
denote the two assumptions: 1) there isno missing values; 2)
q
ijis independent and has Dirichlet prior distribution. Therefore,(4)
The fourth step is to forecast the market demand. A Bayesian network is a bi-direction inference method where inputs can predict the outputs and vice versa (Lu et al. 2009). So given the values of the observed nodes, the company calculates the probability distribution of the target nodes to predict the demand for food or diagnose the likely causes of a perfect product. Then, the company identifies what kinds of food can satisfy most customers’ preferences and have vast potential for future development.
The fifth step is the sensitivity analysis. The sensitivity analysis is the important basis for decision-making. It can determine the variable that has the greatest influence on consumer preference. This means that consumers are more willing to purchase if satisfaction from the variable is high. MI (Mutual Information) would be used for sensitivity analysis. MI is a measure of the dependence between two random variables and is more suitable
for Bayesian network to sensitivity analysis (Nicholson & Jitnah 1998). It is the reduction in uncertainty of
X
due to knowing
Y
, and vice-versa. The MI between two variablesX
andY
is given by:I
(
X
,
Y
)
=
p
(
X
,
Y
)log
p
(
X
,
Y
)
p
(
X
)
p
(
Y
)
x,yå
(5)Where
p
(
X
,
Y
)
is the joint probability distribution function, andp
(
X
)
andp
(
Y
)
is the edge of theprobability distribution function of
X
andY
respectively.I
(
X
,
Y
)
describes the influence ofX
onY
.The larger the value of the
I
(
X
,
Y
)
is, the greater the effects ofX
onY
. Then the importance of thevariable would be ranked according to the value of the
I
(
X
,
Y
). And the variable that has higher prioritization
rank should be given more attention and real-time control of the production processes.
Moreover, Bayesian network can be further updated to respond to the changing market demand. When new data are obtained, the company can continuously refine the Bayesian network by modifying some local part of it, so that the company is able to quickly change existing running processes to satisfy the customer requirements.
4.2 Deduction graph model
Specifically, the company identifies five different types of foods that will satisfy most customers’ preferences through the Bayesian network analysis. The identified products are: A, B, C, D, E. The company also identified the features of the foods and the relevant production processes (raw materials, machines, skills and so on) needed to manufacture the five different foods i.e. a, b, c, d, e, f, g, h, i, j, k, l, m, and n, with each of a, b, c, d, e, f, g, h, i, j, k, l, m and n representing a unique required production process, respectively.
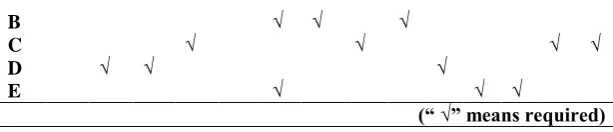
Specifically, different types of foods require different production processes to produce. Table 3 shows the needed production processes to make a specific product. For example, to produce C will require d, h, m and n.
Table 3. Different production processes required by products
a b c d e f g h i j k l m n
B √ √ √
C √ √ √ √
D √ √ √
E √ √ √
(“ √” means required)
Having identified the required production processes for different products, both factory managers are asked to point out the existing production processes available in departments A and B. The existing production processes
of department A (SA) are identified as: c, d and e. Whereas, the existing production processes of department B
(SB) are: a, b and f.
A quick analysis shows that both departments A and B don’t have all the required production processes to produce the five newly identified foods. Thus, to make foods that require new production processes, the departments should purchase the production processes from other departments or expand its existing production processes. The selling price for production processes in each department is estimated in Table 4. For example, the selling price for production process c in department A is 1 unit, and 1.5 units for production process f in department B.
Table 4. The selling price for each production process
c f
Department A 1
Department B 1.5
Based on the selling price, the expanding cost for department A is shown in Table 5 (a), and for department B in Table 5 (b). The expanding cost for buying new production processes takes into account of the time, labour, energy, funds and so on. There are also compound nodes, such as d ^ e and a ^ b. In order to produce the new foods, the needed production processes will be obtained by learning from existing production processes or by purchasing from other departments directly.
Table 5 (a). Production process expanding cost for A (A owns competence c, d, and e)
f g h i m n
c 2 1.5 1
d 2 1.5
e 2.5 1
f 1 2
g 1.5
h 2.5
i 1
m
n 1 1.8
d^e 1 1 1.5
Table 5 (b). Production processes expanding cost for B (B owns competence a, b, and f)
Based on the above analysis, the two manufacturing departments should focus on different product families. From the production processes learning costs, we can figure that department A is more suitable to manufacture A, B and C, whereas, the department B should responsible for D and E producing. Table 4 shows the foods to be produced in departments A and B. In the Table 6, A, B and C are denoted as X1, X2, X3 respectively, whereas D and E are denoted as Y1 and Y2.
c j k l
a 1.8 2
b 1.8
c 0.8
f 1.5 1 1
j 1
k 1
l 1.5
[image:7.595.139.446.67.133.2]Table 6. Products in departments A and B
Department A
X1 A
X2 B
X3 C
Department B
Y1 D
Y2 E
The possible earning revenue for a different product mix is listed in Table 7. For instance, if department A makes food X1 and department B makes food Y1, the possible profit earned by A is 4.5 and the possible profit earned by B is 3. The assumption is that both departments are willing to collaborate. They are ready to communicate to achieve the entire maximum profit.
Table 7. Revenues for mixed product set
Department A Department B
X1, Y1 4.5 3
X1, Y2 5 3.5
X2, Y1 6.5 4
X2, Y2 6 3.5
X3, Y1 7 3
X3, Y2 8 4
4.2.1 The Competence Network
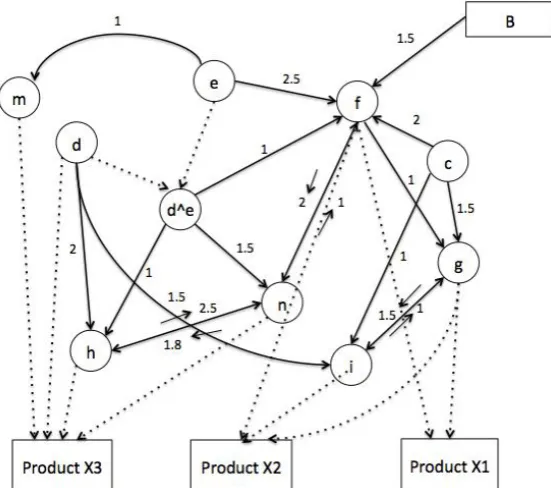
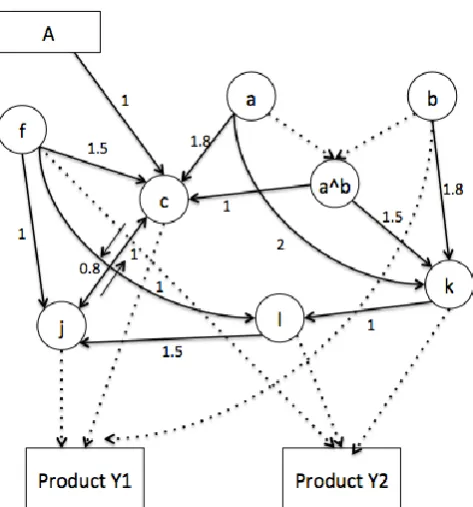
A production processes network can brightly depict the possible ways of expanding a production process to manufacture new foods (Li 1999). The network developed in this case contains compound nodes and considers a cyclical situation. Fig. 4(a) shows the expanding process of department A to produce X1, X2, or X3, and Fig. 4(b) shows the expanding process of department B to produce Y1 or Y2 based on its current production processes a, b, and f.
[image:8.595.160.436.423.667.2]Fig. 4(b). Network of department B (existing production processes are a, b, and f)
Each node represents each production processes. The arc shows there is a connection between the two nodes,
such as, a c means production process c can be learned from production process a. As for d and m, there is no
arc between these nodes, denoting that to learn d from m or to learn m from d is almost impossible. The number on the arc means the cost spent on obtaining the production processes. There are also compound nodes, such as d ^ e and a ^ b. The compound node can only be used when the decomposed nodes are obtained. In order to produce the new foods, the needed production processes will be obtained by learning from existing production processes or by purchasing from other departments directly. For example, in Figure 4(a), the production process f can be learned from production processes e, c, and d ^ e with the cost of 2.5, 2, and 1, respectively. But A also can purchase production process f from department B with the cost of 1.5. Also, e f g i shows the learning sequence indicating that the learning process starts from e, learns f, then learns g, and then leans i from g. The final objective of the production process network is using optimization way to find the best sequence with the highest profit in food production.
4.2.2 Network flow approach
The results of the example problem can be formulated as the linear mixed 0-1 optimization model (Li 1999). However, when the size of the problem is increasing, mixed 0-1 programming is not running quickly enough. Kim & Hooker (2002) indicate that a minimum-cost flow problem is already well suited for mixed 0-1 programming and can be solved better and faster with its advantage increasing with problem size. So we translated the deduction graph model into a minimum-cost flow problem to find an optimal solution.
Four assumptions in the network flow approach are specified as follows:
Assumptions A1: All the departments can list all related information, e.g., production processes and associated prices.
Assumptions A2: All the departments would like to collaborate with each other.
Assumptions A3: A departments can freely purchase required production processes at listed prices from other departments.
Assumptions A4: All the departments are of benefit to a company.
Let
S
is the set of department’s existing production processes,T
is the set of required production processesfor products,
I
is the set of intermediate production processes. We define a directed graphG V E
=( , )
,V
S
I
T
. Given a nodei
inG V E
=( , )
,r i j
( , )
is the arc connectingj
fromi
, andw i j
( , )
is thecorresponding cost of obtaining
j
fromi
. [image:9.595.179.416.75.329.2]0
1
( , )
( , ),
( , )
,
if r i j
r t t
c i j
n otherwise
,
,
0 00,
( , )
( , ) / ( , ),
( , )
( , ),
.
if r i j
r s s
r t t
w i j
w i j
otherwise
And
f i j
( , )
denotes the flow ofr i j
( , )
, then the minimum cost flow model is given by the following:( , ) '
min
( , ) ( , )
i j E
w i j f i j
(6)s.t. 0 0
,
( , )
( , )
,
0
.
x xn
if i
s
f i x
f x i
n if i
t
otherwise
(7)
0
f i j
( , )
c i j
( , )
(8) There are many effective algorithms for solving the minimum cost flow problem (Papadimitriou et al. 1998). After the optimal solution is found, the subgraphG
'
in which the flow of each arc is positive is theapproximate solution of the problem. Based on the subgraph
G
'
, the company, combined with the earningrevenue for a different product mix, selects an optimal combination of production strategies to obtain the largest benefits.
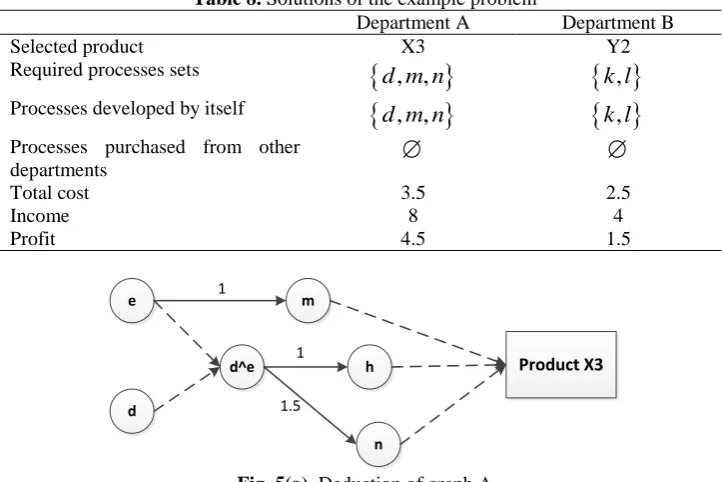
To solve the above problem of the food company by transforming into a minimum-cost flow problem (Kim & Hooker 2002), the solution listed in Table 8 is that department A chooses X3 and department B chooses Y2 respectively. Fig. 5(a) and 5(b) show the corresponding deduction graph. Take X3, for instance, the required
production processes set for producing X3 are
d m n
, ,
in which processes are all expanded by department Aitself at the cost 3.5. The profit of producing X3 is
[image:10.595.70.514.72.266.2]Profit(X3) = Revenue (X3|X3,Y2) - CostA(
c d e
, ,
,
d m n
, ,
) =8-3.5=4.5Table 8. Solutions of the example problem
Department A Department B
Selected product X3 Y2
Required processes sets
d m n
, ,
k l
,
Processes developed by itself
d m n
, ,
k l
,
Processes purchased from other
departments
Total cost 3.5 2.5
Income 8 4
Profit 4.5 1.5
e d^e d h n m Product X3 1 1 1.5
[image:10.595.115.477.431.672.2]a
a^b
b
k l
Product Y2
1
1.5
f
Fig.5(b). Deduction of graph B
Moreover, deduction graph model can be expanded to solve multi-level food quality problems, in which there are levels of proficiency for the foods taken into deliberation. For example, the food X1 may have
multi-quality levels designated by X11(Normal), X12(Good), X13(Excellent). Likewise, the food X2, X3, Y1 and Y2
may have multi-quality levels (i.e., Y11(Normal), Y12(Good), Y13(Excellent)). Each different level of food quality may lead to different results of reputation, intension of government’s supervision and customer satisfaction. In this way, the proposed model can help us to select a feasible way, so that the expansion from the initial production processes to final products (five identified foods) can be reached at the lowest cost and the optimum proficiency of the food quality.
Furthermore, this model can be further developed to an optimisation approach of incorporating information/skills/service/products (big data) of group decision makers to reap the entire maximum profit. In this way, it works well in cyclic situations and can be used in analysing efficient information transmitting control of the food network.
4.3 Discussion
Big data analytics in food network makes it possible to discover needs and create value, which has implications on how organisation will have to be designed, organised and managed. Hence, we develop a big data harvest model that links large amounts of data to create a coherent picture of a particular problem--having identified the products that can meet future markets from big data and then identified the required production processes to produce the products.
On one hand, comparing with other analytical approaches, Bayesian networks have a number of features that make them suitable for demand forecasting. The results indicate Bayesian networks are valuable tools for representing the relationship among a set of variables from a combination of big data and expertise in the food supply chain. Through Bayesian network analysis, the food company can build a Bayesian network for food preference, find the types and features that a food product must have in order to be preferred and decide what to produce.
On the other hand, once the company identifies the types of foods that can meet future markets, the next steps the company must translate products demand into production processes and divide processes into tasks and assets. We develop the deduction graph model and make it possible to provide the exact analytic capabilities to help firms to produce a detailed process design. The results indicate that the deduction graph model can effectively help the food company to select the product produced by each department and combine departments’ respective production processes to make such products to maximize their profits. The results also indicate that network flow approach can be used to find the optimal solution of the deduction graph model with fast specialized algorithms. The optimal solution is that department A produces X3 and department B produces Y2, the corresponding profit, respectively, is 4.5 and 1.5.
5. Conclusion
In this paper, we propose a big data harvest model that converted data into sights to gain competitive advantages in food supply chain management. The purposes of this study are twofold. One of the goals is to use big data in the food supply chain as inputs to make production decisions. The other is to apply the deduction graph model to translate products demand into processes and divide processes into tasks and assets.
First, using Bayesian network can integrate the prior information and sample information in the food supply chain and find a cause-and-effect relationship between data to effectively predict the market demand and direct food production.
We simply illustrate the application framework of using big data to make more informed production decisions in the food supply chain, however, it is necessary to provide technological support such as information-gathering techniques and Bayesian network inference techniques when the company plans and implements the application framework. What’s more, the application of big data in other areas of the food supply chain should be addressed through further research.
Acknowledgements
This research was supported by the National Natural Science Foundation of China (NSFC) (Project Nos. 71571151 and 71371159), the National Planning Office of Philosophy and Social Science of China (Project No. 14AGL015).
References
[1] Albert, I., Grenier, E., Denis, J. B. & Rousseau, J. (2008). Quantitative Risk Assessment from Farm to Fork and Beyond: A Global Bayesian Approach Concerning Food‐Borne Diseases. Risk Analysis, 28(2): 557-571 [2] Anderson, R. D., Mackoy, R. D., Thompson, V. B. & Harrell, G. (2004). A Bayesian Network Estimation of the
Service‐Profit Chain for Transport Service Satisfaction. Decision Sciences, 35(4): 665-689
[3] Anica-popa I. (2012). Food traceability systems and information sharing in food supply chain. Management & Marketing, 7(4): 750-759
[4] Bidyuk, P. I., Terent'Ev, A. N. & Gasanov, A. S. (2005). Construction and methods of learning of Bayesian networks. Cybernetics and Systems Analysis, 41(4): 587-598
[5] Cene, E., & Karaman, F. (2015). Analysing organic food buyers' perceptions with Bayesian networks: a case study in Turkey. Journal of Applied Statistics, 42(7), 1572-1590
[6] Cooper, G. F. & Herskovits, E. (1992). A Bayesian method for the induction of probabilistic networks from data. Machine Learning, 9(4): 309-347
[7] Corney, D. (2000). Designing food with bayesian belief networks. In Evolutionary Design and Manufacture. Springer London
[8] Heckerman, D., Mamdani, A. & Wellman, M. P. (1995). Real-world applications of Bayesian networks. Communications of the ACM, 38(3): 24-26
[9] Jensen, F. V. (1996). An introduction to Bayesian networks. London: UCL press
[10] Kim, H. J. & Hooker, J. N. (2002). Solving fixed-charge network flow problems with a hybrid optimization and constraint programming approach. Annals of Operations Research, 115(1): 95-124
[11] Li, H. L. (1999). Incorporating competence sets of decision makers by deduction graphs. Operations Research, 47(2): 209-220
[12] Li, J., Tao, F., Cheng, Y., & Zhao, L. (2015). Big data in product lifecycle management. The International Journal of Advanced Manufacturing Technology, 81(1-4), 667-684
[13] Li, H. L. & Yu, P. L. (1994). Optimal competence set expansion using deduction graphs. Journal of Optimization Theory and Applications, 80(1): 75-91
[14] Lu, J., Bai, C. & Zhang, G. (2009). Cost-benefit factor analysis in e-services using bayesian networks. Expert Systems with Applications, 36(3): 4617-4625
[15] Nicholson, A. E., & Jitnah, N. (1998). Using mutual information to determine relevance in Bayesian networks. In PRICAI’98: Topics in Artificial Intelligence (pp. 399-410). Springer Berlin Heidelberg
[16] Papadimitriou, C. H. & Steiglitz, K. (1998). Combinatorial optimization: algorithms and complexity. Courier Dover Publications
[17] Pearl, J. (1986). Fusion, propagation, and structuring in belief networks. Artificial Intelligence, 29(3): 241-288 [18] Stein, A. (2004). Bayesian networks and food security-an introduction. Frontis, 3: 107-116
[19] Taylor, D. H. & Fearne, A. (2006). Towards a framework for improvement in the management of demand in agri-food supply chains. Supply Chain Management: an International Journal, 11(5): 379-384
[20] Tien, J. M. (2013). Big data: Unleashing information. Journal of Systems Science and Systems Engineering, 22(2): 127-151
[21] Tien, J. M. (2012). The next industrial revolution: integrated services and goods. Journal of Systems Science and Systems Engineering, 21(3): 257-296
[22] Tien, J. M. & Goldschmidt-Clermont, P. J. (2009). Healthcare: A complex service system. Journal of Systems Science and Systems Engineering, 18(3): 257-282
[23] Van Boekel, M. A. J. S. (2004). Bayesian solutions for food-science problems?. Frontis, 3: 17-27
[24] Wolters, C. J. & Van Gemert, L. J. (1989). Towards an integrated model of sensory attributes, instrumental data and consumer perception of tomatoes. Part I. Relation between consumer perception and sensory attributes. In Workshop on Measuring Consumer Perception of Internal Product Quality, 259: 91-106