Quantitative analysis of lab-to-lab variability in Caco-2 permeability assays
Jong Bong Lee1, Atheer Zgair1,2, Dhiaa A Taha1, Xiaowei Zang3, Leonid Kagan3, Tae Hwan
Kim4, Min Gi Kim4, Hwi-yeol Yun5, Peter M Fischer1and Pavel Gershkovich1*
1School of Pharmacy, University of Nottingham, Nottingham, UK
2College of Pharmacy, University of Anbar, Anbar, Iraq
3Department of Pharmaceutics, Ernest Mario School of Pharmacy, Rutgers, The State
University of New Jersey, Piscataway, NJ, USA
4School of Pharmacy, Sungkyunkwan University, Suwon, Republic of Korea
5College of Pharmacy, Chungnam National University, Daejeon, Republic of Korea
*Corresponding author:Pavel Gershkovich, PhD School of Pharmacy, Centre for Biomolecular Sciences
University of Nottingham, University Park
Nottingham, UK
NG7 2RD
Tel: +44 (0) 115 846 8014
Fax: +44 (0) 115 951 3412
ABSTRACT
In this study, Caco-2 permeability results from different laboratories were compared. Six
different sets of apparent permeability coefficient (Papp) values reported in the literature were compared to experimental Papp obtained in our laboratory. The differences were assessed by determining the root mean square error (RMSE) values between the datasets, which reached
levels as high as 0.581 for the training set compounds,i.e.ten compounds with known effective human permeability (Peff). The consequences of these differences inPappfor prediction of oral drug absorption were demonstrated by introducing the Papp into the absorption and pharmacokinetics simulation software application GastroPlusTMfor prediction of the fraction
absorbed (Fa) in humans using calibrated “user-defined permeability models”. The RMSE were calculated to assess the differences between the simulatedFaand experimental values reported in the literature. The RMSE for Fa simulated with the permeability model calibrated using experimentalPapp from our laboratory was 0.128. When the calibration was performed using
Pappfrom literature datasets, the RMSE values forFawere higher in all cases except one. This study shows quantitative lab-to-lab variability of Caco-2 permeability results and the potential
consequences this can have in the use of these results for predicting intestinal absorption of
drugs.
Keywords
Drug permeability, Caco-2 permeability assay, lab-to-lab variability, prediction of oral
INTRODUCTION
The extent of gastro-intestinal absorption is one of the key properties for drugs intended for
oral administration [1-6]. Of many factors that govern intestinal absorption of a compound,
permeability is often testedin vitroby means of cell-based assays such as the Caco-2 assay [2-8]. While the Caco-2 assay is the gold standard for in vitro permeability assessment, interpretation of the results from such assays needs careful attention due to high lab-to-lab
variability [6, 8].
This variability can be attributed to factors such as cell passage number, cell culture conditions,
number of cells, cell monolayer integrity, etc., and can potentially mislead decisions if permeability results from different laboratories are directly compared [6]. The lab-to-lab
variability itself is a known phenomenon in the field, but the extent of variability and the
consequences of direct comparison of results from different laboratories have not been
explicitly shown before. Therefore, the aim of this study is to compare Caco-2 permeability
results between different laboratories and to evaluate potential implications of the direct use of
permeability results from different laboratories for predicting oral drug absorption.
MATERIALS AND METHODS Materials
Caco-2 cells of passage number 47 were purchased from Cell Culture Collections, Public
Health England (Salisbury, UK). Dulbecco’s modified eagle medium (DMEM) supplemented
with GlutaMAX™, 4.5 g/L D-glucose and 25 mM
4-2-hydroxyethyl-1-piperazineethanesulfonic acid (HEPES) was purchased from Gibco (Paisley, UK). Pravastatin
was obtained from Kemprotec Ltd (Lancashire, UK). Hank’s balanced salt solution (HBSS),
desipramine, dexamethasone, diclofenac, furosemide, hydrochlorothiazide, ketoprofen,
metoprolol, naproxen, piroxicam, propranolol, ranitidine, sildenafil, terbutaline and verapamil
were purchased from Sigma (Gillingham, UK). Corning 24-well Transwell® was purchased
from Fisher Scientific (Loughborough, UK). All solvents were HPLC grade or higher and all
other chemicals were analytical reagent grade or higher.
Cell culture
Caco-2 cells of passage numbers 51-54 were used in the study. Caco-2 cells were passaged in
75 cm2cell culture flasks (Corning Inc, Corning, NY) at 1×10⁴cells/cm2at least twice before
seeding in Transwell® plates. DMEM cell culture medium supplemented with 10% FBS and
1% penicillin-streptomycin was used and the cells were maintained at 37°C, 95% relative
humidity and 5% CO2. Cells were seeded at a density of 3.75×10⁴cells/cm2in the Transwell®
plates. Medium was replaced on the next day following seeding and every other day thereafter
for 21 days before permeability assay. Transepithelial electrical resistance (TEER) values were
measured using an EVOM2 instrument (World Precision Instruments, Sarasota, FL). Caco-2
monolayers with TEER values between 280-500 Ωcm2were used in the permeability assay.
Caco-2 permeability assay
On the day of the experiment, the Caco-2 monolayers were washed twice with transport buffer
(HBSS buffer supplemented with 10 mM HEPES and pH adjusted to 7.4 using HCl or NaOH).
The cells were then allowed to equilibrate for 30 min at 37°C with the transport buffer. Donor
solutions were prepared to yield 50 or 200 μM of the test compound. The assay was initiated
by addition of the donor solution (300 μL) at the apical side of the monolayer. One mL of
transport buffer was initially added at the basolateral side of the monolayer and 350 μL were
sampling time point. At the end of the assay, TEER was measured again to assess the effect of
compounds on the monolayers. All experiments were performed in triplicates.
Sample analysis
Samples were analysed for pravastatin using previously reported LC-MS/MS method [9]. All
other compounds were analysed using an HPLC-UV system, which consisted of a Waters 600
Pump, Waters 717 Autosampler and Waters 2996 Photodiode Array Detector. A column oven
was used to maintain the column temperature at 40°C. Mobile phase was a mixture of
acetonitrile and 10 mM ammonium acetate buffer with pH adjusted to 4.1 with glacial acetic
acid. Specific HPLC-UV conditions are listed in Table 1.
For sample preparation, liquid-liquid extraction was applied (specific details are listed in Table
1). To 300 μL sample, 500 μL of pH modifier and 2 mL of extraction solvent were added. The
samples were then vortex-mixed for 10 min and centrifuged at 1160gfor 10 min. The organic layer was transferred and evaporated to dryness under N2gas at 40°C. Reconstitution solvent
(100 µL) was then added and vortex-mixed for 10 min before being transferred to HPLC vial
for analysis.
Determination of apparent permeability coefficient
The apparent permeability coefficient (Papp) was calculated using the following equation:
ܲ = (݀ܳ ݀ݐ⁄ ) ∙ (1/(ܣ·ܥ))
In silicosimulation
In silico simulation of fraction absorbed in humans (Fa) was performed using GastroPlusTM version 9.0.0007. The physicochemical properties were used as predicted by the built-in
ADMET PredictorTMversion 7.2.0.0. Built-in pharmacokinetic model parameters for a 30
year-old American male were used as default settings, and “Human – Physiological – Fasted”
settings were applied for the gut physiology. Paracellular permeability was turned on and logD
model was set as Structure-based version 6.1.
Pappvalues of compounds with knownPeff (training set compounds) were used as an input to calibrate the permeability model in GastroPlusTMand as a result a “user-defined permeability
model” was established. The same permeability value can result in different simulation results
depending on how the “user-defined permeability model” is determined. Therefore establishing
a “user-defined permeability model” represents calibrating the permeability model. In other
words, the “user-defined permeability model” plays a role as a calibration curve that can
correlate Papp values to Peff values. A detailed description of the “user-defined permeability model” in GastroPlusTM could be found in the Supplementary material. The training set
compounds included antipyrine, furosemide, hydrochlorothiazide, ketoprofen, metoprolol,
naproxen, propranolol, ranitidine, terbutaline and verapamil.Papp values from our laboratory and also the results from six different sets of literature values were used to produce seven
“user-defined permeability models”. Log-linear model was selected for all datasets as it was the one
suggested by GastroPlusTMafter solving the correlation for all datasets.
obtained from our laboratory were then applied forFa simulation in GastroPlusTM. For each compound, all input parameters were fixed and only the “user-defined permeability model”
was changed for each simulation. EachPapp value of the application set compounds obtained from this study was applied to the seven different “user-defined permeability models” and
human effective permeability (Peff) values were separately predicted. These Peff values were then used to simulate seven differentFavalues for each compound. All other physicochemical input parameters except permeability were used as predicted by the ADMET PredictorTM.
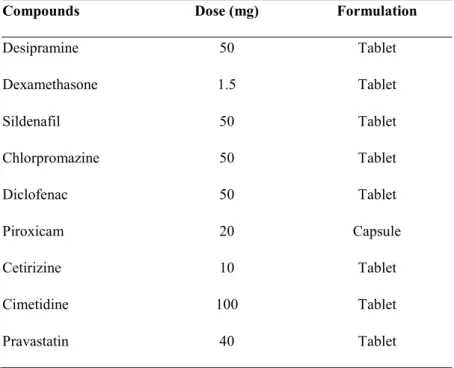
Other input parameters such as particle size, precipitation time,etc., were used as provided by default. The dose and formulation used for simulation are shown in Table 2.
Statistical analysis
Root mean square error (RMSE) was calculated to assess the discrepancies between datasets.
RMSE was normalised by the range of each dataset so that it is always between 0-1.
RESULTS AND DISCUSSION Permeability assay
ThePapp values obtained from the permeability study in our laboratory are listed in Table 3. HumanPeff orFavalues plotted against Caco-2Papp values from our laboratory are shown in Figure 1. These trends in Figure 1 are in agreement with previously reported results [1-4, 7].
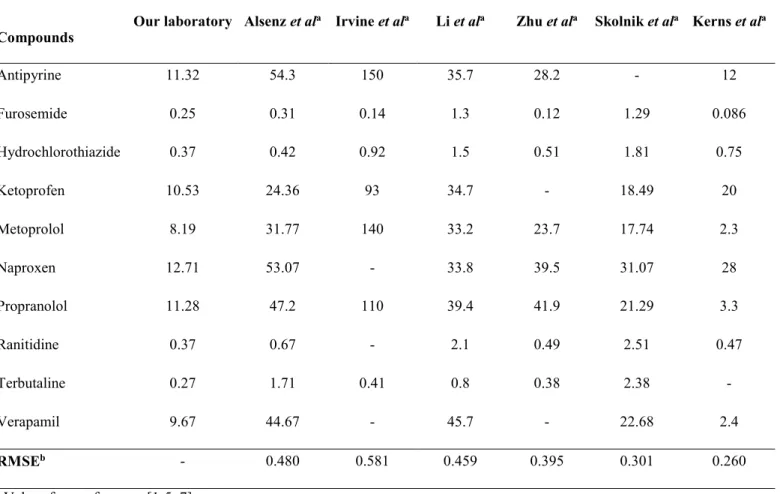
However, substantial differences were found across the datasets from different laboratories for
absolute Papp values for each individual compound (Table 3). This was demonstrated by the RMSE value, which was as high as 0.581 between thePappvalues in our laboratory and Irvine
Simulation ofFa
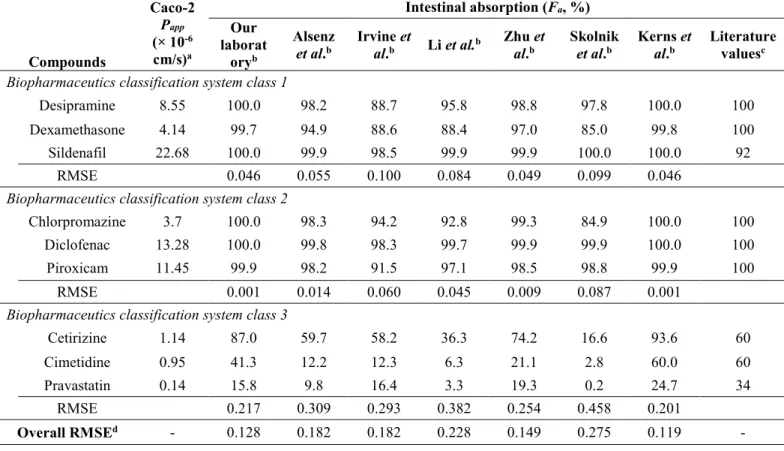
In order to demonstrate the potential consequence of directly comparing Papp values across laboratories,Fawas simulated using GastroPlusTMfor the application set compounds (Table 4). The simulation was performed by applying the Papp values obtained from our laboratory to permeability models calibrated with different datasets. The RMSE values were calculated to
assess the differences between the simulatedFavalues andFavalues reported in the literature. The RMSE for Fa of the application set compounds simulated after calibration usingPapp of the training set compounds from our laboratory was 0.128. When calibration usingPappof the training set compounds from other literature datasets were applied, the RMSE values for Fa
across all of the application set compounds were higher in all except one case (0.119-0.275).
Based on these high RMSE values, it can be seen that direct comparison of Caco-2 permeability
results measured experimentally to those reported by a different laboratory can mislead
interpretation and the subsequent predictions.
The RMSE values were further analysed according to biopharmaceutical classification system
(BCS) classes (Figure 2). BCS class 3 compounds showed higher RMSE values than class 1 or
2, indicating that permeability-limited compounds can be more sensitive to the lab-to-lab
variability. Additionally, it should be stressed thatPappvalues of known compounds (such as those in the training set) have to be evaluated before any permeability assessment can be made
from a particular experimental setting. The literature dataset of Kernset al. was an exception, where the RMSE was lower (0.119) than for the experimental results obtained in our laboratory.
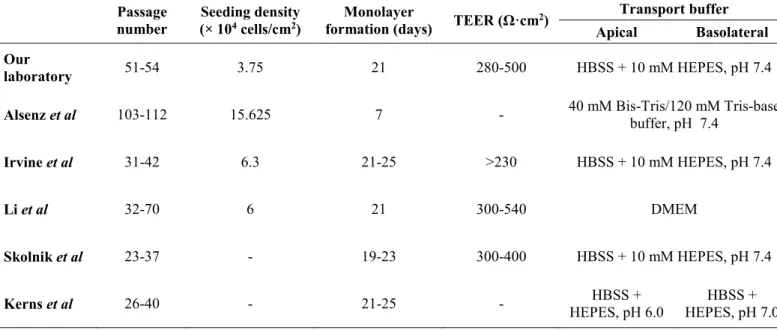
In conclusion, Caco-2 cell permeability results for the same compounds can differ substantially
between different laboratories. This variability can be caused by multiple factors related to the
formation period, TEER achieved and transport buffer used. Specific experimental setups used
in different laboratories are summarised in Table 5. The experimental differences in
permeability can be critical, especially when it comes to application of these results, such as
prediction of Fa. This study shows quantitative lab-to-lab variability of Caco-2 permeability results and the potential consequences this can have in application of these results in predicting
intestinal absorption of drugs.
ACKNOWLEDGEMENTS
The authors would like to acknowledge Prof. Ian Dryden for his advice on statistical analysis
in this study, and Paloma Benito-Gallo for help with bioanalysis. GastroPlus™software was
kindly provided by Simulations Plus, Inc, Lancaster, California, USA.
REFERENCES
[10-13]
[1] J.D. Irvine, L. Takahashi, K. Lockhart, J. Cheong, J.W. Tolan, H.E. Selick, J.R. Grove,
MDCK (Madin-Darby canine kidney) cells: A tool for membrane permeability screening, J
Pharm Sci, 88 (1999) 28-33.
[2] C. Li, T. Liu, X. Cui, A.S. Uss, K.C. Cheng, Development of in vitro pharmacokinetic
screens using Caco-2, human hepatocyte, and Caco-2/human hepatocyte hybrid systems for the
prediction of oral bioavailability in humans, J Biomol Screen, 12 (2007) 1084-1091.
[3] C. Zhu, L. Jiang, T.M. Chen, K.K. Hwang, A comparative study of artificial membrane
permeability assay for high throughput profiling of drug absorption potential, Eur J Med Chem,
37 (2002) 399-407.
[4] S. Skolnik, X. Lin, J. Wang, X.H. Chen, T. He, B. Zhang, Towards prediction of in vivo
[5] E.H. Kerns, L. Di, S. Petusky, M. Farris, R. Ley, P. Jupp, Combined application of parallel
artificial membrane permeability assay and Caco-2 permeability assays in drug discovery, J
Pharm Sci, 93 (2004) 1440-1453.
[6] D.A. Volpe, Variability in Caco-2 and MDCK cell-based intestinal permeability assays, J
Pharm Sci, 97 (2008) 712-725.
[7] J. Alsenz, E. Haenel, Development of a 7-day, 96-well Caco-2 permeability assay with
high-throughput direct UV compound analysis, Pharm Res, 20 (2003) 1961-1969.
[8] I. Hubatsch, E.G. Ragnarsson, P. Artursson, Determination of drug permeability and
prediction of drug absorption in Caco-2 monolayers, Nat Protoc, 2 (2007) 2111-2119.
[9] D.A. Taha, C.H. De Moor, D.A. Barrett, J.B. Lee, R.D. Gandhi, C.W. Hoo, P. Gershkovich,
The role of acid-base imbalance in statin-induced myotoxicity, Transl Res, (2016).
[10] C.A. Larregieu, L.Z. Benet, Distinguishing between the permeability relationships with
absorption and metabolism to improve BCS and BDDCS predictions in early drug discovery,
Mol Pharm, 11 (2014) 1335-1344.
[11] M.V. Varma, K. Sateesh, R. Panchagnula, Functional role of P-glycoprotein in limiting
intestinal absorption of drugs: contribution of passive permeability to P-glycoprotein mediated
efflux transport, Mol Pharm, 2 (2005) 12-21.
[12] M. Yazdanian, S.L. Glynn, J.L. Wright, A. Hawi, Correlating partitioning and caco-2 cell
permeability of structurally diverse small molecular weight compounds, Pharm Res, 15 (1998)
1490-1494.
[13] G.J. Muirhead, D.J. Rance, D.K. Walker, P. Wastall, Comparative human
pharmacokinetics and metabolism of single-dose oral and intravenous sildenafil, Br J Clin
FIGURE CAPTIONS
Figure 1. Correlation between Caco-2Papp values from experimental results and human Peff
values from the literature (A) and human Fa values from literature (B). Peff values are from reference [7] andFavalues are from references [1-4, 10-13].
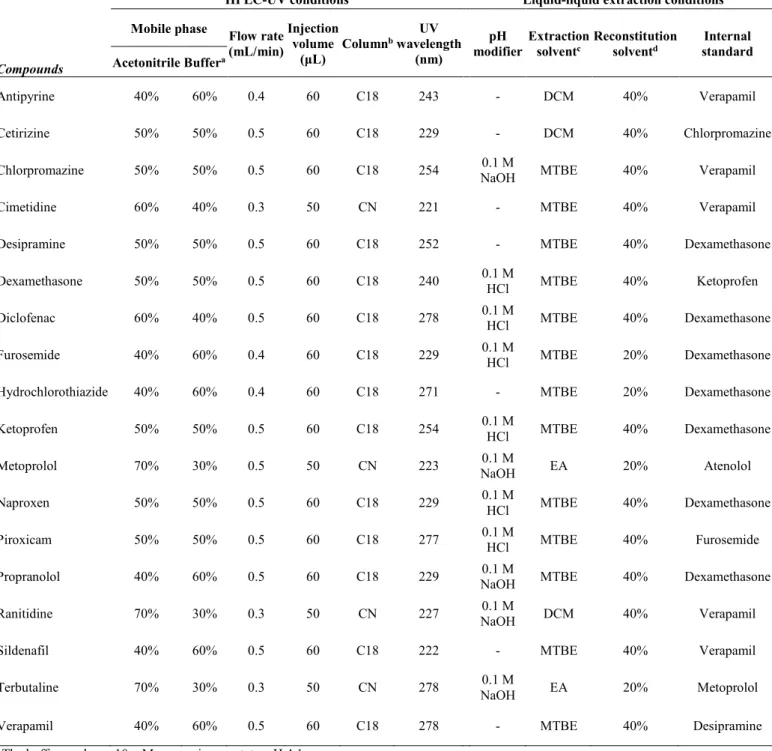
Table 1.Analytical methods including HPLC-UV and liquid-liquid extraction procedures for studied
compounds
Compounds
HPLC-UV conditions Liquid-liquid extraction conditions
Mobile phase Flow rate (mL/min)
Injection volume
(μL) Column
bwavelengthUV
(nm)
pH
modifier Extractionsolventc Reconstitutionsolventd standardInternal
Acetonitrile Buffera
Antipyrine 40% 60% 0.4 60 C18 243 - DCM 40% Verapamil
Cetirizine 50% 50% 0.5 60 C18 229 - DCM 40% Chlorpromazine
Chlorpromazine 50% 50% 0.5 60 C18 254 NaOH0.1 M MTBE 40% Verapamil
Cimetidine 60% 40% 0.3 50 CN 221 - MTBE 40% Verapamil
Desipramine 50% 50% 0.5 60 C18 252 - MTBE 40% Dexamethasone
Dexamethasone 50% 50% 0.5 60 C18 240 0.1 MHCl MTBE 40% Ketoprofen
Diclofenac 60% 40% 0.5 60 C18 278 0.1 MHCl MTBE 40% Dexamethasone
Furosemide 40% 60% 0.4 60 C18 229 0.1 MHCl MTBE 20% Dexamethasone
Hydrochlorothiazide 40% 60% 0.4 60 C18 271 - MTBE 20% Dexamethasone
Ketoprofen 50% 50% 0.5 60 C18 254 0.1 MHCl MTBE 40% Dexamethasone
Metoprolol 70% 30% 0.5 50 CN 223 NaOH0.1 M EA 20% Atenolol
Naproxen 50% 50% 0.5 60 C18 229 0.1 MHCl MTBE 40% Dexamethasone
Piroxicam 50% 50% 0.5 60 C18 277 0.1 MHCl MTBE 40% Furosemide
Propranolol 40% 60% 0.5 60 C18 229 NaOH0.1 M MTBE 40% Dexamethasone
Ranitidine 70% 30% 0.3 50 CN 227 NaOH0.1 M DCM 40% Verapamil
Sildenafil 40% 60% 0.5 60 C18 222 - MTBE 40% Verapamil
Terbutaline 70% 30% 0.3 50 CN 278 NaOH0.1 M EA 20% Metoprolol
Verapamil 40% 60% 0.5 60 C18 278 - MTBE 40% Desipramine
aThe buffer used was 10 mM ammonium acetate, pH 4.1
bHPLC columns were as follows: C18, Gemini C18 4.6 × 250 mm, 5 μm particle size; CN, Luna CN 4.6 × 150 mm, 5 μm particle size
cExtraction solvents were as follows: DCM, dichloromethane; MTBE, methyl-tert-butyl ether; EA, ethyl acetate
Table 2.Dose and formulation input parameters of application set compounds for GastroPlusTMsimulation
Compounds Dose (mg) Formulation
Desipramine 50 Tablet
Dexamethasone 1.5 Tablet
Sildenafil 50 Tablet
Chlorpromazine 50 Tablet
Diclofenac 50 Tablet
Piroxicam 20 Capsule
Cetirizine 10 Tablet
Cimetidine 100 Tablet
Table 3.Pappvalues of training set compounds from our laboratory and six different literature datasets
Compounds
Apparent permeability coefficient(Papp,× 10-6cm/s)
Our laboratory Alsenzet ala Irvineet ala Liet ala Zhuet ala Skolniket ala Kernset ala
Antipyrine 11.32 54.3 150 35.7 28.2 - 12
Furosemide 0.25 0.31 0.14 1.3 0.12 1.29 0.086
Hydrochlorothiazide 0.37 0.42 0.92 1.5 0.51 1.81 0.75
Ketoprofen 10.53 24.36 93 34.7 - 18.49 20
Metoprolol 8.19 31.77 140 33.2 23.7 17.74 2.3
Naproxen 12.71 53.07 - 33.8 39.5 31.07 28
Propranolol 11.28 47.2 110 39.4 41.9 21.29 3.3
Ranitidine 0.37 0.67 - 2.1 0.49 2.51 0.47
Terbutaline 0.27 1.71 0.41 0.8 0.38 2.38
-Verapamil 9.67 44.67 - 45.7 - 22.68 2.4
RMSEb - 0.480 0.581 0.459 0.395 0.301 0.260
aValues from references [1-5, 7]
bRoot mean square error between each set ofP
Table 4.Caco-2Pappvalues and simulatedFavalues of application set compounds
Compounds
Caco-2
Papp (× 10-6
cm/s)a
Intestinal absorption (Fa, %) Our
laborat oryb
Alsenz
et al.b Irvineal.b et Liet al.b Zhual.bet Skolniket al.b Kernsal.b et Literaturevaluesc
Biopharmaceutics classification system class 1
Desipramine 8.55 100.0 98.2 88.7 95.8 98.8 97.8 100.0 100
Dexamethasone 4.14 99.7 94.9 88.6 88.4 97.0 85.0 99.8 100
Sildenafil 22.68 100.0 99.9 98.5 99.9 99.9 100.0 100.0 92
RMSE 0.046 0.055 0.100 0.084 0.049 0.099 0.046
Biopharmaceutics classification system class 2
Chlorpromazine 3.7 100.0 98.3 94.2 92.8 99.3 84.9 100.0 100
Diclofenac 13.28 100.0 99.8 98.3 99.7 99.9 99.9 100.0 100
Piroxicam 11.45 99.9 98.2 91.5 97.1 98.5 98.8 99.9 100
RMSE 0.001 0.014 0.060 0.045 0.009 0.087 0.001
Biopharmaceutics classification system class 3
Cetirizine 1.14 87.0 59.7 58.2 36.3 74.2 16.6 93.6 60
Cimetidine 0.95 41.3 12.2 12.3 6.3 21.1 2.8 60.0 60
Pravastatin 0.14 15.8 9.8 16.4 3.3 19.3 0.2 24.7 34
RMSE 0.217 0.309 0.293 0.382 0.254 0.458 0.201
Overall RMSEd - 0.128 0.182 0.182 0.228 0.149 0.275 0.119
-aValues experimentally obtained from current study`
bGastroPlusTMsimulatedFavalues based on user-defined permeability models established using datasets from our laboratory,
Alsenzet al, Irvineet al, Liet al, Zhuet al, Skolniket aland Kernset al, respectively
cExperimental values of intestinal absorption in humans from references [1-4, 10-13]
dRoot mean square error between each set ofF
Table 5.Different experimental settings used in different laboratories for Caco-2 permeability assays
Passage number
Seeding density
(× 104cells/cm2) formation (days)Monolayer TEER (Ω·cm2)
Transport buffer Apical Basolateral Our
laboratory 51-54 3.75 21 280-500 HBSS + 10 mM HEPES, pH 7.4
Alsenzet al 103-112 15.625 7 - 40 mM Bis-Tris/120 mM Tris-basebuffer, pH 7.4
Irvineet al 31-42 6.3 21-25 >230 HBSS + 10 mM HEPES, pH 7.4
Liet al 32-70 6 21 300-540 DMEM
Skolniket al 23-37 - 19-23 300-400 HBSS + 10 mM HEPES, pH 7.4
Supplementary material to:
Quantitative analysis of lab-to-lab variability in Caco-2 permeability assays
Jong Bong Lee1, Atheer Zgair1,2, Dhiaa A Taha1, Xiaowei Zang3, Leonid Kagan3, Tae Hwan
Kim4, Min Gi Kim4, Hwi-yeol Yun5, Peter M Fischer1and Pavel Gershkovich1*
1School of Pharmacy, University of Nottingham, Nottingham, UK
2College of Pharmacy, University of Anbar, Anbar, Iraq
3Department of Pharmaceutics, Ernest Mario School of Pharmacy, Rutgers, The State
University of New Jersey, Piscataway, NJ, USA
4School of Pharmacy, Sungkyunkwan University, Suwon, Republic of Korea
5College of Pharmacy, Chungnam National University, Daejeon, Republic of Korea
*Corresponding author:Pavel Gershkovich, PhD
School of Pharmacy, Centre for Biomolecular Sciences
University of Nottingham, University Park
Nottingham, UK
NG7 2RD
Tel: +44 (0) 115 846 8014
Fax: +44 (0) 115 951 3412
In GastroPlusTM,P
appvalues of compounds with knownPeffcan be given as input to establish
a “user-defined permeability model”. An example of a “user-defined permeability model”
setup is shown in Supplementary Figure 1. GastroPlusTM provides a list of compounds for
which the software has known values ofPeff(thesePeffvalues are not shown to the users). When
the user inputs Papp values of these compounds, GastroPlusTM performs internal correlation
between the input Papp values and their Peff values. The users are then informed of the
regression results of the internal correlation. ThePapp value of the compound of interest can
then be applied to this “user-defined permeability model” to give an estimate of thePeffvalue.
Therefore, establishing a “user-defined permeability model” represents calibration of the
permeability model in GastroPlusTM. Most importantly, same permeability value can result in
different simulation results depending on how the “user-defined permeability model” is
determined. In this study, samePappvalues of application set compounds have been applied to
different “user-defined permeability models” established by Papp values of training set
Supplementary Figure 1. Establishment of a “user-defined permeability model” in
GastroPlusTM. The “BCS Compound” refers to the list of reference compounds provided by
GastroPlusTM. ThePappvalues of these reference compounds are given as input in the “Exp
Perm” column. Following the internal correlation process (initiated by clicking the “Solve”
button), regression results are shown for the correlation. The user can select the models
between “Linear”, “Log Linear” or “Power”, after analysing the parameters of each model.
Following this process, the user inputs the Papp value for the compound of interest in the
“Current Primary Permeability” box. After all these processes, thePeffvalue estimated by the
“user-defined permeability model” will be given in the “Human Peff Estimate with Selected