Efficient Modeling and Representation of
Agreement in Interval-Valued Data
Timothy C. Havens
Dept. of Electrical and Computer Eng. and Computer Science Michigan Technological University
Houghton, MI, USA Email: [email protected]
Christian Wagner
Inst. Computing & Cybersystems Michigan Technological University, USA and LUCID, School of Computer ScienceUniversity of Nottingham, UK Email: [email protected]
Derek T. Anderson
Dept. of Electrical and Computer Eng. Mississippi State University Mississippi State, MS, USA Email: [email protected]
Abstract—Recently, there has been much research into effective representation and analysis of uncertainty in human responses, with applications in cyber-security, forest and wildlife manage-ment, and product developmanage-ment, to name a few. Most of this research has focused on representing the response uncertainty as intervals, e.g., “I give the movie between 2 and 4 stars.” In this paper, we extend upon the model-based interval agreement approach (IAA) for combining interval data into fuzzy sets and propose the efficient IAA (eIAA) algorithm, which enables effi-cient representation of and operation on the fuzzy sets produced by IAA (and other interval-based approaches, for that matter). We develop methods for efficiently modeling, representing, and aggregating both crisp and uncertain interval data (where the interval endpoints are intervals themselves). These intervals are assumed to be collected from individual or multiple survey respondents over single or repeated surveys; although, without loss of generality, the approaches put forth in this paper could be used for any interval-based data where representation and analysis is desired. The proposed method is designed to minimize loss of information when transferring the interval-based data into fuzzy set models and then when projecting onto a compressed set of basis functions. We provide full details of eIAA and demonstrate it on real-world and synthetic data.
I. INTRODUCTION
Surveys have long been a powerful way to elicit information and knowledge from groups of individuals and, recently, crowd-sourcing—surveying large groups of people to solve problems—has become a very popular research topic. The in-formation has many uses, from analysis of results to inference of conclusions, relationships, or decision-making dynamics. Recently, there has been much interest in employing survey tools that enable the capture of response uncertainty with special emphasis on the creation of expert and decision-support systems that take uncertainty into account [1–4]. Fuzzy logic, in particular, has been found to be effective for analysis of survey results, withType-2(T2) fuzzy logic and, the related, Computing with Wordsparadigm leading the pack [1, 3–7].
The aforementioned uncertainty in survey data comes from many factors, but, in particular, two main contributors that we address are i) inter-expert uncertainty: the variation among the individual opinions in a group of participants; and ii) intra-expert uncertainty: the variation (or vagueness) in the opinions of individual participants - usually over time. While intra-expert uncertainty can come from either dynamic
(a) Less uncertain survey response
[image:1.612.312.564.229.322.2](b) More uncertain survey response
Fig. 1: Example of interval responses from a real survey, where (a) is more certain than (b). (from [8])
uncertainty—the respondent changes his answer when repeat-edly queried—or indecision—the respondent is unsure about their response—we will, in this paper, simply assume that survey responses come in one of two forms: i) a T1 interval or ii) a T2 interval. Figure 1 shows two examples of what a T1 interval response looks like. In view (a), a fairly certain interval-response is shown, while view (b) shows a more uncertain interval.
TABLE I: Acronyms and Notation
IAA Interval Agreement Approach FS Fuzzy Set UMF Upper Membership Function T1 Type-1 LMF Lower Membership Function T2 Type-2
IT2 Interval Type-2 GT2 General Type-2 LBS Linguistic Basis Set GBS General Basis Set FOU Footprint of Uncertainty
Notation Definition
µA(x) Membership ofAat valuex
¯
A= [lA¯, rA¯] Interval between valueslandr(see Fig. 2a)
¨
A= [¯lA¨,¯rA¨] Uncertain interval between values ¯l = [l¯l, r¯l], and
¯
r= [lr¯, rr¯](see Fig. 2b)
i= [n] The set of integers,i= 1,2, . . . , n i= [a:b] The set of integers,i=a, a+ 1, . . . , b
1m m-length vector of ones
0m m-length vector of zeroes
λ(x) Linguistic basis function, λ : x → [0,1] (see Definition 1)
φ(x) General basis function,φ:x→ R
in the input set of intervals—often the difference of 100s or 1,000s of endpoints versus 10s of weights. This not only produces an efficient representation of the FS, but also reduces the computational complexity of FS operations further down the analysis pipeline.
This paper is organized as follows. Section II provides a brief background on the topics addressed in this paper, while Section III describes how sets of intervals can be aggregated into FSs—namely, the IAA method. Section IV proposes the efficient IAA (eIAA) method and Section V demonstrates eIAA on some real survey data. Finally, Section VI briefly summarizes this paper. Select acronyms and notation are contained in Table I.
II. BACKGROUND
In this section we provide a verybrief introduction to the interval and FS models used in this paper [9]. For a more thorough treatment of these topics, please see refs. [8–10].
A. Crisp and Uncertain Intervals
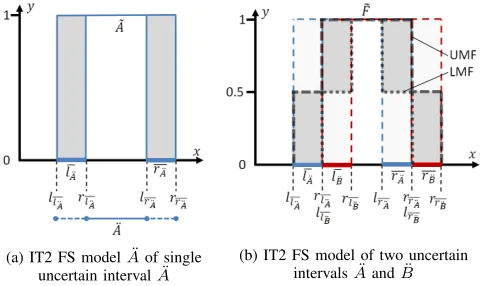
Two types of intervals are considered in this paper: i)crisp intervals, and ii) uncertain intervals [8]. These intervals are shown in Fig. 2. Crisp intervals are denoted as A¯= [lA¯, rA¯],
where lA¯ is the left endpoint and rA¯ is the right endpoint.
Uncertain intervals are denoted asB¨= [¯lB¨,¯rB¨], where the left
and right endpoints are intervals themselves: ¯lB¨ = [ll¯B¨, r¯lB¨]
andr¯B¨= [l¯rB¨, rr¯B¨].
B. Interval Type-2 Fuzzy Sets
[image:2.612.320.557.138.272.2] [image:2.612.314.564.610.649.2]GT2 FSs [9] were first introduced by Zadeh [11] as a generalization of T1 FSs. In these sets, the membership µat each point on the domainxis itself defined as a T1 FS. GT2 FSs introduce a burdensome computational complexity and thus many representations, simplifications, and approximations have been introduced to make application of GT2 FSs tractable [10, 12–14]. One of these is the IT2 FS [15], where the T2 FS is considered to have a secondary membership that is 1 on an interval [¯y(x), y(x)]. The primary membership function that follows y¯(x)is called the upper membership function(UMF)
Fig. 2: Illustration of a crisp interval A¯ = [lA¯, rA¯], and
an uncertain interval B¨ = [¯lB¯,r¯B¯] (where for an uncertain
interval each endpoint is itself an interval). (from [8])
(a) T1 FS modelAof single crisp intervalA¯
(b) T1 FS modelF of two crisp intervalsA¯andB¯
Fig. 3: Modeling crisp intervals as FSs using IAA. (from [8])
and the membership function that follows y(x) is the lower membership function (LMF), where both the UMF and LMF are T1 FSs [16].
Commonly, the membership function of a T1 FS is notated as µ, while for T2 FSs the primary membership is denotedu and the secondary membership is denotedµ[16]. The primary membership is on the y, or vertical, axis and the secondary membership is on the z, or “towards-you,” axis. An IT2 FS is fully described by its UMF and LMF, where the IT2 FSA has the (secondary) membership function that has values of 1 between the UMF and LMF.
III. FUZZYSETSFROMINTERVALS
The IAA approach generates FSs from sets of intervals. Two cases are considered: i) crisp intervals A¯ = [lA¯, rA¯], and ii)
uncertain intervals,A¨= [¯lA¯,r¯A¯]. For the first case, the result
of IAA is a T1 FS; for the case of uncertain intervals, IAA produces an IT2 FS.
A. Crisp intervalsA¯
Let A = {A¯1, . . . ,A¯n} be a set of intervals. Then the degree of membership of the set over the survey domain x captures the number of intervals that are overlapping—i.e., are in agreement—at a particular point. Hence, the T1 FSA defined by the membership functionµA is described by
µA= n
X
i=1
yi/
n−i+1
[
j1=1
n−i+2
[
j2=j1+1
· · · n
[
ji=ji−1+1
( ¯Aj1∩ · · · ∩A¯ji)
(1)
purposes in two different ways. First, for any value x, we can simply count the number of intervals in which xresides, computing the membership as
µA(x) =
Pn
i=1µA¯i(x)
n , (2a)
µA¯
i(x) = (
1 lA¯
i ≤x≤rA¯i,
0 else. (2b) The second simple formulation is convenient if one wishes to compute all the locations in the membership function where transitions from one levelyi to eitheryi−1 oryi+1 occur. It is
easy to show that the membership function can be calculated as
µA(x) =
1
n n
X
i=1
(lA¯i ≤x)−
N
X
i=1
(rA¯i ≤x)
!
, (3)
where this gives the membership of A at xby counting the number of left endpoints in A less than x and subtracting the number of right endpoints in A less than x.1 Thus, let
XA={x1, . . . , x2n} be the set of sorted interval endpoints, where x1 ≤x2 ≤. . . ≤x2n, and let B ={b1, . . . , b2n} be an associated set of indicator variables, where bi = +1if xi is a left interval endpoint andbi =−1ifxiis a right interval endpoint. Then,
uA(x1) = 1/n, (4a)
uA(xi) =uA(xi−1) +bi/n, i= [2 : 2n]. (4b) Using this formulation, one can build up the membership func-tion by looping through X, fromx1 tox2n. The membership at any other valuexis simply
uA(x) =
(
uA(xi) xi≤x < xi+1, i= [2n−1]
0 else. (5) When the intervals are presented with uncertain endpoints, IAA produces IT2 FSs, which we describe next.
B. Uncertain intervals A¨
Let A¨ = {A¨1, . . . ,A¨N} be a set of uncertain intervals, where the interval endpoints are represented as having interval uncertainty themselves. To combine uncertain intervals, we proceed similarly as for crisp intervals; however, we apply (1) independently for all “outer” and “inner” endpoints, resulting in a T1 UMF and LMF, respectively, of an IT2 FS. Let
¨
Ai = [¯li,r¯i] notate the ith uncertain interval in A¨. Also, let the outermost (most uncertain) set of intervals in A¨beA¨U =
l¯l
1, r¯r1
, . . . , l¯l
n, r¯rn , and the innermost (least uncertain)
set of intervals in A¨ be A¨L =
r¯l
1, l¯r1
, . . . , r¯l
n, l¯rn .
Then, mathematically, the following operations produce the IT2 FS A˜ that modelsA¨,
UMF
˜
A=IAA
¨
AU
; LMF
˜
A=IAA
¨
AL
. (6)
1Note that the second efficient formulation ofµ
A considers the intervals
to beAi= [l, r), where the right endpoint is not included in the interval.
(a) IT2 FS modelA¨of single uncertain intervalA¨
[image:3.612.316.557.49.192.2](b) IT2 FS model of two uncertain intervalsA¨andB¨
[image:3.612.113.239.93.146.2]Fig. 4: Modeling uncertain intervals as IT2 FSs using IAA— uncertainty around interval endpoints is shaded. (from [8])
Figure 4 illustrates the process of using IAA to generate an IT2 FS from uncertain intervals. As was noted in our previous work [8], if the intervals inA¨are crisp—i.e.,¯l= [l, l]and¯r= [r, r]—then the UMF simply equals the LMF, thus producing a T1 FS. In other words, IAA is generalized to produce the most parsimonious model from the input intervals: a T1 FS for crisp intervals and an IT2 FS for uncertain intervals.
C. Computational Complexity of IAA
While IAA has been shown to be effective in representing interval survey data [8], a potential weakness is in the way it represents the FSs which model the combined interval data -in particular when a high number of -intervals are considered. For crisp intervals, the resulting T1 FS that represents n intervals is be modeled by (at most)2npairs of domain values and the membership at that value, {X, µ(X)}2n—assuming unique interval endpoints for the survey responses—where (5) is used to determine the membership from these pairs. For uncertain intervals both the UMF and LMF must be modeled, resulting in4npairs. While this is not unreasonable for modern storage, this can cause FS operations on these models to be computationally expensive.
Consider two T1 FSs as modeled by IAA, A → {X, µA(X)}2n andB → {Y, µB(Y)}2m, whereArepresents nintervals andBrepresentsmintervals. To compute the oper-ationA∪B, one can apply (7) on the sorted sets produced by (5). This, however, can result in a union set that, in the worst case, is represented as4nmpairs,{X∪Y, µA∪B(X∪Y)}4nm. Furthermore, computing (7) costsO(n+m)computations: the cost of sorting z into X andY. In the next section, we will show how an approximation based on a linear-constraint least squares problem can reduce this cost.
IV. EFFICIENTIAA
Consider a FS as modeled by IAA, A → {X, µA(X)}
µA∪B(z) =
(
max{µA(xi), µB(yj)} xi≤z≤xi+1, i= [2n−1], yj≤z≤yj+1, j= [2m−1],
0 else. (7)
function are compressed into the sum of m weighted basis functions, where m2n.
We consider two different types of basis sets: linguistic basis sets (LBS) and general basis sets (GBS). The method for each type of basis is formulated to ensure that the resulting compressed membership function has membership degrees on
[0,1], and that the approximation error is minimized. The LBS representation puts a constraint on the basis function and weights, which ensures that the compressed membership function is on[0,1]throughout the entire real-valued range of the survey. This comes at a cost of the design of the LBS; i.e., not all basis sets are LBSs. With a GBS, one can use any set of basis functions on the range of the survey, but the resulting membership function is not guaranteed to be on[0,1]
for the entire survey range. It will, however, be on[0,1]at the locations modeled by IAA: the 2n interval end-points in the survey responses. So, the GBS is flexible in that it can use any basis set, but in practice may need a clipping function to ensure that the compressed membership function returns values in[0,1]. We now describe the compression process for each of LBS and GBS.
A. Linguistic Basis Functions
Consider a set of linguistic basis functions Λ(x) =
{λ1(x), . . . , λm(x)} on the range of the survey, as defined in Definition 1. The properties ofΛare such that at any value xin the survey domain, the sum of the basis functions equals 1. Since we will be modeling µA(x)by the weighted sum of this basis set, this ensures we can achieve a membership at any value in [0,1]in the survey domain.
Definition 1 (Linguistic Basis Set). Λ(x) =
{λ1(x), . . . , λ(x)m}is a set of basis functions,λi:x→[0,1], such that
m
X
i=1
λi(x) = 1, ∀x∈survey domain.
We callΛ(x)aLinguistic Basis Set(LBS) as the individual basis functions λi(x) represent linguistic elements of the survey range: e.g., ‘very low,’ ‘low,’ ‘medium,’ ‘high,’ ‘very high,’ and, also, the set of all linguistic elements can be combined to form the core of the survey. Figure 5 shows an example of an LBS with 5 basis functions on the survey range
[0,10].
LetµA(x)be represented as the weighted sum of an LBS,
ˆ
µA(x;w) = m
X
i=1
wiλi(x), (8)
where w = (w1, . . . , wm)T is the vector of weights on the respective basis functions, λi(x). Ifwi∈[0,1], then it is easy
x
0 2 4 6 8 10
?
(x)
[image:4.612.379.495.115.175.2]0 0.5 1
Fig. 5: Example of an LBS on the survey range [0,10]—the linguistic interpretation of the basis functions could be ‘very low,’ ‘low,’ ‘medium,’ ‘high,’ and ‘very high,’ from left to right.
to see that 0 ≤ µˆA(x;w) ≤ 1, ∀w and ∀x in the survey domain. Hence, to get the “best” µˆA(x;w) representation of µA(x), we wish to solve the squared-error objective,
w∗= arg min
w
1 2
X
i
kµA(xi)−µˆA(xi;w)k2, w∈[0,1]m. (9) The squared-error objective at (9) is a linearly constrained least-squares problem, which can be solved by using Matlab’s lsqlin routine. However, for generalization purposes (and for later work we will propose on this problem), we now write (9) in its matrix-vector form. Let x = (x1, . . . , x2n)T be a vector of the set of values at which µA(x) is mod-eled by IAA.2 Let u
A = (µA(x1), . . . , µA(x2n))T be the vector of the membership values of A at x, and uˆA(w) =
(ˆµA(x1;w), . . . ,µˆA(x2n;w)) T
is similarly defined. Finally, letΛ = [λj(xi)]2n×mbe the matrix where theith row andjth column is λj(xi). It is easy to see that (8) isuˆA(w) = Λw. Then the squared-error term of (9) can be rewritten as
1 2
X
i
kµA(xi)−µˆA(xi;w)k2=
= 1 2u
T AuA+
1 2uˆA(w)
Tuˆ
A(w)−uTAuˆA(w),
= 1 2u
T AuA+
1 2w
TΛTΛw−uT AΛw. SinceuT
AuA is a constant term, (9) can be rewritten as
w∗ = arg min
w
1 2w
TΛTΛw−uT
AΛw, w∈[0,1] m.
(10)
Equation (10) is a standard linear-constraint quadratic pro-gramming(QP) problem,
arg min
w
1 2w
THw+fTw, Cw
≤b, (11)
which can be solved by nearly any available QP solver, such asquadprogin Matlab. To express (10) as (11),H = ΛTΛ, f =−ΛTuA,C= (1T
B. General Basis Functions
Consider a set of general basis functions Φ(x) =
{φ1(x), . . . , φm(x)} on the survey domain, whereφi :x → R. Unlike an LBS described in Definition 1, this set of basis functions follows no specified definition other than mapping x to the real number line. Let µA(x) be represented as the weighted sum ofΦ(x),
ˆ
µA(x;w) = m
X
i=1
wiφi(x), (12) where w = (w1, . . . , wm)T is the vector of weights on the respective basis functions, φi(x). Rather than constrainingw directly to ensure that µˆA(x;w) has membership degrees on
[0,1], as we did with the LBS, the constraint for the GBS representation will be applied in the squared-error objective.
Again, consider the vector representations defined earlier,x, uA, anduˆA, and let Φ = [φj(xi)]2n×mbe the matrix where theith row andjth column isφj(xi). Thus, (12) isuˆA= Φw. Going through the same process as we did for the LBS, the squared-error objective can be written as
w∗= arg min
w
1 2w
TΦTΦw−uT
AΦw, Φw∈[0,1]
2n, (13)
where the constraint now is onuˆA= Φwto be on the interval
[0,1]. The objective function at (13) can be expressed as either a linear-constraint least square problem or as the QP at (11) by H = ΦTΦ, f = −ΦTuA, b = (1T
m,0Tm)T, and C =
[ΦT −ΦT]T. C. Discussion
The LBS weights, given that they are on the interval
[0,1], not only represent a FS, but also are themselves FSs that represent the membership in each of the linguistic basis functions. Hence, if the LBS can be described by linguistic terms, such as ‘big’ or ‘small,’ then the weights represent the contribution of that linguistic term in the FS representing the survey responses. Section V demonstrates this for a survey where respondents were asked to indicate the interval between 0 and 10 that represents the word ‘little.’
Another attractive aspect of the basis function representation—either LBS or GBS—is that FS operations can be directly applied to the basis functions. Consider two FSs, A and B, represented on the basis shown in Fig. 6, A → wA = (0.1,0.6,0.4,0.05,0.01)T and B → wB = (0.5,0.2,0,0.01,0.3)T; illustrated in Fig. 6(a). The intersection of these two sets is shown in view (b), which is calculated by
(A∩B)(z) = min
( 5
X
i=1
(wA)iφi(z),
5
X
i=1
(wB)iφi(z)
)
.
The computational complexity of computing A ? B using the basis functions is O(m), where, to computeA ? B using the original IAA representation is O(nA+nB), which is the cost of sorting z into the IAA set of ordinals X and Y— assuming that there arenAintervals inAandnB inB. Since
Survey Range
0 2 4 6 8 10
Membership
0 0.5
1 A
B
(a)AandB
Survey Range
0 2 4 6 8 10
Membership
0 0.5 1
[image:5.612.313.561.51.123.2](b)A∩B
Fig. 6: Example of fuzzy intersection applied to FSsAandB using the LBS representation.
Survey Range
0 2 4 6 8 10
Survey Number
0 20 40 60 80 100 120 140 160 180
(a) Survey responses
Survey Range
0 2 4 6 8 10
Membership
0 0.2 0.4 0.6 0.8 1
IAA eIAA-5 eIAA-7 eIAA-15
(b) IAA and eIAA results
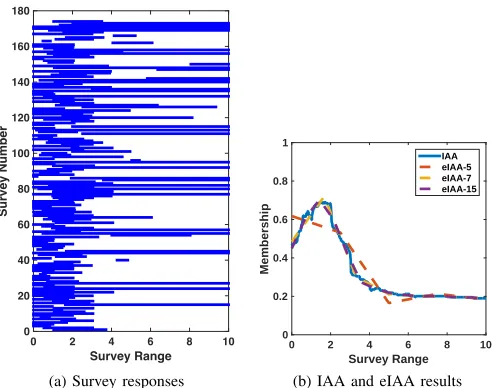
Fig. 7: (a) Survey responses for linguistic meaning of ‘little’ [7]. Each horizontal blue line indicates a survey response. (b) IAA and eIAA results for ’little’ survey responses.
m (nA+nB), the basis function representation is more efficient.
For IT2 FSs, which are the result of IAA with uncertain interval inputs, the IT2 FS is completely defined by its UMF and LMF; hence, eIAA can simply be used on each of these two defining sets. Thus, this makes eIAA also useful for the case of uncertain interval inputs.
V. DEMONSTRATION
Figure 7(a) shows 174 survey responses where the respon-dents were asked to indicate the interval for ‘little’ on a scale of 0-10 (see [7] for a full description of these data). Clearly, most respondents indicated ‘little’ as being on the low end of the scale. The blue line in Fig. 7(b) shows the IAA model and the dotted lines indicate the eIAA models of the 174 interval responses. The eIAA membership functions were built with 5, 7, and 15 basis functions. The weighted basis functions are shown in Fig. 8. As expected, as the number of basis functions is increased, the eIAA approximation of the IAA membership function is improved. The basis functions in Fig. 8 also show that the linguistic content of the survey responses favors basis functions that peak around 1-2, which is intuitively pleasing.
[image:5.612.314.560.161.355.2]Survey Range
0 2 4 6 8 10
Membership
0 0.5 1
(a) 5 basis functions
Survey Range
0 2 4 6 8 10
Membership
0 0.5 1
(b) 7 basis functions
Survey Range
0 2 4 6 8 10
Membership
0 0.5 1
[image:6.612.51.299.48.207.2](c) 15 basis functions
Fig. 8: Contribution of eIAA basis functions for ’little’ survey responses. The sum of these basis functions produces the eIAA membership functions shown in Fig. 7(b).
Survey Range
0 2 4 6 8 10
Membership
0 0.5 1
(a) IAA set of ‘large’
Survey Range
0 2 4 6 8 10
Membership
0 0.5
1 IAA union
eIAA-7 union
(b) ‘little’∪‘large’
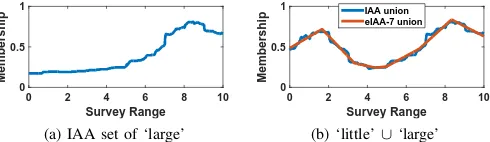
Fig. 9: Example of using IAA and eIAA-7 representations to compute union of ‘little’ and ‘large’ survey responses.
word ’large.’ As expected, the high membership area for the IAA ’large’ FS is around 8-9 on the survey scale. View (b) of Fig. 9 shows the result of the union of ‘little’ and ‘large’ computed using the IAA FSs (blue line) and the eIAA FSs (red line) using 7 basis functions. Unsurprisingly, the union of the eIAA FSs is an excellent approximation of the union of the IAA FSs.
VI. CONCLUSION
The IAA method provides aggregation and analysis for crisp and uncertain interval survey responses. A challenge with IAA is that the resulting FSs are defined by a large number of membership-domain pairs—equal to the number of input survey responses. This can not only result in storage issues for huge survey pools, but also present challenges when operating on the resulting FSs produced by IAA. The proposed eIAA algorithm can significantly reduce the necessary storage of the FSs and computational complexity of FS operations. Furthermore, eIAA provides a way to approximate the survey responses with linguistic prototypes, i.e., linguistic basis func-tions, giving meaning to the IAA and survey analysis results. We demonstrated this on a real survey where respondents were asked to quantify the interval that describes the word ‘little.’
As was seen in the demonstration of using IAA and eIAA with the words survey data, there were many survey respon-dents that selected intervals for these words that would be outside the typical definition of the word, i.e., most reasonable respondents would not choose a value of 10 for the word, ‘little.’ Some respondents also chose very wide intervals,
with a few respondents choosing the interval 0-10 for their response. The IA and EIA approaches attack this problem with a statistical preprocessing and aggregation scheme. In the future, for cases where outlier removal is appropriate, we will examine using`1 regularization with (9) and (10), which
will prefer sparse solutions for the basis function weights— essentially, choosing the linguistic bases that best fit the responses and disregarding all others. We will also investigate how regularization can automate the trade-off between the number of basis functions and the accuracy of eIAA.
Lastly, we will investigate efficient methods for handling inter-expert or inter-source uncertainty in surveys, which in [8] were shown to be best represented by zSlice GT2 FSs. This can be accomplished by using the eIAA idea on each slice of the zSlice GT2 FS.
ACKNOWLEDGEMENTS
Superior, a high performance computing cluster at Michi-gan Technological University, was used in obtaining results presented in this publication.
REFERENCES
[1] S. Coupland, J. Mendel, and D. Wu, “Enhanced interval approach for encoding words into interval type-2 fuzzy sets and convergence of the word FOUs,” inProc. IEEE Int. Conf. Fuzzy Systems. IEEE, 2010, pp. 1–8.
[2] D. Wu, J. Mendel, and S. Coupland, “Enhanced interval approach for encoding words into interval type-2 fuzzy sets and its convergence analysis,”IEEE Trans. Fuzzy Systems, vol. 20, no. 3, pp. 499–513, 2012. [3] S. Miller, C. Wagner, and J. Garibaldi, “Constructing general type-2 fuzzy sets from interval-valued data,” inProc. IEEE Int. Conf. Fuzzy Systems, 2012.
[4] C. Wagner, S. Miller, and J. Garibaldi, “Similarity based applications for data-driven concept and word models based on type-2 and type-2 fuzzy sets,” inProc. IEEE Int. Conf. Fuzzy Systems, 2013, pp. 1–8. [5] F. Liu and J. Mendel, “Encoding words into interval type-2 fuzzy sets
using an interval approach,”IEEE Trans. Fuzzy Systems, vol. 16, no. 6, pp. 1503–1521, 2008.
[6] F. Herrera, S. Alonso, F. Chiclana, and E. Herrera-Viedma, “Computing with word in decision making: foundations, trends, and prospects,”Fuzzy Optimization and Decision Making, vol. 8, pp. 337–364, 2009. [7] F. Liu and J. Mendel, “An interval approach to fuzzistics for interval
type-2 fuzzy sets,” inProc. IEEE Int. Conf. Fuzzy Systems, 2007, pp. 1–6.
[8] C. Wagner, S. Miller, J. Garibaldi, D. Anderson, and T. Havens, “From interval-valued data to general type-2 fuzzy sets,”IEEE Trans. Fuzzy Systems, vol. 23, no. 2, pp. 248–269, 2014.
[9] J. Mendel and R. John, “Type-2 fuzzy sets made simple,”IEEE Trans. Fuzzy Systems, vol. 10, no. 2, pp. 117–127, 2002.
[10] C. Wagner and H. Hagras, “Toward general type-2 fuzzy logic systems based on zslices,”IEEE Trans. Fuzzy Systems, vol. 18, no. 4, pp. 637– 660, 2010.
[11] L. Zadeh, “The concept of a linguistic variable and its application to approximate reasoning-i* 1,” Information Sciences, vol. 8, no. 3, pp. 199–249, 1975.
[12] S. Coupland and R. John, “Geometric type-1 and type-2 fuzzy logic systems,”IEEE Trans. Fuzzy Systems, vol. 15, no. 1, pp. 3–15, 2007. [13] J. Mendel, F. Liu, and D. Zhai, “α-plane representation for type-2 fuzzy
sets: theory and applications,”IEEE Trans. Fuzzy Systems, vol. 17, no. 5, pp. 1187–1207, 2009.
[14] F. Liu, “An efficient centroid reduction strategy for general type-2 fuzzy logic system,”Information Sciences, vol. 178, pp. 2224–2236, 2008.
[15] J. Mendel, R. John, and F. Liu, “Interval type-2 fuzzy logic systems made simple,”IEEE Trans. Fuzzy Systems, vol. 14, no. 6, pp. 808–821, 2006.
[image:6.612.52.297.258.329.2]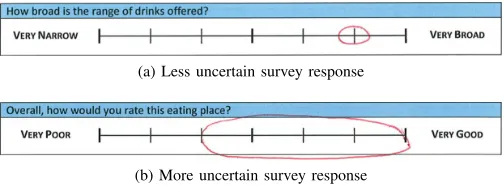

![Fig. 5: Example of an LBS on the survey range [0linguistic interpretation of the basis functions could be ‘verylow,’ ‘low,’ ‘medium,’ ‘high,’ and ‘very high,’ from left to, 10]—theright.](https://thumb-us.123doks.com/thumbv2/123dok_us/8570656.368404/4.612.379.495.115.175/example-survey-linguistic-interpretation-functions-verylow-medium-theright.webp)