Abstract—This paper presents the implementation of a generalized photovoltaic model using Matlab/Simulink software package, which can be representative of PV cell, module, and array for easy use on simulation platform. The proposed model is designed with a user-friendly icon and a dialog box like Simulink block libraries. This makes the generalized PV model easily simulated and analyzed in conjunction with power electronics for a maximum power point tracker. Taking the effect of sunlight irradiance and cell temperature into consideration, the output current and power characteristics of PV model are simulated and optimized using the proposed model. This enables the dynamics of PV power system to be easily simulated, analyzed, and optimized.
Index Terms—Generalized model, photovoltaic module, Matlab/Simulink.
I. INTRODUCTION
With increasing concerns about fossil fuel deficit, skyrocketing oil prices, global warming, and damage to environment and ecosystem, the promising incentives to develop alternative energy resources with high efficiency and low emission are of great importance. Among the renewable energy resources, the energy through the photovoltaic (PV) effect can be considered the most essential and prerequisite sustainable resource because of the ubiquity, abundance, and sustainability of solar radiant energy. Regardless of the intermittency of sunlight, solar energy is widely available and completely free of cost. Recently, photovoltaic array system is likely recognized and widely utilized to the forefront in electric power applications. It can generate direct current electricity without environmental impact and contamination when is exposed to solar radiation. Being a semiconductor device, the PV system is static, quite, and free of moving parts, and these make it have little operation and maintenance costs. Even though the PV system is posed to its high capital fabrication cost and low conversion efficiency, the skyrocketing oil prices make solar energy naturally viable energy supply with potentially long-term benefits.
PV module represents the fundamental power conversion unit of a PV generator system. The output characteristics of PV module depends on the solar insolation, the cell
Manuscript received July 24, 2008. This work was supported by the National Science Council of the Republic of China under Grant NSC97-2815-C-212-006-E.
H. L Tsai is with the Electrical Engineering Department, Da-Yeh University, Chang-Hua, 51505, Taiwan, R.O.C. (phone: 886-4-8511888 ext2204; fax: 886-4-8511245; e-mail: [email protected]).
Ci-Siang Tu and Yi-Jie Su are with the Graduate School of Electrical Engineering, Da-Yeh University, Chang-Hua, 51505,Taiwan, R.O.C.
temperature and output voltage of PV module. Since PV module has nonlinear characteristics, it is necessary to model it for the design and simulation of maximum power point tracking (MPPT) for PV system applications. The mathematical PV models used in computer simulation have been built for over the pass four decades [1]-[3]. Almost all well-developed PV models describe the output characteristics mainly affected by the solar insolation, cell temperature, and load voltage. However, the equivalent circuit models are implemented on simulation platforms of power electronics, such as SPICE. Recently, a number of powerful component-based electronics simulation software package have become popular in the design and development of power electronics applications. However, the SimPowerSystem tool in Matlab/Simulink package offers wind turbine models but no PV model to integrate with current electronics simulation technology. Thus, it is difficult to simulate and analyze in the generic modeling of PV power system. This motivates me to develop a generalized model for PV cell, module, and array using Matlab/Simulink.
The main contribution of this paper is the implementation of a generalized PV model in the form of masked block, which has a user-friendly icon and dialog in the same way of Matlab/Simulink block libraries or other component-based electronics simulation software packages, such as Caspoc. The remainder of this paper is organized as follows. For easy presentation, the traditional PV models are addressed in Section II. And the nonlinearity of PV current versus voltage (I-V) and power versus voltage (P-V) characteristics are shown as well. Section III demonstrates the implementation and simulation results for the proposed model using Matlab/Simulink software package. A different MPPT strategy is found and some interested issues are also discussed. Finally, brief conclusions are drawn in Section IV.
II. PHOTOVOLTAIC MODELS
Solar cell is basically a p-n junction fabricated in a thin wafer or layer of semiconductor. The electromagnetic radiation of solar energy can be directly converted electricity through photovoltaic effect. Being exposed to the sunlight, photons with energy greater then the band-gap energy of the semiconductor are absorbed and create some electron-hole pairs proportional to the incident irradiation. Under the influence of the internal electric fields of the p-n junction, these carriers are swept apart and create a photocurrent which is directly proportional to solar insolation. PV system naturally exhibits a nonlinear I-V and P-V characteristics which vary with the radiant intensity and cell temperature.
Development of Generalized Photovoltaic
Model Using MATLAB/SIMULINK
A. Solar Cell Model
A general mathematical description of I-V output characteristics for a PV cell has been studied for over the pass four decades [1]-[3]. Such an equivalent circuit-based model is mainly used for the MPPT technologies. The equivalent circuit of the general model which consists of a photo current, a diode, a parallel resistor expressing a leakage current, and a series resistor describing an internal resistance to the current flow, is shown in Fig. 1(a). The voltage-current characteristic equation of a solar cell is given as
(
)
[
S C]
S SH SPH I expq(V IR )/kT A 1 (V IR )/R
I
I= − + − − +
(1) where IPH is a light-generated current or photocurrent, IS
is the cell saturation of dark current, q (=1.6×10⁻¹⁹C)is an electron charge, k (=1.38×10⁻²³J/K) is a Boltzmann’s constant, TC is the cell’s working temperature, A is an ideal
factor, RSH is a shunt resistance, and RS is a series
resistance. The photocurrent mainly depends on the solar insolation and cell’s working temperature, which is described as
λ
)] (
[ SC C Ref
PH I K T T
I = + I − (2)
where ISC is the cell’s short-circuit current at a 25°C and
1kW/m2,
I
K is the cell’s short-circuit current temperature
coefficient, TRef is the cell’s reference temperature, and λ
is the solar insolation in kW/m2. On the other hand, the cell’s
saturation current varies with the cell temperature, which is described as
(
T T)
[
qE(
T T)
kA]
I
IS= RS C/ Ref 3exp G1/ Ref −1/ C / (3)
where IRS is the cell’s reverse saturation current at a
reference temperature and a solar radiation, EG is the
bang-gap energy of the semiconductor used in the cell. The ideal factor A is dependent on PV technology [4] and is listed in Table I.
An even more exact mathematical description of a solar cell, which is called the double exponential model as shown in Fig. 1(b) [5], is derived from the physical behavior of solar cell constructed from polycrystalline silicon. This model is composed of a light-generated current source, two diodes, a series resistance and a parallel resistance. However, there are some limitations to develop expressions for the V-I curve parameters subject to the implicit and nonlinear nature of the model. Therefore, this model is rarely used in the subsequent literatures and is not taken into consideration for the generalized PV model.
The shunt resistance RSH is inversely related with shunt
leakage current to the ground. In general, the PV efficiency is insensitive to variation in RSH and the shunt-leakage
resistance can be assumed to approach infinity without leakage current to ground. On the other hand, a small variation in RS will significantly affect the PV output power. The appropriate model of PV solar cell with suitable complexity is shown in Fig. 1(c) [4]. Equation (1) can be rewritten to be
(
)
[
exp ( S)/ 1]
S
PH − + −
=I I qV IR kT A
I C (4)
For an ideal PV cell, there is no series loss and no leakage
to ground, i.e., RS=0 and RSH =∞. The above equivalent
circuit of PV solar cell can be simplified as shown in Fig. 1(d) [1],[ 6]-[7]. The (1) can be rewritten to be
(
)
[
exp / 1]
S
PH − −
=I I qV kT A
I C (5)
B. Solar Module and Array Model
Since a typical PV cell produces less than 2W at 0.5V approximately, the cells must be connected in series-parallel configuration on a module to produce enough high power. A PV array is a group of several PV modules which are electrically connected in series and parallel circuits to generate the required current and voltage. The equivalent circuit for the solar module arranged in NP parallel and NS
series is shown in Fig. 2(a). The terminal equation for the current and voltage of the array becomes as follows [8]-[11].
(
)
[
exp ( / S S/ P)/ C 1]
S P PH
P − + −
=N I N I qV N IR N kT A
I
SH S S
P / )/
(
− N V N +IR R (6)
In fact, the PV efficiency is sensitive to small change in S
R but insensitive to variation in RSH. For a PV module or
array, the series resistance becomes apparently important and the shunt down resistance approaches infinity which is assumed to be open. In most commercial PV products, PV cells are generally connected in series configuration to form a PV module in order to obtain adequate working voltage. PV modules are then arranged in series-parallel structure to achieve desired power output. An appropriate equivalent circuit for all PV cell, module, and array is generalized and expressed in Fig. 2(b). It can be shown that NS=NP =1 for a PV cell, NP=1 and NS: series number of cells for a PV
module, and NS and NP: series-parallel number for a PV
array. The mathematical equation of generalized model can be described as
(
)
[
exp ( / S S/ P)/ C 1]
S P PH
P − + −
=N I N I qV N IR N kT A
I (7)
The most simplified model [6], [12] of generalized PV module is depicted in Fig. 2(c). The equivalent circuit is described on the following equation
(
)
[
exp / S C 1]
S P PH
P − −
=N I N I qVN kT A
I (8)
C. Determination of Model Parameters
All of the model parameters can be determined by examining the manufacturer’s specifications of PV products. The most important parameters widely used for describing the cell electrical performance is the open-circuit voltage
OC
V and the short-circuit current ISC. The aforementioned
equations are implicit and nonlinear; therefore, it is difficult to arrive at an analytical solution for a set of model parameters at a specific temperature and irradiance. Since normally IPH >>IS and ignoring the small diode and
ground-leakage currents under zero-terminal voltage, the short-circuit current ISC is approximately equal to the
photocurrent IPH, i.e.,
SC PH I
I = (9)
On the other hand, the VOC parameter is obtained by
assuming the output current is zero. Given the PV open-circuit voltage VOC at reference temperature and
current at reference temperature can be approximately obtained as
(
)
[
exp / 1]
/ OC S C
SC
RS=I qV N kAT −
I (10)
In addition, the maximum power can be expressed as SC
OC max max
max V I V I
P = =γ (11)
where Vmax and Imax are terminal voltage and output
current of PV module at maximum power point (MPP), and
γ is the cell fill factor which is a measure of cell quality.
III. GENERALIZED PVMODEL BUILDING AND SIMULATION
A. Building of Generalized PV Model
A model of PV module with moderate complexity which includes the temperature independence of the photocurrent source, the saturation current of the diode, and a series resistance is considered based on the Shockley diode equation. It is important to build a generalized model suitable for all of the PV cell, module, and array, which is used to design and analyze a maximum power point tracker. Bing illuminated with radiation of sunlight, PV cell converts part of the photovoltaic potential directly into electricity with both I-V and P-V output characteristics. A generalized PV model is built using Matlab/Simulink [13] to illustrate and verify the nonlinear I-V and P-V output characteristics of PV module. The proposed model is implemented and shown in Figs. 3(a) and 3(b). In order to make the generalized model easier to use and understand, we used an image file of PV icon as a masking icon. The user-friendly icon is shown in Fig. 4(a). In addition, the masked model is designed to have a dialog box as shown in Fig. 4(b), in which the parameters of PV module can be configured in the same way for the Simulink block libraries.
B. Simulation Results of PV Cell and Module
For a PV cell with an ideal I-V characteristic, its open- circuit voltage and short-circuit current are given as
V 596 . 0 OC=
V and ISC=2.0A, respectively. In addition,
1 P S=N =
N for a PV cell. Both I-V and P-V output
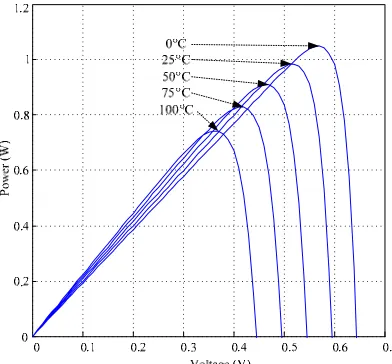
characteristics of generalized PV model for a cell are shown in Figs. 5-6. The nonlinear nature of PV cell is apparent as shown in the figures, i.e., the output current and power of PV cell depend on the cell’s terminal operating voltage and temperature, and solar insolation as well. We find from Figs. 5(a) and 5(b) that with increase of working temperature, the short-circuit current of the PV cell increases, whereas the maximum power output decreases. Inasmuch as the increase in the output current is much less than the decrease in the voltage, the net power decreases at high temperatures. On the other hand, we observe from Figs. 6(a) and 6(b) that with increase of solar insolation, the short-circuit current of the PV module increases, and the maximum power output increases as well. The reason is the open-circuit voltage is logarithmically dependent on the solar irradiance, yet the short-circuit current is directly proportional to the radiant intensity.
By the same token, the Solarex MSX 60 PV module is taken for example. The key specifications are listed in Table II in which the nominal operating cell temperature (NOCT) is the temperature that the cells will reach when they are
operated at open circuit in an ambient temperature of 20°C under AM 1.5 irradiance conditions with λ=0.8kW/m2 and a
wind speed less than 1 m/s. The electrical characteristics of PV module are generally represented by the current versus voltage and power versus voltage curves. Both I-V and P-V output characteristics of PV module at various insolation and temperatures are carried out and the results are shown in Figs. 7-8. We also see from Figs. 7(a) and 7(b) that with increase of working temperature, the short-circuit current of the PV module increases, whereas the maximum power output decreases. The increase in the short-circuit current is much less than the decrease in the open-circuit voltage, and the effect makes maximum power decreasing by about 0.45%/°C at high temperatures. On the other hand, from, we also observe that with increase of solar insolation, the short-circuit current and the maximum power output of the PV module increase as shown in Figs. 8(a) and 8(b). The reason is the open-circuit voltage is logarithmically dependent on the solar irradiance, yet the short-circuit current is directly proportional to the radiant intensity.
C. Statistical Simulation
For easy simulation, the solar radiation intensity for a sample day is assumed to be a function of Gaussian function which is defined as
[
2 2]
maxexp ( ) /2 )
( λ σ
λ t = − t−tC (12)
where λmax is the maximal radiation intensity at a given time, C
t is the center time, and σ is the standard deviation of
Gaussian function. Fig. 9 shows a plot of the Gaussian function for the solar radiation intensity for a sample day with the conditions: λmax =1kW/m2, tC=12, and σ =0.5. The peak of sunlight intensity occurs at noon. The cell temperature for a sample day is assumed to be at a fixed temperature of NOCT by ignoring the effect of the solar irradiation. Given sunlight irradiance for a sample day, the output current is governed by its output voltage which is determined by the ensuing load. Without taking cell temperature variations into consideration, the maximum power is determined by both radiation intensity and output voltage. For different output voltage, the output current and power are shown in Figs. 10(a) and (b) for a sample day. For easy comparisons, the root mean square (R.M.S.) values of output power for various output voltage for a sample day are calculated an depicted in Fig. 11. The maximum R.M.S. power during the course of a sample day occurs with the output voltage in the range of 15-16V.
IV. CONCLUSIONS
easily configure the PV model. Such a generalized PV model is easy to be used for the implementation on Matlab/Simulink modeling and simulation platform. Especially, in the context of the SimPowerSystem tool, there is now a generalized PV model which can be used for the model and analysis in the filed of solar PV power conversion system.
REFERENCES
[1] S. W. Angrist, , Direct Energy Conversion, Allyn and Bacon, Inc., 4th
edition, 1982, pp. 177-227.
[2] O. Wasynczuk, “Dynamic behavior of a class of photovoltaic power
systems,” IEEE Transactions on Power Apparatus and Systems, vol.
PAS-102, no. 9, 1983, pp. 3031-3037.
[3] J. C. H. Phang, D. S. H. Chan, and J. R. Philips, “Accurate analytical
method for the extraction of solar cell model parameters,” Electronics
Letters, vol. 20, no. 10, 1984, pp.406-408.
[4] C. C. Hua and C. M. Shen, “Study of maximum power tracking
techniques and control of dc-dc converters for photovoltaic power
system,” Proceedings of 29th annual IEEE Power Electronics
Specialists Conference, vol. 1, 1998, pp. 86-93.
[5] J. A. Gow and C. D. Manning, “Development of a photovoltaic array
model for use in power-electronics simulation studies,” IEE
Proceedings- Electric Power Applications, vol. 146, no. 2, 1999, pp. 193-199.
[6] O. Wasynczuk, “Modeling and dynamic performance of a line-
commutated photovoltaic inverter system,” IEEE Transactions on
Energy Conversion, vol. 4, no. 3, 1989, pp. 337-343.
[7] R. Messenger and J. Ventre, Photovoltaic Systems Engineering, CRC
Press, 2000, pp.41-51.
[8] M. Veerachary, T. Senjyu, and K. Uezato, “Voltage-based maximum
power point tracking control of PV system,” IEEE Transactions on
Aerospace and Electronic Systems, vol. 38, no. 1, 2002, pp. 262-270.
[9] M. Veerachary and K.S. Shinoy, “V2-based power tracking for
nonlinear PV sources,” IEE Proceedings-Electric Power Applications,
vol. 152, no. 5, 2005, pp. 1263-1270.
[10] I. S. Kim and M. J. Youn, “Variable-structure observer for solar array
current estimation in a photovoltaic power-generation system,” IEE
Proceedings-Electric Power Applications, vol. 152, no. 4, 2005, pp.
953-959.
[11] I. S. Kim, M. B. Kim, and M. J. Youn, “New maximum power point
tracker using sliding-mode observer for estimation of solar array
current in the grid-connected photovoltaic system,” IEEE Transaction
on Industrial Electronics, vol. 53, no. 4, 2006, pp. 1027-1035.
[12] K. H. Hussein, I. Muta, T. Hoshino, and M. Osakada, “Maximum
photovoltaic power tracking: an algorithm for rapidly changing
atmospheric conditions,” IEE Proceedings of Generation,
Transmission and Distribution, vol. 142, no. 1, 2005, pp. 953-959.
[13] J. B. Dabney and T. L. Harman, Mastering Simulink®, Pearson
Education,Inc., 2004.
(a) General model (b)Double exponential model
[image:4.595.353.502.51.370.2](c) Appropriate model (d) Simplified model
Fig. 1 Equivalent circuit models of PV cell.
SH P SR N N S P SR N N 4 4 4 8 4 4 4 7 6 4 4 4 48 4 4 4 47 6 S N P N
(a) General model
S P SR N N 4 4 4 8 4 4 4 7 6 4 4 4 48 4 4 4 47 6 S N P N
(b) Generalized model
4 4 4 8 4 4 4 7 6 4 4 4 48 4 4 4 47 6 S N P N
[image:4.595.308.552.393.643.2](c) Appropriate model
Fig. 2 Equivalent circuit models of generalized PV.
V Voltage Insolation Solar irradiance Scope1 Scope Coltage Input Insolation Input
Cell Temperature Input Power Output
Current Output
Generalized PV Module Tc
Cell Temperature
TC
Fig. 3(a) Generalized PV model.
2 Current Output 1 Power Output Ki Short-Circuit Current Temperature Coefficient Isc Short-Circuit Current f(u) Saturation Current f(u) Reverse Saturation Current Tref Reference Temperature Product Power f(u) Current Output 3 Cell Temperature Input 2 Insolation Input 1 Coltage Input Irs Iph Is I
Fig. 3(b) Subsystem implementation of generalized PV model.
V Voltage Insolation Solar irradiance Scope1 Scope
Generalized PV Module Tc
Cell Temperature TC
[image:4.595.56.287.574.713.2] [image:4.595.333.527.670.763.2]Fig. 4(b) Dialog box of generalized PV model.
Fig. 5(a) I-V output characteristics with different Tc.
Fig. 5(b) P-V output characteristics with different Tc.
Fig. 6(a) I-V output characteristics with different λ.
Fig. 6(b) P-V output characteristics with different λ.
Fig. 7(a) I-V output characteristics with different Tc.
[image:5.595.327.509.42.655.2] [image:5.595.68.289.46.517.2] [image:5.595.328.507.47.222.2] [image:5.595.72.268.533.715.2]Fig. 8(a) I-V output characteristics with different λ.
[image:6.595.340.513.51.214.2]Fig. 8(b) P-V output characteristics with different λ.
Fig. 9 Solar radiation intensity for a sample day in the form of Gaussian function.
18 :
17 :
16 :
15 :
14 :
= = = = =
V V V V V
Fig. 10(a) Current characteristics during a sample day for different voltage.
18 :
17 :
16 :
15 :
14 :
= = = = =
V V V V V
[image:6.595.74.248.52.213.2]Fig. 10(b) Power characteristics during a sample day for different voltage.
[image:6.595.332.518.235.407.2]Fig. 11 R.M.S. values of output power for various output voltage.
[image:6.595.349.503.444.552.2]Table I Factor A dependence on PV technology
Table II Solarex MSX 60 Specifications (1kW/m2, 25°C)
Characteristics SPEC.
Typical peak power (Pp) 60W
Voltage at peak power (Vpp) 17.1V
Current at peak power (Ipp) 3.5A
Short-circuit current (ISC) 3.8A
Open-circuit voltage (VOC) 21.1V
Temperature coefficient of open-circuit voltage -73mV/ C
Temperature coefficient of short-circuit current (KI) 3mA/ C
Approximate effect of temperature on power -0.38W/ C
[image:6.595.328.526.571.689.2] [image:6.595.82.256.614.773.2]