Abstract—This objective of this research is to investigate the impact of Cash-to-Cash cycle time (C2C), inventory conversion period (INV), receivable conversion period (AR), and payable deferral period (AP) of listed private hospitals in the Stock Exchange of Thailand (SET) on their corporate profitability, by using both regular and panel data analysis. The outcome would be compared with the expectations from supply chain management theory. The data are obtained from the financial reports of the listed private hospitals in SET across 13 private hospital populations, from 2002 to 2008. The hypothesis testing is applied to determine the association between the dependent variable (asset turnover, AT) and independent variables (INV, AR, AP, and C2C). In addition, the control variables are company size, sales growth, financial debt level, and annual gross domestic product growth. The results from regular regression, unexpectedly show that only the independent variable AP is negatively related to AT under the control variables. The rest of the independent variables statically reveal no relationship with AT at significance level 0.10. On the other hand, the results from panel data regression show that both AR and AP are negatively related with AT at significance level 0.10. Comparatively, the results from panel data regression analysis are better because it can provide better significance levels and more similar outcomes with the theory. The results also suggest that the listed firms in SET can increase corporate profitability by decreasing AR and AP. Reference [1] provided similar results by using the regression analysis.
Index Terms—Cash-to-cash cycle management, profitability, regular regression, panel regression.
I. INTRODUCTION
The objective of this study is to determine the effect of Cash-to-Cash cycle time (C2C) on corporate profitability from private hospitals in Thailand which are listed under the Stock Exchange of Thailand. The data is collected over 8 years from year 2002 to 2008. Both regular regression analysis and panel data regression analysis are performed. Another goal is to investigate which regression type could provide a more reasonable outcome when judged on the expectations of the theory.
Manuscript received on July 26, 2010. This work was supported by Thailand Research Fund (TRF), National Research Council of Thailand (NRCT), Commission on Higher Education of Thailand, Faculty of Engineering, Thammasat University and Thammasat University, Thailand.
Wuthichai Wongthatsanekorn is the lecturer, Industrial Engineering Department, Faculty of Engineering, Thammasat University, Rangsit campus, Klongluang, Pathum-thani, 12120, Thailand (corresponding author; e-mail: [email protected])
The organization of this paper is as follows. Section II describes the problem motivation. The conceptual framework of profitability and C2C is given in Section III. In section IV, the details of regular and panel data regressions are explained. In Section V the results of the regression are discussed. Finally, the conclusions are drawn in Section VI.
II. PROBLEM MOTIVATION
The motivation of this research comes from the current situation of drug distributor in Thailand. Drug distributors in Thailand face the problem of delay in payment collection from their hospital customers. Consequently, they lose the flexibility of quick decision-making for the next appropriate replenishment order. Based on the studied company’s experiences, each of the customer hospitals has different policies of purchasing plans and payment periods. The company had hypothesized that some hospital followed a traditional policy while the others followed an aggressive policy [2]. The major difference in characteristics between those two policies is the level of drug stockpile and the payment period. If the hospital has a good long-term relationship with the company, a long payment period is usually granted coupled with a good volume discount offering. Furthermore, the company’s observation also indicates that some private hospital customers favor the purchase of a lower amount and interest in long payment period.
It can be seen that the hospital and the drug distributor has a conflict over deferral payment period which is used to calculate C2C. The hospitals prefer long deferral payment period while the drug distributor wants to shorten deferral payment period. Therefore, the insight from this research would help the studied company gain the better perspectives of how the hospital profitability are related to each term in C2C and C2C itself.
C2C is one of the performance attribute metrics, which can measure the quality of assets management of one firm and the collaboration level among firms. It means the number of days for the company to convert resource inputs into cash flows. It can be used for accounting purposes in the determination of firm liquidity and organizational valuation. A shorter C2C, implying that fewer days cash are tied up in working capital and not offset by "free" financing in the form of deferred payments, results in more liquidity for the firm [3]. Also, a shorter conversion cycle results in a higher present value of net cash flows generated by the assets; and therefore, a higher
Study of Cash-to-Cash Cycle Management on
Profitability of Private Hospital in Thailand by
Regular and Panel Data Regression Analyses
firm value. For Supply Chain Management (SCM) activities, this metric serves as a universal measurement bridging the processes into and out of the firm, using common accounting measurements. Measuring C2C can offer useful and readily available data apart from those common benchmarking data.
According to [4] the C2C can be computed by (1): C2C=
Inventory conversion + period
Receivables collection + period
Payables deferral (1) period Corporate profitability can be measured in different ways, such as net income to sales, gross margin percentage, rate of return on stockholders’ equity, rate of return on assets, and assets turnover. In this study, the assets turnover (AT) is taken as the profitability measures because of its comprehensiveness. Assets turnover (AT) is a measure of a company’s profitability. It indicates how efficiently a company uses its assets to produce sales. A company can increase assets turnover by (1) either generating more sales from every Baht invested in assets, or (2) producing one Baht of sales from less than one Baht investment in assets. The first depends on the condition of the market in which the company operates and its competitive position; the latter depends on operating managers’ effectiveness in controlling assets such as account receivables, inventories, and property, plant and equipments [5].
Many researchers attempt to find the relationship between C2C and profitability. Reference [3] found that there is a negative relationship between a firm’s net trade cycle and its profitability based on 20 industries in US during 1970-1989. Reference [6] stated that a strong negative relation existed among the firm’s net trade cycle, profitability and stock returns (based on 58,985 firms in US during 1975-1994). Reference [1] also found that there is a significant negative relation between gross operating income and the number of day accounts receivable, inventories and account payable (based on over 1,000 Belgian firms during 1991-1996). At last, Reference [2] show the results that managers can create value by reducing their inventories and the number of days for which their accounts are outstanding. Moreover, shortening the cash conversion cycle also improves the firm’s profitability.
Coupled with the basic principle of SCM, the theoretical expectations of the relationship between C2C and profitability is that AT is negatively related with Cash-to-Cash cycle time, inventory conversion period and receivable conversion period but positively related with payables deferral period.
III. CONCEPTUAL FRAMEWORK
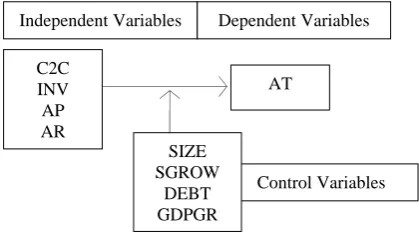
The conceptual framework of this research presents independent variables: the Cash-to-Cash cycle time (C2C), inventory conversion period (INV), receivable conversion period (AR), and payable deferral period (AP). The dependent variable is assets turnover (AT). The company size (SIZE), sales growth (SGROW), financial debt level (DEBT), and annual GDP growth are used as control variables in order to test the relation between each independent variable and the dependent variable.
This study examines the association of the C2C and its
[image:2.595.321.531.158.280.2]components to corporate profitability reflected by assets turnover. Therefore, the focus is on the effect of C2C on assets turnover with respect to time interval and across the hospitals. The result will show which variable has the most effect in C2C components (INV, AR, and AP) with respect to time interval for each particular hospital in order to observe the operating cycle. The conceptual framework is shown in Fig 1.
Fig.1 Conceptual Framework
Based on the conceptual framework, the hypotheses of the study are as follows;
H01: Cash-to-Cash cycle time has no relationship with Assets
Turnover.
Ha1: Cash-to-Cash cycle time has a relationship with Assets
Turnover.
H02: Inventory conversion period has no relationship with Assets
Turnover.
Ha2: Inventory conversion period has a relationship with Assets
Turnover.
H03: Receivable conversion period has no relationship with Assets
Turnover.
Ha3: Receivable conversion period has a relationship with Assets
Turnover.
H04: Payables deferral period has no relationship with Assets
Turnover.
Ha4: Payables deferral period has a relationship with Assets
Turnover.
Next, the operational definitions of all types of variables are defined.
Operational Definition of Independent Variable
The Cash-to-Cash cycle (C2C) or cash conversion, nets out the three periods and thus equals the length of time between the firm’s actual cash expenditures for productive resources and its own cash receipts from the sale of products. The Cash-to-Cash cycle equals the average length of time Baht is tied up in current assets. It is calculated as shown in (1).
Inventory convention period (INV), which is the average length of time required to convert materials into finished goods and then to sell those goods is calculated by dividing the inventory on hand by the sales per day. It is calculated as follows:
INV = Inventories x 365 (2)
Cost of sales
Receivable conversion period (AR), which is the average length of time required to convert receivables into cash
C2C INV AP AR
Independent Variables
AT
Dependent Variables
Control Variables SIZE
following a sale. It is calculated by dividing accounts receivable by the average sales per day. It is calculated as follows:
AR = Account receivables x 365 (3) Sales
Payables deferral period (AP) is the average length of time between the purchases of materials and labor and the payment of cash for them. It is calculated as follows:
AP = Account payables x 365 (4)
Cost of Sales Operational Definition of Dependent Variable
Assets turnover (AT) is a measure of a company’s profitability. It indicates how efficiently a company uses its assets to produce sales. It is calculated as follows [5]:
AT = Net sales (5)
Average total assets Operational Definition of Control Variable
Company size (SIZE) is measured as the logarithm of total assets. It is calculated as follows [2]:
Company size (SIZE) = logtotal asset (6)
Sales growth (SGROW) is measured as the ratio of growing sales over base sales. It is calculated as follows [2]:
SGROW = Salest – Salest-1 (7)
Salest-1
Financial debt level (DEBT) is measured as the leverage of the ratio of debt to liabilities over total assets. It is calculated as follows [2]:
DEBT = = Total debt (8)
Total assets
Annual GDP growth (GDPGR) is measured as the ratio of growing annual GDP over base annual GDP. It is calculated as follows [2]:
GDPGR = Annual GDPt – Annual GDPt-1 (9) Annual GDPt-1
IV. REGRESSION ANALYSIS METHODOLOGY
The effects of Cash-to-Cash cycle management on private hospital profitability are tested using the regular regression, in which the influence from different hospitals is not considered, and panel data regression. Then, the estimated coefficients of each variable in the equations from two types of regression are investigated. The estimates from two types of regression are specifically obtained in the following equations.
Regular regression:
AT = β0 + β1C2C + β2SIZE + β3SGROW + β4DEBT +
β5GDPGR + εit
AT = β0 + β1INV + β2SIZE + β3SGROW + β4DEBT +
β5GDPGR + εit
AT = β0 + β1AR + β2SIZE + β3SGROW + β4DEBT +
β5GDPGR + εit
AT = β0 + β1AP + β2SIZE + β3SGROW + β4DEBT +
β5GDPGR + εit
(10) (11) (12) (13)
Panel Data regression:
ATit = β0 + β1C2Cit + β2SIZEit + β3SGROWit +
β4DEBTit + β5GDPGRit + ηi + λt + εit
(14)
ATit = β0 + β1INVit + β2SIZEit + β3SGROWit +
β4DEBTit + β5GDPGRit + ηi + λt + εit
ATit = β0 + β1ARit + β2SIZEit + β3SGROWit + β4DEBTit
+ β5GDPGRit + ηi + λt + εit
ATit = β0 + β1APit + β2SIZEit + β3SGROWit + β4DEBTit
+ β5GDPGRit + ηi + λt + εit
(15) (16) (17)
where AT measures the assets turnover, C2C is the Cash-to-Cash cycle, INV is the number of days inventories, AR is the number of days accounts receivable, AP is the number of days accounts payable, SIZE is the company size, SGROW is the sales growth, DEBT is the debt level, and GDPGR is the annual GDP growth. Furthermore, ηi is set to
measure the particular characteristics of each firm and λt
represent time dummy variables that change over time but are the same for all the firms in each of the periods considered. The index i represents each hospital from 1,…,n, and index t represents time period.
The panel data analysis procedure analyzes a class of linear econometric models when time-series and cross-sectional data are combined. This type of pooled data on time-series cross-sectional bases is referred as panel data. The panel data models can be grouped into several categories depending on the structure of the error term which are 1) One-way and two-way models and 2) Fixed-effects and random-effects models. If the specification is dependent only on the cross section to which the observation belongs, such a model is referred as a one-way model. A specification that depends on both the cross section and the time period is called a two-way model. In this research, the focus is on the two-way model. The other dimension of difference between the possible specifications is the nature of the cross-sectional or time-series effect. The models are referred to as fixed-effects models if the effects are nonrandom and as random-effects [7]. These models can be described as:
Fixed effect Two-way model in Panel data regression
Yit = (β0 + ηi + λt) + β1X1it + β2X2it +…+ βkXkit + εit (18) Random effect Two-way model in Panel data regression Yit = β0 + β1X1it + β2X2it +…+ βkXkit + (ηi + λt + εit) (19) when dummies are considered as a part of the intercept in (18), it shows that the correlation between unobservable heterogeneity of each entity and the independent variables was present; consequently, it would be possible to obtain the consistent estimation by means of the within-group estimator by following Ordinary Least Squares (OLS) estimation. In the opposite way, when dummies act as an error term in (19), it shows that the correlation between unobservable heterogeneity of each entity and the independent variables was not present; consequently, it would be possible to obtain the consistent estimation by Generalized Least Squares (GLS) estimation [2]. The normal strategy to determine whether the effects are fixed or random is to use the Hausman test. If the null hypothesis is rejected, the effects are considered to be fixed. If the null hypothesis is accepted, there would be random effects. In this way the analysis can achieve a more efficient estimator of estimated coefficient.
data regression assumes that individuals, firms, states or countries are heterogeneous. Time-series and cross-section data studies not controlling for this heterogeneity run the risk of obtaining biased results. Furthermore, panel data give more informative data, more variability, less collinearity among variables, more degrees of freedom and more efficiency [8]. Thus, the panel data regression analysis will be adapted to the data that obtained from all the hospitals and generate only one set of equations to reflect all the hospital populations.
V. RESULT DISCUSSIONS
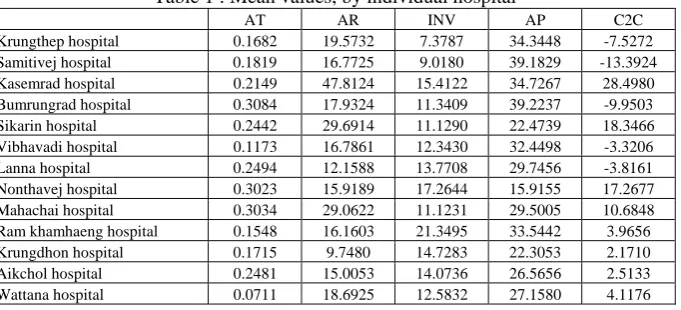
After collecting the data of 13 hospitals from year 2002 to 2008, the list of all thirteen hospitals and their average value of AT, AR, INV, AP and C2C are shown in Table 1.
The regular regression analysis is adapted to the data obtained within the same hospital. This research employs Regression Tool in MS Excel to analyze the model. For panel data regression analysis, this research employs Time Series Cross Section Regression (TSCSREG) procedure to analyze a class of linear econometric model that commonly arise when time series and cross-sectional data are combined [9]. The TSCSREG procedure deals with panel data sets that consist of time series observation on each of several cross-sectional units. The TSCSREG procedure is an application tool in SAS/ETS module of SAS®9 software. The sample of data record sheet for panel data regression analysis is shown in
Table 2. For regular regression, hospital dummy and period of time dummy variables are ignored.
The regular regression is performed and the result in Table 3 shows the effect of AR, INV, AP, and C2C of all hospital on assets turnover by regular regression. The results from regular regression unexpectedly show that only the independent variable payables deferral period is negatively related to the corporate profitability in term of assets turnover under the control variables at significance level 0.10. The rest of the independent variables which are C2C, INV and AR reveal no relationship to assets turnover under the control variables at significance level 0.10.
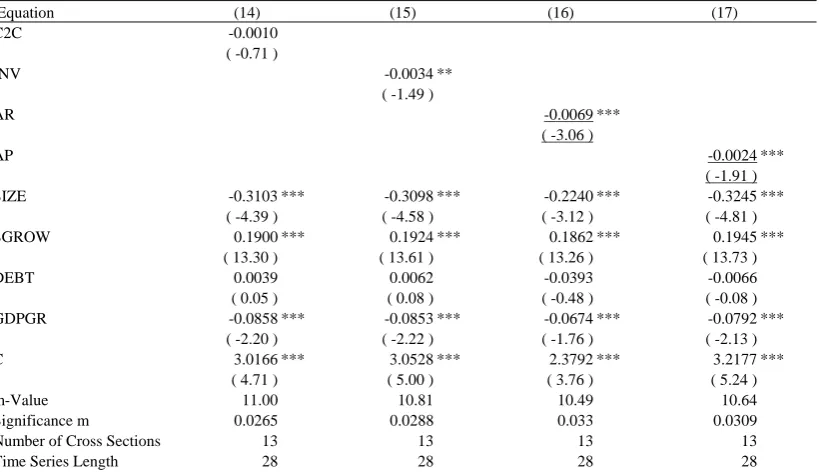
Comparatively, Table 4 presents the effect AR, INV, AP, and C2C of all hospital on assets turnover by panel data regression.The results from panel data regression show that the independent variables of receivable conversion period and payables deferral period are negatively related to assets turnover under the control variables at significance level 0.10. Comparatively, the results from panel data regression analysis provide the better results than the results obtained from regular regression analysis when compared to the expectation from an operationalization, because it can provide a better significance level and more similar outcome with the theory. It can be assumed that the reason for a biased result from regular regression might be caused by an uncontrolled heterogeneity among cross-sections and over times-series of sampling. So, the result from panel data regression can give more informative data, more variability, and more efficiency since an uncontrolled heterogeneity is eliminated.
The outcomes of hypotheses testing and expectation from the operationalization of variables for both regular regression analysis and panel data regression analysis along with the expectation from theory are shown in Table 5. In regards to the theories and research related to this study, the majority of them stated that minimizing receivables and inventories while maximizing payables, will help a firm lower its investment in working capital and achieve financial and production economies. Therefore, the payables deferral period should have a positive relationship with the corporate profitability, in theory.
[image:4.595.130.471.587.742.2]From Table 5, the researcher also discovered a negative relationship between assets turnover and payables. Indeed, the most plausible explanation for the negative relationship between payables deferral period and profitability is that less profitable firms wait longer to pay their bills. Therefore, profitability affects accounts payable policy, and not vice versa. An alternative explanation for a negative relationship between the payables deferral period and profitability could be that the hospitals wait too long to pay their accounts payable. Hence, they could not take advantage of the discount from the distributors whom provide the discount with prompt payment only.
Table 1 : Mean values, by individual hospital
AT AR INV AP C2C
Krungthep hospital 0.1682 19.5732 7.3787 34.3448 -7.5272
Samitivej hospital 0.1819 16.7725 9.0180 39.1829 -13.3924
Kasemrad hospital 0.2149 47.8124 15.4122 34.7267 28.4980
Bumrungrad hospital 0.3084 17.9324 11.3409 39.2237 -9.9503
Sikarin hospital 0.2442 29.6914 11.1290 22.4739 18.3466
Vibhavadi hospital 0.1173 16.7861 12.3430 32.4498 -3.3206
Lanna hospital 0.2494 12.1588 13.7708 29.7456 -3.8161
Nonthavej hospital 0.3023 15.9189 17.2644 15.9155 17.2677
Mahachai hospital 0.3034 29.0622 11.1231 29.5005 10.6848
Ram khamhaeng hospital 0.1548 16.1603 21.3495 33.5442 3.9656
Krungdhon hospital 0.1715 9.7480 14.7283 22.3053 2.1710
Aikchol hospital 0.2481 15.0053 14.0736 26.5656 2.5133
Table 2 : Data Record Sheet Sample for Panel Data Regression Analysis for Hospitals Data
Hospital Period of
time Years INVit ARit APit C2Cit SIZEit SGROWit DEBTit GDPGRit ATit
Hospital Dummy Period of time Dummy Variable
#1 • • • #13 2002 • • • 2008
Q1 Q2 Q3 Q4 Q1 Q2 Q3 Q4
#1 2002_Q1 0.25 . . . 1 . 0 1 0 0 0 . 0 0 0 0
#1 2002_Q2 0.50 . . . 1 . 0 0 1 0 0 . 0 0 0 0
#1 2002_Q3 0.75 . . . 1 . 0 0 0 1 0 . 0 0 0 0
#1 2002_Q4 1.00 . . . 1 . 0 0 0 0 1 . 0 0 0 0
• • • • • • • • • • • • • • • • • • • • • • • •
• • • • • • • • • • • • • • • • • • • • • • • •
• • • • • • • • • • • • • • • • • • • • • • • •
#1 2008_Q1 6.25 . . . 1 . 0 0 0 0 0 . 1 0 0 0
#1 2008_Q2 6.50 . . . 1 . 0 0 0 0 0 . 0 1 0 0
#1 2008_Q3 6.75 . . . 1 . 0 0 0 0 0 . 0 0 1 0
#1 2008_Q4 7.00 . . . 1 . 0 0 0 0 0 . 0 0 0 1
Table 3 : Effect of AR, INV, AP, and C2C of all hospital on assets turnover by regular regression
Equation (10) (11) (12) (13)
C2C 0.0006
( 0.78 )
INV -0.0031 ** ( -1.61 )
AR -0.0001 ( -0.09 )
AP -0.0025 ***
( -2.16 )
SIZE -0.0382 ** -0.0454 *** -0.0414 *** -0.0236
( -1.62 ) ( -1.95 ) ( -1.76 ) ( -0.96 )
SGROW 0.1738 *** 0.1748 *** 0.1732 *** 0.1755 ***
( 12.02 ) ( 12.11 ) ( 11.98 ) ( 12.20 )
DEBT -0.0471 -0.0619 -0.0486 -0.0333
( -0.80 ) ( -1.04 ) ( -0.82 ) ( -0.56 )
GDPGR -0.0322 -0.0380 ** -0.0356 * -0.0282
( -1.22 ) ( -1.47 ) ( -1.37 ) ( -1.09 )
C 0.5383 *** 0.6525 *** 0.5722 *** 0.4730 ***
( 2.59 ) ( 3.14 ) ( 2.81 ) ( 2.29 )
F-Value 29.11 29.68 28.94 30.27
Significance F <.0001 <.0001 <.0001 <.0001
Obs. 347 347 347 347
[image:5.595.84.494.531.767.2]Notes:t statistic in parentheses; *Significant at 80 percent; **Significant at 85 percent; ***Significant at 90 percent; F-Value and Significance F are obtained from ANOVA; C – Intercept.
Table 4 : Effect of AR, INV, AP, and C2C of all hospital on assets turnover by panel data regression
Equation (14) (15) (16) (17)
C2C -0.0010
( -0.71 )
INV -0.0034 ** ( -1.49 )
AR -0.0069 ***
( -3.06 )
AP -0.0024 ***
( -1.91 )
SIZE -0.3103 *** -0.3098 *** -0.2240 *** -0.3245 ***
( -4.39 ) ( -4.58 ) ( -3.12 ) ( -4.81 )
SGROW 0.1900 *** 0.1924 *** 0.1862 *** 0.1945 ***
( 13.30 ) ( 13.61 ) ( 13.26 ) ( 13.73 )
DEBT 0.0039 0.0062 -0.0393 -0.0066
( 0.05 ) ( 0.08 ) ( -0.48 ) ( -0.08 )
GDPGR -0.0858 *** -0.0853 *** -0.0674 *** -0.0792 ***
( -2.20 ) ( -2.22 ) ( -1.76 ) ( -2.13 )
C 3.0166 *** 3.0528 *** 2.3792 *** 3.2177 ***
( 4.71 ) ( 5.00 ) ( 3.76 ) ( 5.24 )
m-Value 11.00 10.81 10.49 10.64
Significance m 0.0265 0.0288 0.033 0.0309
Number of Cross Sections 13 13 13 13
Time Series Length 28 28 28 28
Table 5: Comparison between the outcomes of hypotheses testing and expectation from the operationalization of variables for both regular regression analysis and panel data regression analysis
Dependent Variable
Independent Variable
Expectation from an operationalization
Outcomes of hypotheses testing Analyzed by
Regular Regression
Analyzed by Panel Data Regression
AT
C2C Negatively
related with AT
Has no relationship with AT
Has no relationship with AT
INV Negatively
related with AT
Has no relationship with AT
Has no relationship with AT
AR Negatively
related with AT
Has no relationship with AT
Negatively related with AT
AP Negatively
related with AT
Negatively related with AT
Negatively related with AT
The researcher obtained similar results to the research by [2] who found “a significant negative relation between gross operating income and number of days accounts receivable, inventories, and account payable of Belgian firms”. His results suggest that firms can increase corporate profitability by decreasing the inventory conversion period, receivables collection period, and payables deferral period.
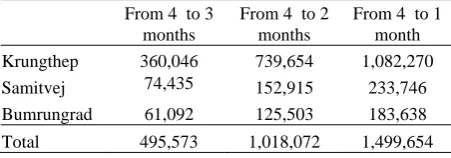
When considering the result of the regression by each hospital individually, the results of Krungthep, Samitivej and Bumrungrad hospitals show a negative relationship between payables deferral period and the assets turnover. Thus, it indicates that it is possible for drug distributors to gain the benefit of cost-saving from the reduction of granting period from four months for these three hospitals. Table 6 presents the potential to gain cost-saving in Baht from a granting period reduction of these hospitals. This cost-saving comes from an ability to purchase more products to sell at other hospitals. It is obvious that shorter the payment period yield higher cost-saving.
Table 6: The potential cost-saving (Baht) from payable period reduction of the private hospitals which reveals negative relation of AP on AT by both regressions analyses.
From 4 to 3 months
From 4 to 2 months
From 4 to 1 month
Krungthep 360,046 739,654 1,082,270
Samitvej 74,435 152,915 233,746
Bumrungrad 61,092 125,503 183,638
Total 495,573 1,018,072 1,499,654
VI. CONCLUSIONS
After performing regular and panel data analysis on the data of 13 private hospital in Thailand from 2002-2008, it can e concluded that the results from panel data regression analysis with SAS programs provide more reasonable outcomes than the results obtained from regular regression analysis with Microsoft Excel when judged by the expectation from the theory. Next, the listed private hospital firms in SET can increase corporate profitability, which implies through the parameter of asset turnover, by decreasing receivables conversion period and payables deferral period. Even though the overall result does not comply with the anticipated result,
Reference [1] also found the result in the same direction as
the researcher by also using regression analysis. Consequently, if the results can be applied in practice, it can be beneficial to both drug distributors and the hospitals. The drug distributor will be able to collect the payment sooner and invest more while the hospitals will increase the profitability from the given discount with shorter deferral payment period.
For the future research direction, because the population of the private hospitals in the SET collected in this study accounts for only 28% of the total private hospital population in Thailand when considered by bed numbers, the researcher suggests that an increase in hospital population in the future would be useful to obtain more accurate data and better represent the characteristics of this particular industry. Besides, if possible, there should be a comparison against the same set of relationships found in the public hospital population, to gain further perspectives.
REFERENCES
[1] Deloof, M. (2003). Does working capital management affect
profitability of Belgian firms?. Journal of Business, Finance and
Accounting, 30, 573-587.
[2] Garcı´a-Teruel, J.P. & Martı´nez-Solano, P. (2007). Effects of working
capital management on SME profitability. International Journal of
Managerial Finance, 3 (2), 164-177.
[3] Soenen, L.A. (1993). Cash conversion cycle and corporate profitability.
Journal of Cash Management, 13 (4), 53-58.
[4] Anthony, R.N., Hawkins, D.F., & Merchant, K.A. (1999). Accounting:
Text and Cases (10th ed.).
[5] Ismail Ali Siad (2007). Applied Financial Management. Assumption
University of Thailand, 66.
[6] Shin, H.H. & Soenen, L. (1998). Efficiency of working capital and corporate profitability. Financial Practice and Education, 8, 37-45. [7] Stock, J.H. & Watson, M.W. (2007). Regression with Panel Data.
Introduction to Econometrics. Boston: Pearson Education, 349. [8] Baltagi, B.H. (2001). Econometric Analysis of Panel Data (2nd ed.).
Chichester: John Wiley & Sons.
[9] Park, Hun Myoung (2008). Linear Regression Models for Panel Data Using SAS, Stata, LIMDEP, and SPSS. Technical Working Paper. The University Information Technology Services (UITS) Center for