Normative reference of standing long jump indicates
gender difference in lower muscular strength of
pubertal growth
Louisa Ming Yan Chung*, Lina Pui Yu Chow, Joanne Wai Yee Chung
Department of Health and Physical Education, The Hong Kong Institute of Education, Hong Kong, China; *Corresponding Author: [email protected]
Received 18 April 2013; revised 18 May 2013; accepted 5 June 2013
Copyright © 2013 Louisa Ming Yan Chung et al. This is an open access article distributed under the Creative Commons Attribution License, which permits unrestricted use, distribution, and reproduction in any medium, provided the original work is properly cited.
ABSTRACT
Background: Although the standing long jump (SLJ) is a popular physical fitness assessment, it lacks an updated criterion-reference standard. This study generated the first normative SLJ test data for Chinese aged 8 - 18. Methods: From September 2005 to December 2011, comprehen- sive physical fitness assessments were con- ducted on 12,712 school students. The SLJ performances were significantly different be- tween boys and girls (all age groups, p < 0.01). Results: The boys performed better than the girls in each age group. The mean difference in- creased as the age increased, depicting a pro- minent variance in muscular strength between boys and girls at age 12, and the variances be- came larger at age 18. Girls in the 70th percent- tile performed similarly to boys performing in the 10th percentile. The onset of muscle stren- gth for boys found in this study corresponded to the onset age of testosterone maturation of Chinese boys investigated in previous studies. Linear regression found age and BMI predicting SLJ significantly for boys and girls, explaining better SLJ results in older boy and the effect of their heavy body size. Conclusions: This study indicated a muscular strength difference be- tween genders during growth and added sup- porting evidence to the hormonal influence of muscle growth during puberty.
Keywords:Normative Reference; Standing Long Jump; Children; Adolescent; Lower Muscular Strength
1. INTRODUCTION
Physical fitness tests are highly recommended as part
of a successful health and fitness screening and surveil- lance system for their moderate tracking of physical ac- tivity from childhood to adulthood [1]. Proper field tests offer reliable and valid results in mass testing [2,3], and many physical educators should adopt field tests instead of sophisticated laboratory equipment to assess physical fitness in schools and communities.
Among these field tests, the standing long jump (SLJ) is considered the most valid field-based muscular fitness test compared with isokinetic strength exercises [4]. A cross-sectional study of Brazilian students aged 7 - 15 showed that the single SLJ could possibly reflect the overall fitness level indicated by other muscular tests such as the 1-minute curl-up, pull-up, ball throw, 9-mi- nute run, 20-meter run and 4-meter shuttle run [5]. Re- cent studies of healthy Caucasian girls aged 6 - 17 have also indicated a strong association between the SLJ and other lower-body muscular strength tests [6]. Indeed, SLJ tests can be practical, time-efficient and affordable me- thods for assessing muscular fitness in young children.
However, an updated SLJ reference standard is re- quired for the physical educators, particularly for China. Sufficient normative data on schoolchildren are not avai- lable for physical educators to interpret and compare measured results. The few recent related studies pub- lished limited data [7-11]. In addition, the age ranges (9 - 10, 6 - 12 and 7 - 15) and sample sizes (no more than 500) of these studies have been narrow [7,9,11]. The results from these studies are difficult to apply as normative data. A recent systematic review attempted to consolidate the data for this purpose, but the results were validated only for 9- to 15-year-olds and Australian children.
In fact, nationwide student fitness surveys were con- ducted in Taiwan in 1997 [12] and in mainland China in 2000 and 2005 [13,14]; and limited long jump data were published for comparison. Among the three Chinese- populated locations surveyed, only Hong Kong has not
established a systematic physical fitness assessment on a large scale. This study aimed to generate normative SLJ test data for schoolchildren aged 8 - 18 and to present the first large-scale SLJ norms for Chinese children in Hong Kong. The results could prove useful in the screening of lower muscular fitness for children in school settings.
2. SAMPLES AND METHODS
From September 2005 to December 2011, a university research team conducted comprehensive physical fitness assessments for primary and secondary schoolchildren. A snowball sample process was implemented to recruit and refer schools that were interested in carrying out the assessments. Each student completed a battery of field tests according to the China Education Bureau Protocol [15]. This study followed the Helsinki Deceleration of 1975 and was approved by the Ethics Committee of the University. All of the students and their parents were given information sheets describing the purpose and application of the physical fitness assessments. They were asked to sign consent forms before the assessments were administered. Its measurement and instrument de- tails were described [16,17] previously. Body height in centimeters (cm) and body weight in kilograms (kg) were measured in the physical fitness assessment. Body weight was taken and rounded to the nearest 0.1 kg and body height was taken and rounded to the nearest 1 cm.
The SLJ measurement model was used and calibrated on each day of data collection. Children aged 8 or above were invited to take an SLJ test. Each student’s longest jump distance from the starting point to the endpoint after two attempts was measured in centimeters. PE teachers and university student helpers were responsible for conducting the mass field measurements at the schools. All PE teachers and university student helpers were trained to use the equipment and ensure that the participating students gave their best performances du- ring the tests.
In total, six primary schools and 17 secondary schools carried out physical fitness assessments. According to the data collected, a total of 14,988 students took part. Because students aged under 8 did not take the SLJ tests and some of the students were not of Chinese ethnicity, only 12,712 students aged 8 - 18 contributed to the es- tablishment of normative standards in this study.
3. DATA ANALYSIS
All analysis was conducted with Statistical Package for the Social Sciences, version 20. Paired t-test was used to compare means of distances performed in SLJ be- tween boys and girls at the same age. A significance level of 1% was used for statistical testing. The results are presented stratified by age and sex, stating the inter- quartile range of SLJ performed distance, as well as per-
centiles of P5, P10, P25, P50, P75, P90, and P95. Inter- polated 10th, 30th, 50th, 70th and 90th percentile curves of the SLJ results for the total cases were presented by gender.
Body mass index (BMI) was calculated with body weight in kilograms over square of body height in meters. BMI was categorized into “underweight”, “normal”, “overweight” and “obese” with the BMI cut-off points in Chinese population [13]. Median (P50) of SLJ with ages was plotted in BMI categories by sex. Continuous data of age and BMI were used to predict results in SLJ with linear regression.
4. RESULTS
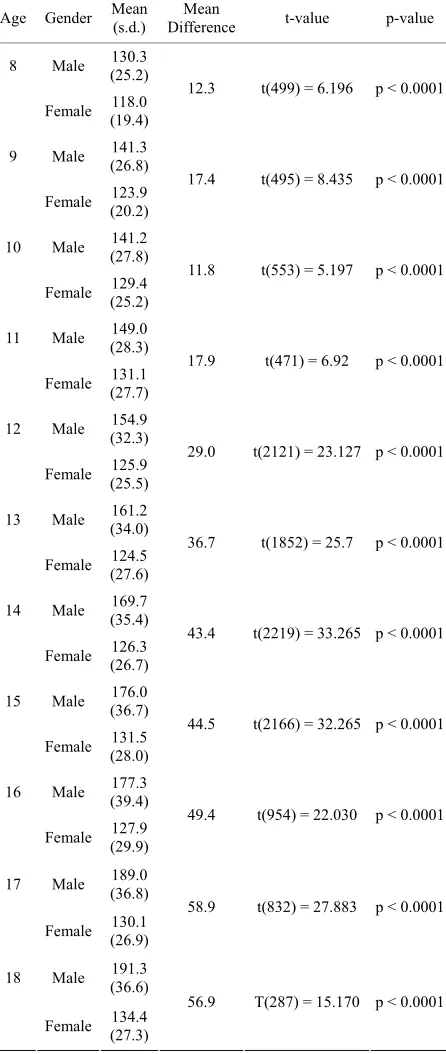
The SLJ performances were significantly different be- tween boys and girls, with all age groups at a 0.01 sig- nificance level (Table 1). The boys performed better than the girls in each age group. The mean difference increased as the age increased, depicting a prominent variance in muscular strength between boys and girls at age 12, and the variance became larger at age 18.
The interquartile range (IQR) showed a gender-spe- cific normal distribution for the SLJ performances. The IQR shown in Table 2 indicated a narrow bell-shaped distribution for boys at lower ages that became wider as the age increased. The IQR also began with a narrow bell-shaped distribution for girls aged 8 and 9. The bell-shaped curve became wider as the age increased to 15 before decreasing at ages 16 - 18.
Figure 1 shows that the 30th, 50th, 70th and 90th per- centile curves for male students all sloped up as the age increased. However, the 10th percentile curve differed from the other percentile curves, dropping at age 16. The 10th, 30th, 70th and 90th percentile curves of female students had similar shapes. However, unlike the male student percentile curves, they were flat and did not in- crease much with the age. The female students’ 50th percentile curve lined in a similar way but peaked at age 15. In comparison, the boys showed better lower muscu- lar strength performances than the girls. Girls in the 70th percentile performed similarly to boys performing in the 10th percentile.
Medians of SLJ in each BMI categories were depicted in Figure 2. The results of boys in the four body size were in upward trends with underweight group per- formed the best, followed by normal body size, over- weight and obese. Patterns of medians SLJ were regular for boys, except results at age 18 which showed a sig- nificant increase in the test performance. However, the patterns of SLJ were in saw tooth shape for girls. Similar to the boys, underweight girls performed the best in SLJ, followed by normal size girls, overweight girls and obese girls.
Table 1. Gender differences in standing long jump results by
paired t-test.
Age Gender Mean (s.d.) DifferenceMean t-value p-value
8 Male (25.2) 130.3
Female (19.4) 118.0
12.3 t(499) = 6.196 p < 0.0001
9 Male (26.8) 141.3
Female (20.2) 123.9
17.4 t(495) = 8.435 p < 0.0001
10 Male (27.8) 141.2
Female (25.2) 129.4
11.8 t(553) = 5.197 p < 0.0001
11 Male (28.3) 149.0
Female (27.7) 131.1
17.9 t(471) = 6.92 p < 0.0001
12 Male (32.3) 154.9
Female (25.5) 125.9
29.0 t(2121) = 23.127 p < 0.0001
13 Male (34.0) 161.2
Female (27.6) 124.5
36.7 t(1852) = 25.7 p < 0.0001
14 Male (35.4) 169.7
Female (26.7) 126.3
43.4 t(2219) = 33.265 p < 0.0001
15 Male (36.7) 176.0
Female (28.0) 131.5
44.5 t(2166) = 32.265 p < 0.0001
16 Male (39.4) 177.3
Female (29.9) 127.9
49.4 t(954) = 22.030 p < 0.0001
17 Male (36.8) 189.0
Female (26.9) 130.1
58.9 t(832) = 27.883 p < 0.0001
18 Male (36.6) 191.3
Female (27.3) 134.4
56.9 T(287) = 15.170 p < 0.0001
tors for the dependent variable of SLJ. The statistic re- sults of R, R square and SEE were 45.0%, 20.2% and 33.272 (p < 0.001) respectively in boys, while those cor- responding results of girls were 17.3%, 3.0% and 26.459 (p < 0.001). The formulated regression equations were as follows:
[image:3.595.62.285.116.643.2]Boys: SLJ = 112.97 + 7(Age) − 2.08(BMI)
Figure 1. Interpolated 10th, 30th, 50th, 70th and 90th percent-
tile curves of the standing long jump for the total cases by gen- der.
(a)
(b)
Figure 2. Relationships of SLJ performance on age,
sex and different body size.
Girls: SLJ = 129.6 + 1.36(Age) − BMI
With all constants and independent variables signifi- cantly contributed in predicting SLJ (p < 0.001).
5. DISCUSSION
According to the Census and Statistics Department [18], there were 423,700 children aged 10 - 19 in Hong Kong in 2011. This study covered 3% of the children and adolescents in Hong Kong’s population and we measured lower muscle strength with SLJ distance testing. While
[image:3.595.321.520.256.570.2]Table 2. Standing long jump (cm) percentile summary of Hong Kong schoolchildren by age and gender.
Age
(Years) N P5 P10 P25 P50 P75 P90 P95 Mean s.d. IQR
Boys
8 289 94.0 101.0 115.0 126.0 144.0 160.0 174.0 130.3 25.2 29
9 268 100.0 108.9 121.0 142.0 157.0 176.1 186.6 141.3 26.8 36
10 302 100.0 106.0 121.0 142.0 159.3 179.0 192.6 141.2 27.8 38
11 259 100.0 110.0 131.0 150.0 167.0 185.0 197.0 149.0 28.3 36
12 1209 100.0 110.0 140.0 154.0 173.0 192.0 214.0 154.9 32.3 33
13 1015 102.0 112.0 143.0 160.0 182.0 210.0 218.0 161.2 34.0 39
14 1208 110.0 122.9 148.0 165.0 192.8 220.0 228.0 169.7 35.4 45
15 1174 111.0 135.0 152.0 174.0 200.3 225.0 240.0 176.0 36.7 48
16 556 104.0 113.7 151.3 181.0 206.0 224.0 240.0 177.3 39.4 55
17 457 119.7 140.0 165.5 188.0 217.0 234.2 246.4 189.0 36.8 52
18 160 125.1 142.1 171.3 189.0 215.0 249.8 255.0 191.3 36.6 44
Girls
8 213 90.1 96.0 104.0 117.0 128.0 144.2 150.3 118.0 19.4 24
9 254 93.0 100.0 110.8 120.0 138.0 155.5 160.0 123.9 20.2 27
10 253 90.7 100.0 110.5 127.0 147.0 160.0 169.0 129.4 25.2 37
11 214 93.8 100.5 110.8 125.0 147.5 163.5 182.0 131.1 27.7 37
12 917 86.0 93.0 106.0 123.0 145.0 156.0 166.1 125.9 25.5 39
13 840 83.0 90.0 102.0 122.0 147.0 158.9 168.0 124.5 27.6 45
14 1067 84.0 91.8 104.0 124.0 148.0 158.0 166.0 126.3 26.7 44
15 1038 86.0 95.0 106.0 140.0 152.0 163.0 172.1 131.5 28.0 46
16 402 84.0 90.3 105.0 124.0 148.3 171.0 184.0 127.9 29.9 43
17 485 89.3 95.0 108.5 127.0 150.0 165.0 173.0 130.1 26.9 42
18 132 97.3 102.0 112.3 134.0 154.0 170.0 183.0 134.4 27.3 42
Percentile data were collected from 12,712 students from 2005-2011. P, percentile; s.d., standard deviation; IQR, interquartile range.
the normative reference should be ethnic specific, most of the few published works on SLJ tests have focused on Caucasian populations. Criterion-referenced standards for Chinese were published with the data collected in 2000, however, the validity of criterion-referenced stan- dards in classifying test results could not be found. Therefore, it has long been a problem for physical edu- cators or sports trainers to evaluate the ability of a child’s lower muscular strength with standard reference. This study established the first normative data for the SLJ test for Hong Kong Chinese school students which proposed reference values and explored variations between boys and girls at the same age.
The data collected in this study showed that the gender differences in lower muscular strength were small when the children were aged 8 - 11. The differences in lower muscular strength enlarged by age 12 and further broad- ened until ages 17 - 18. This corresponds to the puberty stages of boys and girls. Under the influence of gonadal steroid hormones and the growth hormone, bone mineral content or muscle mass increases faster in boys. In addi- tion, while testosterone affects boys with a significant increase in bone and muscle growth, it decreases the de- position of fat in the limbs. The increase in skeletal size and muscle mass leads to augmented strength in boys,
and more than 90% of an adolescent’s peak skeletal mass is present by age 18 [19-21].
The onset of muscle strength for boys found in this study also corresponded to the finding of Leung [22] that 50% of Chinese boys develop a testis size of 4 millilitres by ages 11 - 12, positioning the age of sexual maturation in Chinese boys between 11 and 12. The testosterone produced also influences the rapid increase in muscle tissue in boys at these ages, contributing to the muscle spurts found in this normative data.
predicting the SLJ, showing body size of boys affect SLJ results more than that of girls. The findings in this model addressed the proliferated SLJ performance with age and BMI in gender difference. Boys and girls in younger ages could possibly perform similarly if they were in similar BMI. But the performance difference could in- crease drastically studied in higher forms and this dif- ference becomes broadened to overweight and obese boys and girls.
6. LIMITATIONS
This study has limitations associated with the wide re- cruitment range of the participating students at each age. It is a common situation for Hong Kong schools to have fewer classes at the upper level of study (Form 6 and Form 7) and more classes at the lower level of study (Form 1 to Form 5), as half of the students cannot be promoted after taking their Hong Kong Certificate Ex- amination in Form 5. This means that significantly fewer students aged 16 - 18 were recruited if their entire schools signed on for our physical fitness assessments. In addition, the birth rate in Hong Kong has dropped dra- matically in the last decade, making it difficult for the research team to recruit a commensurate sample of pri- mary school students compared with secondary school students.
7. CONCLUSION
This study is the first to publish normative SLJ test data for a large sample size of Chinese students in Hong Kong. The normative data covered a wide range of ages (8 - 18) and indicated the lower muscular strengths of boys and girls across the childhood, puberty and maturity stages. The SLJ performances tends to increase with age and the findings identified muscular strength differences between genders during growth, adding supporting evi- dence to the hormonal influence of muscle growth during puberty. This study also explained the effect of age and body size on SLJ performance, and how the gender dif- ference affect the SLJ results.
REFERENCES
[1] Catley, M.J. and Tomkinson, G.R. (2013) Normative heal- th-related fitness values for children: Analysis of 85,347 test results on 9- 17-year-old Australians since 1985. Bri- tish Journal of Sports Medicine, 47, 98-108.
[2] Ruiz, J.R., et al. (2009) Predictive validity of health-re- lated fitness in youth: A systematic review. British Jour- nal of Sports Medicine, 43, 909-923.
doi:10.1136/bjsm.2008.056499
[3] Ruiz, J.R., et al. (2001) Field-based fitness assessment in young people: The ALPHA health-related fitness test bat- tery for children and adolescents. British Journal of Spor-
ts Medicine, 45, 518-524. doi:10.1136/bjsm.2010.075341
[4] Artero, E.G., et al. (2012) Criterion-related validity of field- based muscular fitness tests in youth. Journal of Sport Medicine and Physical Fitness,52, 263-272.
[5] Dumith, S.C., et al. (2012) Physical fitness measures among children and adolescents: Are they all necessary? Journal of Sport Medicine and Physical Fitness, 52, 181-
189.
[6] Castro-Pinero, J., et al. (2010) Assessing muscular streng- th in youth: Usefulness of standing long jump as a gen- eral index of muscular fitness. Journal of Strength & Conditioning Research, 24, 1810-1817.
doi:10.1519/JSC.0b013e3181ddb03d
[7] Pyke, J.E. (1987) Australian health and fitness survey 1985: The fitness, health and physical performance of Australian school students aged 7-15 years. The Austra- lian Council for Health, Physical Education and Recrea- tion, Parkside.
[8] Birchall, J. (1992) Health related fitness testing. In: Went, S., Ed., A Healthy Start: Holistic Approaches to Health Promotion in School Communities, Monash University, Melbourne, 251-265.
[9] Hands, B. (2000) Fitness and motor skill levels of West-ern Australian primary school children. University of Western Australia, Perth.
[10] Dollman, J., et al. (1999) The evolution of fitness and fat- ness in 10- 11-year-old Australian schoolchildren: Chan- ges in distributional characteristics between 1985 and 1997. Pediatric Exercise Science,11, 106-121.
[11] Haga, M. (2008). The relationship between physical fit- ness and motor competence in children. Child Care Heal- th and Development, 34, 329-334.
doi:10.1111/j.1365-2214.2008.00814.x
[12] Chiang, J., et al. (1998) The 1997 nation-wide children and youth fitness study. Ministry of Education, Taipei. [13] The Research Group on Chinese School Students Physi-
cal Fitness and Health (2002) Report on the physical fit- ness and health surveillance of Chinese school students in 2000. Higher Education Press, Beijing.
[14] The Research Group on Chinese School Students Physi- cal Fitness and Health (2007) Report on the physical fit- ness and health surveillance of Chinese school students in 2005. Higher Education Press, Beijing.
[15] Chief Secretary for Sport of General Administration of Sport of China (2002) Annual report of national constitu- tion assessment in 2000. Beijing University of Physical Education Press, Beijing.
[16] Chung, J.W.Y., et al. (2009) The impact of lifestyle on the physical fitness of primary school children. Journal of Clinical Nursing, 18, 1002-1009.
doi:10.1111/j.1365-2702.2008.02420.x
[17] Chung, L.M.Y., et al. (2010) Importance of a balanced diet on the physical fitness level of school children aged 6-12. Journal of Child Health Care, 14, 280-295.
doi:10.1177/1367493510374065
[18] Census and Statistics Department, Hong Kong Special Administration Region (2012) Hong Kong annual digest
of statistics, 18 December 2012.
http://www.statistics.gov.hk/pub/B10100032012AN12B0 100.pdf
[19] Bonjour, J., et al. (1991) Critical years and stages of pu- berty for spinal and femoral bone mass accumulation during adolescence. Journal of Clinical Endocrinology & Metabolism, 73, 555-563.
doi:10.1210/jcem-73-3-555
[20] Slemenda, C.W., et al. (1994) Influence on skeletal min- eralization in children and adolescents: Evidence for va-
rying effects of sexual maturation and physical activity. Journal of Pediatric, 125, 201-207.
doi:10.1016/S0022-3476(94)70193-8
[21] Rogol, A.D., et al. (2002) Growth at puberty. Journal of Adolescent Health, 31, 192-200.
doi:10.1016/S1054-139X(02)00485-8
[22] Leung, S.S.F. (1993) Growth standard of Southern Chi- nese. The Chinese University of Hong Kong, 18 Decem- ber, 2012.