1
On the Combined Effect of Due Date Setting, Order Release, and
Output Control: An Assessment by Simulation
Matthias Thürer, Mark Stevenson (corresponding author), Martin J Land, and Larry D Fredendall
Name: Matthias Thürer Institution: Jinan University
Address: Institute of Physical Internet
School of Electrical and Information Engineering 519070, Zhuhai, PR China
E-mail: [email protected] Name: Mark Stevenson
Institution: Lancaster University
Address: Department of Management Science Lancaster University Management School Lancaster University
LA1 4YX - U.K.
E-mail: [email protected] Name: Martin J. Land
Institution: University of Groningen Address: Department of Operations
Faculty of Economics and Business University of Groningen
9700 AV Groningen - The Netherlands Email: [email protected]
Name: Lawrence D. Fredendall Institution: Clemson University
Address: Department of Management 101 Sirrine Hall
Clemson SC – United States Email: [email protected]
2
On the Combined Effect of Due Date Setting, Order Release, and
Output Control: An Assessment by Simulation
Abstract
The Workload Control production planning and control concept for high-variety shops is built on the principles of input/output control. Order release is used for input control, to regulate the flow of work entering the shop and/or shop floor while capacity adjustments are used for output control, to regulate the outflow of work. Both functions together should smooth workloads and stabilize throughput times. The literature however has argued that input/output control overemphasizes throughput improvements to the detriment of the timing of individual orders and, consequently, that it needs to be supplemented by a preceding customer enquiry stage where due dates (or delivery lead times) are quoted. Yet, although there are broad separate literature streams on due date setting, order release, and output control, there is a lack of research on the three functions together. In response, this study uses simulation to assess the combined performance effect of all three functions. Results show that each control function can be related to a specific performance objective. The degree of emphasis that should be placed on each function therefore depends on a company’s specific performance needs. Due date setting and capacity adjustments (output control) are shown to support each other as they address different performance objectives. Meanwhile, order release (input control) is effective in reducing work-in-process and can play a role in making throughput improvements when capacity adjustments are not possible. Findings enhance existing literature on the diagnosis of delivery reliability performance in high-variety shops, with important implications for research and practice.
3 1. Introduction
Workload Control is a production planning and control concept developed for high-variety contexts, such as small and medium-sized make-to-order companies, which often have a job shop configuration (Zäpfel & Missbauer, 1993; Stevenson et al., 2005). The concept has been shown to significantly improve the performance of job shops both through simulation (e.g. Thürer et al., 2012, 2014) and, on occasions, in practice (e.g. Wiendahl, 1992; Bechte 1994; Hendry et al., 2013; Silva et al., 2015). While several different approaches to Workload Control exist (Thürer et al., 2011), a major unifying principle driving Workload Control is input/output control, i.e. that the input rate to the shop should be equal to the output rate (e.g. Wight, 1970; Plossl & Wight, 1971). Consequently, there are two control mechanisms within the Workload Control concept (e.g. Land & Gaalman, 1996; Kingsman, 2000): (i) input control, which regulates the work that can enter the shop and/or shop floor; and (ii) output control, which uses capacity adjustments to regulate the outflow of work. Further, there are two performance objectives that together determine delivery performance in make-to-order job shops (e.g. Land, 2006): (i) throughput improvement, which aims to reduce the average lateness of orders; and, (ii) timing, which aims to reduce the dispersion of lateness. As noted by Kingsman et al. (1989), input/output control mechanisms have a strong bias towards throughput time stabilization and thus towards improving throughput performance. This overlooks the important role of the timing function and due date setting; the latter specifically if customer due dates can be determined internally by the company, i.e. are negotiable. In response, this study makes a contribution to the literature by using simulation to assess the combined effect of due date setting, order release, and output control.
4
exists a broad literature on the different functions in isolation, literature that assesses the combined effect of the different control functions is scarce. Few studies, for example, have examined the interactions between due date setting and order release control. Bertrand (1983a) argued that controlled order release does not have a significant impact on performance if an effective due date setting procedure is applied. Ahmed & Fisher (1992) later found that the true impact of order release depends on the set of due date setting and order release rules applied; but the authors did not consider the procedure described in Bertrand (1983a). More recently, Thürer et al. (2014) demonstrated that an effective due date setting rule and order release control can and should play complementary roles in an integrated Workload Control system while Thürer et al. (2016) demonstrated that output control can and should complement order release. Hence, there are a few papers that have examined pairs of control functions; but to the best of our knowledge, no study has examined the combined effect of all three control functions together. This is a major shortcoming since it remains unknown whether all three control functions should be implemented together or if a subset is sufficient (as argued in Bertrand 1983a); and, if so, which subset should be implemented. Addressing this research need is therefore the first objective of our study.
A second objective of our study is to link the control functions to throughput and timing performance objectives. Soepenberg et al. (2012) recently argued that a diagnosis of delivery reliability performance is vital if production planning and control decisions are to be improved. The authors outlined a diagnosis framework that allows poor delivery reliability to be attributed to poor throughput or timing capabilities. The present study seeks to enhance this framework by providing an indication of which control function to use to improve delivery reliability.
5
The simulation model used to evaluate performance is then described in Section 3. The results are presented, discussed, and analyzed in Section 4 before conclusions are provided in Section 5, where managerial implications, limitations, and future research directions are also outlined.
2. Workload Control This study started by asking:
What is the combined performance effect of due date setting, order release control, and output control?
To answer this question, we explore the performance of a comprehensive Workload Control concept in a pure job shop using controlled simulation experiments. Workload Control was chosen since it integrates all three production control functions. The relevant literature on due date setting, order release control, and output control will be discussed in sections 2.1 to 2.3, respectively. Here we also outline how each control function is modeled in our study.
2.1 Due Date Setting
6
(i.e. 0% of due dates set by the due date setting rule). The probability that a due date can be set internally for an enquiry is modeled as a Bernoulli trial.
2.1.1 Internally (or Endogenously) Set Due Dates
When a new job j arrives, a feasible due date (dj) is determined via forward scheduling whereby the following three elements – which constitute the lead time allowance – are added to the current time t (see Equation (1)): an allowance aj for the time that a job has to wait in the pre-shop pool prior to release; an allowance bij for the operation throughput time of each operation i in the routing Rjof a job to allow for the shop floor throughput time; and, an external allowance cj that compensates for variability between the estimated lead time and the delivery time that is ultimately realized.
j R
i ij j
j t a b c
d
j
(1)
7
Most due date setting rules presented in the Workload Control literature differ in the way that allowances are determined for the shop floor throughput time. For example, forward infinite loading assumes operation throughput times are constant (e.g. Weeks, 1979; Ragatz & Mabert, 1984; Vig & Dooley, 1993). Meanwhile, other studies link the processing time and shop load to the delivery time based on historical data via regression (e.g. Ragatz & Mabert, 1984, Ahmed & Fisher, 1992; Vig & Dooley, 1993;Moses et al., 2004) or link the workload at a station to the allowance for the operation throughput time (e.g. Nyhuis & Wiendahl, 2009).
Bertrand (1983a and 1983b) determined a dynamic allowance for operation throughput times by fitting a cumulative input curve to a cumulative output curve. Operation due dates dij for each operation i in the routing of a job j, where d0j is defined as the current date, are successively
scheduled using the time-phased accepted workload (WstA) and time-phased capacity (Cst) of the corresponding station s – both measures calculated cumulatively up to time bucket t – as follows.
Starting with the first station in the routing of a job:
If the time bucket into which the operation due date would fall if capacity were infinite – that is dij di1j pij – has enough free capacity to include the workload pij of the i
th operation of
job j at the relevant station s – that is WstA pij Cstuswith us equal to the utilization rate – then the operation is loaded into the time bucket and the operation due date is given by this time bucket.
If no or insufficient capacity is available, the next time bucket t+1 is considered until the workload has been successfully loaded.
8
the cumulative workload – until it has been completed. This forward finite loading procedure was recently identified as the best solution for the Workload Control concept (see, e.g. Thürer et al., 2013) and will thus be included in our study to set allowances for operation throughput times. The time buckets are arbitrarily set to one time unit.
Finally, the external allowance cj is often included in the allowance for operation throughput times in the literature (Hopp & Sturgis, 2000). Notable exceptions that have differentiated between an internal (or production) due date and an external (or customer) due date – which is the internal due date plus the external allowance – were presented by Bertrand (1983a), Enns (1995b), and Hopp & Sturgis (2000). The latter compared the use of a constant external allowance with the use of alternative, dynamic external allowances. Numerical results suggested that there are no significant performance differences. Therefore, a constant allowance will be used. This allowance is set through preliminarily simulation experiments such that the average of the lead time allowance is 32 time units, i.e. the average of (exogenously set) lead time allowances, as will be described next.
2.1.2 Externally (or Exogenously) Set Due Dates
9
the assumption of infinite capacity. The allowance for operation throughput times is set to 3 time units as this value resulted in the best performance during preliminary simulation experiments.
2.2 Input Control - Order Release (and Dispatching)
There are many order release methods in the Workload Control literature; for examples, see the reviews by Wisner (1995), Land & Gaalman (1996), Bergamaschi et al. (1997), and Fredendall et al. (2010). In this paper, the LUMS COR (Lancaster University Management School Corrected Order Release) method is used because it was recently shown to be the best order release solution for Workload Control (Thürer et al., 2012). LUMS COR uses a periodic release procedure executed at fixed intervals to control and balance the shop floor workload. This procedure keeps the workload R
s
W released to a station s within a pre-established workload norm as follows: (1) All jobs in the set of jobs J in the pre-shop pool are sorted according to highest priority
determined by a pool sequencing rule (as will be described below). (2) The job jJ with the highest priority is considered for release first.
(3) Take Rj to be the ordered set of operations in the routing of job j. If job j’s processing time pij
at the ithoperation in its routing – corrected for station position i – together with the workload
R s
W released to station s (corresponding to operation i) and yet to be completed fits within the
workload norm Ns at this station, that is ij sR s
p
W N
i iRj, then the job is selected for
release. That means it is removed from J and its load contribution is included, i.e.
i p W
WsR : sR ij iRj.
10
(4) If the set of jobs J in the pool contains any jobs that have not yet been considered for release, then return to Step 2 and consider the job with the next highest priority. Otherwise, the release procedure is complete and the selected jobs are released to the shop floor.
A released job contributes to R s
W until its operation at this station is completed. Therefore, the load contribution to a station in LUMS COR is calculated by dividing the processing time of the operation at a station by the station’s position in a job’s routing. This “corrected” aggregate load method (Oosterman et al., 2000) recognizes that a job’s contribution to a station’s direct load is limited to only the proportion of the total time that the job spends on the shop floor that it is actually at the station.
In addition to the above periodic release mechanism, LUMS COR incorporates a continuous
workload trigger. If the load of any station falls to zero, the next job in the pool sequence with that station as the first in its routing is released irrespective of whether this would exceed the workload norms of any station. The continuous trigger avoids premature station idleness (see, e.g. Kanet, 1988; Land & Gaalman, 1998). When the continuous workload trigger releases a job, its workload contribution to a station is calculated using the same corrected aggregate load approach as is used for the periodic release time element of LUMS COR.
11
controlled order release have also been executed, i.e. where jobs are released onto the shop floor immediately upon arrival.
2.2.1 Pool Sequencing Rule
Two pool-sequencing rules are considered in this study: the Planned Release Date (PRD) and Modified Capacity Slack (MODCS) rules. PRD sequences jobs according to planned release dates. The planned release date of a job is given by its due date minus a constant allowance for the operation throughput time for each operation in its routing. The constant allowance of the operation throughput time has been set to 5 time units since this value resulted in the best overall performance in preliminary simulation experiments. MODCS, as introduced by Thürer et al. (2015), uses: (i) a load-oriented Capacity Slack CORrected (CSCOR – as described below) element to speed up production when multiple jobs become urgent; and, (ii) a time-oriented PRD element to ensure non-urgent jobs are released so the mix of released jobs can be produced on time. MODCS can be summarized as follows:
(i) Jobs are divided into two classes: urgent jobs, i.e. jobs with a planned release date that falls within the next release period or has already passed; and non-urgent jobs. Urgent jobs will always receive priority over non-urgent jobs.
(ii)Within the class of urgent jobs, jobs are sequenced according to the CSCOR rule.
(iii)Then, within the class of non-urgent jobs, jobs are sequenced according to the PRD rule.
12
available for orders in the pool to fill); and, (iii) the routing lengthnj, i.e. the number of operations
in the routing of a job j, which is used to average the ratio between the load contribution and load gap elements over all operations in the routing of the job. The lower the capacity slack ratio (Sj) of job j, the higher the priority of the job. Note that the same rule – but based on an uncorrected measure for calculating the load contribution and load gap elements – was originally proposed by Philipoom et al. (1993).
j
ij
R i R s s
j j p i N W S n
(2)Finally, the capacity slack ratio could become negative due to the continuous starvation trigger incorporated in LUMS COR. This could result in the sequencing rule prioritizing a job that contributes to the workload of an already overloaded station. Therefore, if the workload of a station is equal to or exceeds the workload norm, that isNs WsR0, then the job is positioned at the
back of the queue by replacing the component
ij R s s p i N W
related to this station in the priority
value Sjby M i pij
, where M is a sufficiently large number.
2.2.2 Priority Dispatching
13
that capacity control takes place, i.e. that capacity is used as planned (Bertrand, 1983a). Therefore, dispatching takes place according to operation due dates, i.e. the job with the earliest operation due date is chosen from the queue in front of a work center.
2.3 Output Control - Capacity Adjustments
The main interest of this study in terms of output control is in the operational impact of capacity adjustments. We are consequently not interested in the specific adjustment mechanisms used (e.g. overtime, outsourcing, etc.) but in the timing of the capacity adjustment, i.e. when and where to adjust capacity. To model a capacity adjustment, we simply decrease the operation processing time by a predetermined percentage.
Several capacity planning techniques exist; for a review, the reader is referred to Wortmann et al. (1996). In this study, we use the procedure outlined by Land et al. (2015) where capacity adjustments are guided by three parameters:
1. The size of the processing time reduction (α);
2. The load threshold that triggers the commencement of a capacity adjustment (β); and,
3. The load threshold signaling that the load has reduced sufficiently to cease the adjustment (γ).
Five different scenarios for the adjustment size α are considered to assess the impact of output control: 0 (i.e. no capacity adjustment), 10, 20, 30, and a 40% adjustment. We only use one level of β (90th percentile) and one level of γ (85th percentile), which is justified by the performance frontier observed in Land et al. (2015).
14
of the planned workload (measured in terms of the corrected load) that emerges without capacity adjustment for each workload norm being considered and for the scenario where all due dates are set externally. The planned workload is the workload in the pool plus the workload released to a station that is not yet completed. The load threshold for each workload norm is derived using a percentile of this distribution. The different levels for β and γ are summarized in Table 1. The same load threshold was applied for all levels of the percentage of due dates set internally. Finally, none of the capacity adjustments in our experiments reduced the overall utilization by more than 0.5 percentage points.
[Take in Table 1]
This section has outlined the Workload Control concept considered and how it will be modeled in the simulations. In the next section we outline the characteristics of the pure job shop in which the performance of our Workload Control concept will be assessed.
3. Simulation Model
The shop and job characteristics modeled in the simulations are first outlined in Section 3.1 before Section 3.2 summarizes the experimental design and the measures used to evaluate performance.
3.1 Overview of Modeled Shop and Job Characteristics
15
length of jobs varies uniformly from one to six operations. All stations have an equal probability of being visited and a particular station is required at most once in the routing of a job. Operation processing times follow a truncated 2-Erlang distribution with a mean of 1 time unit after truncation and a maximum of 4 time units. The inter-arrival time of jobs follows an exponential distribution with a mean of 0.648, which – based on the average number of stations in the routing of a job – deliberately results in a utilization of 90%. While any individual job shop in practice will differ in many aspects from this stylized environment, it captures the typical job shop characteristics of high routing variability, processing time variability, and arrival variability.
3.2 Experimental Design and Performance Measures
The experimental factors are: (i) the five levels of the percentage of due dates set internally by the due date setting rule (100%, 75%, 50%, 25%, and 0%); (ii) the eleven levels of the workload norm for LUMS COR (from 4 to 14 time units); (iii) the two pool sequencing rules (PRD and MODCS); and, (iv) the five levels of capacity adjustment reflected by α.
A full factorial design was used with 550 (5x11x2x5) scenarios, where each scenario was replicated 100 times. Results were collected over 10,000 time units following a warm-up period of 3,000 time units. Since we focus on a make-to-order job shop, our main performance indicator will be delivery performance. Delivery performance will be measured by: the percentage tardy – i.e. the percentage of jobs completed after the due date; and, the mean tardiness, that is
) , 0
max( j
j L
16
capabilities of a production control method will manifest itself in shorter total throughput times, i.e. lead times, rather than increased throughput. As an instrumental performance variable, the average shop floor throughput time is also evaluated. While the lead time includes the time that an order waits before being released, the shop floor throughput time only measures the time after an order has been released to the shop floor. By Little’s law, the average shop floor throughput time is directly related to the average level of work-in-process on the shop floor.
4. Results
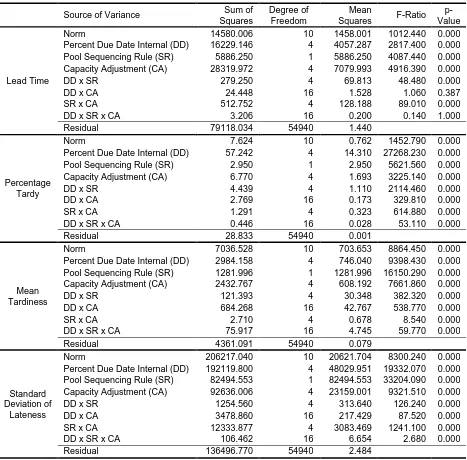
Statistical analysis has been conducted by applying ANOVA to obtain a first indication of the relative impact of the experimental factors. ANOVA is here based on a block design, which is typically used to account for known sources of variation in an experiment. In our ANOVA, we treat the workload limit as the blocking factor. The results are summarized in Table 2. All main effects and most two-way and three-way interactions were shown to be statistically significant. Detailed performance results will be presented and discussed next in Section 4.1 – first for each control function in isolation, followed by the results for pairs of functions, and finally for the combination of all three functions together. Section 4.2 then discusses the relationship between the control functions and the throughput and timing performance objectives.
[Take in Table 2]
4.1 Performance Assessment
17
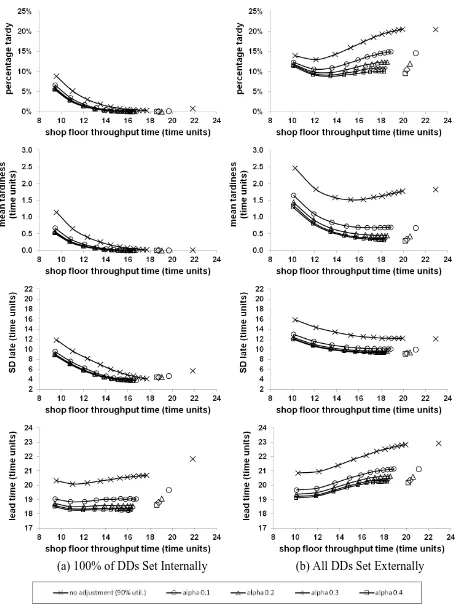
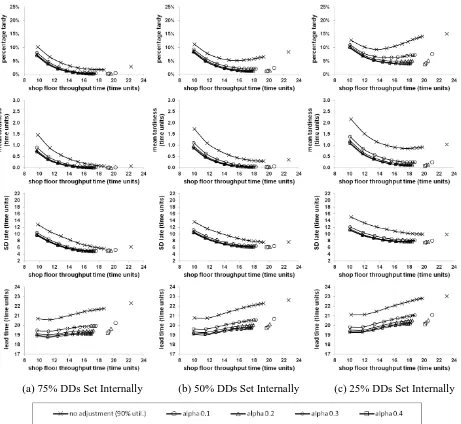
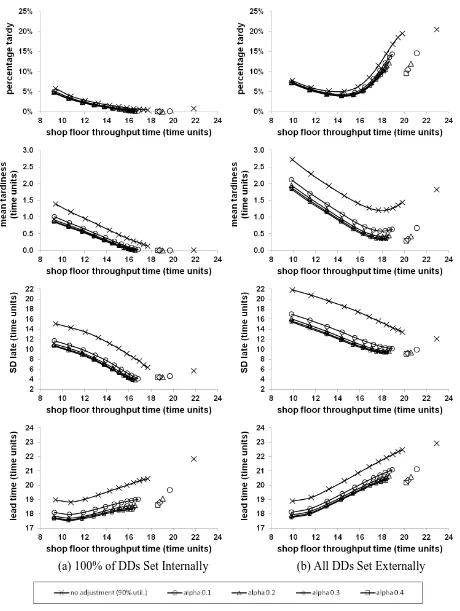
externally, i.e. the due date setting rule is not active (Figure 1b). Only the results for PRD pool sequencing are presented in Figure 1, with the impact of the MODCS pool sequencing rule discussed in Section 4.2 below. Meanwhile, results for the intermediate settings of the percentage of due dates set internally are presented in Figure 2a (75%), Figure 2b (50%), and Figure 2c (25%). The results are presented in the form of performance curves, where the left-hand starting point of the curves represents the tightest workload norm of 4 time units. The workload norm increases step-wise by moving from left to right in each graph, with each data point representing one workload norm (from 4 to 14 time units). Loosening the norms (towards a norm of 14 time units) increases the workload on the shop floor and, as a result, the throughput time on the shop floor. In addition, the results obtained when jobs are released immediately are also included. These results are given by the single point towards the right-hand side of each figure and represent the outcome when no order release control is applied, i.e. immediate release.
[Take in Figure 1 & Figure 2]
In terms of the main effects, the following can be observed from the results:
Due Date Setting in Isolation: This can be observed from the results for immediate release with no capacity adjustments (i.e. the single point towards the right-hand side) in Figure 1 and Figure 2. From the figures, we can observe a strong reduction in the percentage tardy, mean tardiness, and the standard deviation of lateness when due dates are set internally.
18
in the lead time, i.e. a throughput improvement, since the standard deviation is either maintained or it increases.
Capacity Adjustments in Isolation: This can be observed from the results for immediate release (the single point towards the right-hand side) and all due dates set externally by the customer (Figure 1b). We observe a strong improvement in all performance measures when capacity adjustments can be made.
Due date setting and capacity adjustments both improve delivery performance; the former through improved timing and the latter through improved throughput. This can be explained by the strong correlation between high load periods (when capacity adjustments are triggered) and tardiness (Land et al., 2015). In fact, if there is an overload, management may either increase the lead time allowance or increase capacity, i.e. both functions can improve delivery reliability at the moment when this is required by the high load. Order release has a weaker impact since its load balancing mechanism neglects the workload situation. While a larger set of available orders in the pool makes more effective load balancing more likely, this effect is weaker compared to capacity adjustments. The effectiveness of load balancing can be seen from the lead time reductions. But the main role of controlled order release is to shift work from the shop floor to the pre-shop pool, which results in shorter shop floor throughput times, better prioritizations, and a leaner shop floor.
If we look at the performance impact of combining two of the three production control functions, the following can be observed:
19
performance in combination with a strong reduction in shop floor throughput times. The impact of the order release function is stronger when not all due dates are set internally (i.e. Figure 1b and Figure 2a-2c).
Due Date Setting and Capacity Adjustments: This can be observed from the results for immediate release, i.e. the four single points towards the right-hand side in all figures, with the differences between points within a given figure demonstrating the influence of capacity adjustments and the differences between figures demonstrating the influence of due date setting. Both control functions impact on all performance measures and are highly complementary. Due date setting especially improves the standard deviation of lateness while the main effect of capacity adjustments is on reducing the lead time. Together, they strongly reduce the percentage tardy and the average tardiness. In the absence of any order release control, all improvements take place at high shop floor throughput times, i.e. at a high level of work-in-process.
Order Release and Capacity Adjustments: This can be observed from the curves where all due dates are set externally by the customer (Figure 1b). Both functions support each other in reducing lead times. Order release allows this improvement to be combined with a strong reduction in shop floor throughput times, i.e. work-in-process. However, the detrimental effect of the order release function on the standard deviation of lateness and on the average tardiness limits the reduction in percentage tardy when the two functions are combined. To ensure the lowest percentage tardy when capacity adjustments are possible, order release should only be used to enable a relatively small reduction in work-in-process.
20
internally). It can be concluded from the figures that the best performance is in fact realized by combining all three control functions. This can be seen from observing the lowest points across all curves. However, if both the due date setting and capacity adjustment functions can be executed to an intensive degree, order release can only be used to achieve a limited reduction in work-in-process, as represented by the shop floor throughput time. Strong reductions in work-in-process would be to the detriment of other performance measures. Hence, workload norms have to be calibrated in combination with the use of the other control functions.
Finally, similar conclusions on the impact of order release control (as under PRD pool sequencing) can be obtained for order release under MODCS sequencing. This can be observed from Figure 3a and Figure 3b, which provide the results for the same scenarios as in Figure 1 but under MODCS pool sequencing. However, compared to PRD pool sequencing, a much stronger reduction in the percentage of tardy jobs can be observed for MODCS. Meanwhile, the performance differences between the different levels of the capacity adjustment diminish. As an exception, the standard deviation of lateness does not improve, and this can be explained by the creation of SPT effects through the use of the MODCS sequencing rule.
[Take in Figure 2]
4.2. Discussion of Results: Throughput Improvements and Timing Performance
In terms of our two performance objectives – throughput improvement, which aims to reduce average lateness, and timing, which aims to reduce the dispersion of lateness – the following can be observed from the results:
21
share of the shop floor throughput time while capacity adjustments directly affect the total lead time. We can also observe a reduction in the lead time and shop floor throughput time for due date setting. This reduction can however be explained by SPT effects, which are created as part of the forward loading procedure since operations with short processing times find it easier to fit within the capacity norm (Thürer et al., 2013).
Timing Performance: Results confirm that due date setting has the strongest impact on the standard deviation of lateness. But order release and output control (capacity adjustments) may also positively impact this performance measure. Order release may have a positive impact through its PRD pool sequencing rule, which considers the urgency of jobs; and output control improves performance since the periods of high load are also the periods during which orders are at the highest risk of becoming tardy.
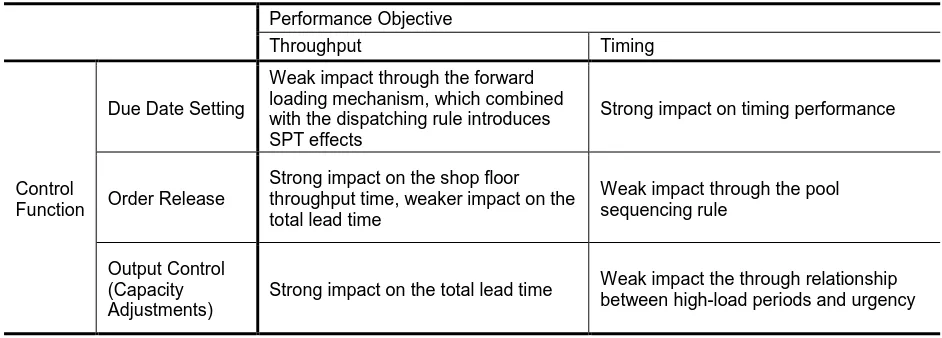
Table 3 summarizes our findings on the link between the three control functions and the two key performance objectives. Our results confirm Kingsman et al. (1989) in the sense that input/output control has a bias towards load balancing, although it also realizes good delivery performance in contexts where the urgency of orders and the size of the workload are highly correlated. We therefore agree with Kingsman et al. (1989) that input/output control should be enhanced by a customer enquiry stage where due dates or delivery lead times (and prices) are quoted, especially in make-to-order contexts where due dates are negotiable. Further, if due dates are fully under the control of the company then using an effective due date setting rule is likely to have a stronger impact on delivery performance than input/output control.
22 5. Conclusions
Workload Control is a production planning and control concept that was developed for high-variety contexts. A unifying principle of Workload Control methods is input/output control whereby input control, such as in the form of an order release mechanism, is used to regulate the work that can enter the shop and/or shop floor; and output control, such as in the form of capacity adjustments, is used to regulate the outflow of work. It has however been argued in the literature that input/output control overemphasizes throughput improvements to the detriment of the timing performance objective; and that input/output control should therefore be enhanced by a customer enquiry stage where due dates are quoted. Yet, although a broad literature on due date setting, order release, and output control exists, literature on the combined effect of the three control functions is limited.
23
The managerial implications of our findings will be discussed next before the paper closes with its limitations and proposed future research directions.
5.1 Managerial Implications
Our results have demonstrated that the best performance can be achieved by combining the three control functions; but a significant investment may be necessary in order to successfully implement all three functions together. Moreover, in practice each shop is likely to require a different balance between throughput and timing improvements to eventually improve delivery reliability. So a trade-off may have to be made between the degree to which a control function is implemented in line with the costs, additional complexity, and required performance improvement. The required performance improvement can be identified using, for example, the diagnosis framework outlined in Soepenberg et al. (2008, 2012). Our study indicates the control function to use in order to best achieve this performance improvement. We saw that each of the three control functions has a major impact on a specific performance measure:
1. Due date setting on the standard deviation of lateness;
2. Order release (input control) on the shop floor throughput time or level of work-in-process; and, 3. Capacity adjustments (output control) on the lead time.
24
5.2 Limitations and Future Research
A shortcoming of our study is the limited environmental setting. While this is justified by the need to keep this study focused, future research is required to assess the impact of environmental factors such as the routing direction or level of processing time variability on performance. Similarly, we have only used one production control system, i.e. Workload Control. While this is justified by the job shop model applied in this study, future research could explore the impact of other production control systems on throughput and timing performance. This includes the development of control systems that integrate the two different performance objectives into one control decision.
References
Ahmed, I., and Fisher, W.W., 1992, Due date assignment, job order release and sequencing interaction in job shop scheduling, Decision Sciences, 23, 633-647.
Bechte, W., 1994, Load-oriented manufacturing control just-in-time production for job shops,
Production Planning &Control, 5, 3, 292 – 307.
Bergamaschi, D., Cigolini, R., Perona, M., and Portioli, A., 1997, Order review and release strategies in a job shop environment: A review and a classification, International Journal of Production Research, 35, 2, 399-420.
Bertrand, J.W.M, 1983a, The use of workload information to control job lateness in controlled and uncontrolled release production systems, Journal of Operations Management, 3, 2, 79-92. Bertrand, J.W.M, 1983b, The effect of workload dependent due-dates on job-shop performance,
Management Science, 29, 7, 799-816.
25
Conway, R., Maxwell, W.L., and Miller, L.W., 1967, Theory of Scheduling, Reading, MA: Addisson-Wesley.
Cheng, T.C.E., and Gupta, M.C., 1989, Survey of scheduling research involving due date determination decisions, European Journal of Operational Research, 38, 156-166.
Enns, S.T., 1995a, An integrated system for controlling shop loading and work flow, International Journal of Production Research, 33, 10, 2801-2820.
Enns, S. T., 1995b, A dynamic forecasting model for job shop flow time prediction and tardiness control, International Journal Production Research, 33, 5, 1295-1312.
Fredendall, L.D., Ojha, D., and Patterson, J.W., 2010, Concerning the theory of workload control,
European Journal of Operational Research, 201, 1, 99-111.
Hendry, L.C., Huang, Y., and Stevenson, M., 2013, Workload control: Successful implementation taking a contingency-based view of production planning & control, International Journal of Operations & Production Management, 33, 1, 69-103.
Hendry, L. C., Kingsman, B. G., and Cheung, P., 1998, The effect of workload control (WLC) on performance in make-to-order companies, Journal of Operations Management, 16, 1, 63-75. Hopp, W.J., and Sturgis, M.L.R., 2000, Quoting manufacturing due dates subject to a service level
constraint, IIE Transactions, 32, 771-784.
Kanet, J.J., 1988, Load-limited order release in job shop scheduling systems, Journal of Operations Management, 7, 3, 44-58.
26
Kingsman, B.G., Tatsiopoulos, I.P., and Hendry, L.C., 1989, A Structural Methodology for Managing Manufacturing Lead Times in Make-to-Order Companies, European Journal of Operational Research, 40, 196–209.
Land, M.J., 2006, Parameters and sensitivity in workload control, International Journal of Production Economics, 104, 2, 625-638.
Land, M.J., 2009, Cobacabana (control of balance by card-based navigation): A card-based system for job shop control, International Journal of Production Economics, 117, 97-103
Land, M.J., and Gaalman, G.J.C, 1996, Workload control concepts in job shops: A critical assessment, International Journal of Production Economics, 46-47, 535-538.
Land, M.J., and Gaalman, G.J.C., 1998, The performance of workload control concepts in job shops: Improving the release method, International Journal of Production Economics, 56-57, 347-364.
Land, M.J., Stevenson, M., Thürer, M., and Gaalman, G.J.C., 2015; Job Shop Control: In Search of the Key to Delivery Improvements, International Journal of Production Economics, 168, 257-266.
Little, J., 1961, A proof of the theorem L = λW, Operations Research, 8, 383-387.
Melnyk, S.A., and Ragatz, G.L., 1989, Order review/release: research issues and perspectives,
International Journal of Production Research, 27, 7, 1081-1096.
Moses, S., Grant, H., Gruenwald, L., and Pulat, S., 2004, Real-time due-date promising by build-to-order environments, International Journal of Production Research, 42-20, 4353-4375. Nyhuis, P., and Wiendahl, H.P., 2009, Fundamentals of Production Logistics: Theory, Tools and
27
Oosterman, B., Land, M.J., and Gaalman, G., 2000, The influence of shop characteristics on workload control, International Journal of Production Economics, 68, 1, 107-119.
Philipoom, P.R., Malhotra, M.K., and Jensen, J.B., 1993, An evaluation of capacity sensitive order review and release procedures in job shops, Decision Sciences, 24, 6, 1109-1133.
Plossl, G.W., and Wight, O.W., 1971, Capacity planning and control, Working paper presented at the APICS International Conference in St.Louis, Missouri.
Ragatz, G.L., and Mabert, V.A., 1984, A Simulation Analysis of Due Date Assignment Rules,
Journal of Operations Management, 5, 1, 27-39.
Silva, C., Stevenson, M., and Thürer, M., 2015, A Case Study of the Successful Implementation of Workload Control: A Practitioner-led Approach, Journal of Manufacturing Technology Management, 26, 2, 280-296.
Soepenberg, G.D., Land, M.J., and Gaalman, G.J.C., 2008, The order progress diagram: A supportive tool for diagnosing delivery reliability performance in make-to-order companies,
International Journal of Production Economics, 112, 495-503.
Soepenberg, G.D., Land, M.J., and Gaalman, G.J.C., 2012, A framework for diagnosing the delivery reliability performance of make-to-order companies, International Journal of Production Research, 50, 19, 5491-5507
Stevenson, M., Hendry, L.C., and Kingsman, B.G., 2005, A review of production planning and control: The applicability of key concepts to the make to order industry, International Journal of Production Research, 43, 5, 869-898.
28
Thürer, M., Stevenson, M., Silva, C., Land, M.J., and Fredendall, L.D., 2012, Workload control (WLC) and order release: A lean solution for make-to-order companies, Production & Operations Management, 21, 5, 939-953.
Thürer, M., Stevenson, M., Silva, C., & Land, M.J., 2013, Towards an integrated Workload Control (WLC) concept: The performance of due date setting rules in job shops with contingent orders, International Journal of Production Research, 51, 15, 4502-4516.
Thürer, M., Stevenson, M., Silva, C., Land, M.J., Fredendall, L.D., and Melnyk, S.A., 2014, Lean control for make-to-order companies: Integrating customer enquiry management and order release, Production & Operations Management, 23, 3, 463-476.
Thürer, M., Land, M.J., Stevenson, M., Fredendall, L.D., and Godinho Filho, M., 2015, Concerning Workload Control and Order Release: The Pre-Shop Pool Sequencing Decision,
Production & Operations Management, 24, 7, 1179–1192.
Thürer, M., Stevenson, M. and Land, M.J., 2016, On the Integration of Input and Output Control: Workload Control Order Release, International Journal of Production Economics; 174, 43-53. Vig, M.M., and Dooley, K.J., 1993, Mixing static and dynamic flow time estimates for due-date
assignment, Journal of Operations Management, 11, 67-79.
Weeks, J.K., 1979, A Simulation Study of Predictable Due Dates, Management Science, 25, 4, 363-373.
Wiendahl, H.P., Gläßner, J., and Petermann, D., 1992, Application of load-oriented manufacturing control in industry, Production Planning & Control, 3, 2, 118 – 129.
29
Wisner, J. D., 1995, A review of the order release policy research, International Journal of Operations & Production Management, 15, 6, 25-40.
Wortman, J.C., Euwe, M.J., Taal, M., and Wiers, V.C.S., 1996, A review of capacity planning techniques within standard software packages, Production Planning & Control, 7, 2, 117-128. Zäpfel, G. and Missbauer, H., 1993, New concepts for production planning and control, European
30
Table 1: Summary of the Corrected Planned Workload Thresholds used in the Simulations
Norm 4 Norm 5 Norm 6 Norm 7 Norm 8 Norm 9 Norm 10 Norm 11 Norm 12 Norm 13 Norm
14 IMM
PRD β 23.64 22.16 21.01 20.23 19.65 19.24 18.93 18.72 18.59 18.48 18.43 18.93
γ 20.46 19.19 18.24 17.58 17.1 16.79 16.54 16.38 16.28 16.21 16.16 16.54
MODCS β 24.11 23.19 22.44 21.72 21.14 20.65 20.22 19.72 19.39 19.11 18.84 20.22
γ 20.73 19.88 19.16 18.55 18.04 17.62 17.29 16.92 16.69 16.52 16.35 17.29
Table 2: ANOVA Results
Source of Variance Sum of
Squares
Degree of Freedom
Mean
Squares F-Ratio
p-Value
Lead Time
Norm 14580.006 10 1458.001 1012.440 0.000
Percent Due Date Internal (DD) 16229.146 4 4057.287 2817.400 0.000
Pool Sequencing Rule (SR) 5886.250 1 5886.250 4087.440 0.000
Capacity Adjustment (CA) 28319.972 4 7079.993 4916.390 0.000
DD x SR 279.250 4 69.813 48.480 0.000
DD x CA 24.448 16 1.528 1.060 0.387
SR x CA 512.752 4 128.188 89.010 0.000
DD x SR x CA 3.206 16 0.200 0.140 1.000
Residual 79118.034 54940 1.440
Percentage Tardy
Norm 7.624 10 0.762 1452.790 0.000
Percent Due Date Internal (DD) 57.242 4 14.310 27268.230 0.000
Pool Sequencing Rule (SR) 2.950 1 2.950 5621.560 0.000
Capacity Adjustment (CA) 6.770 4 1.693 3225.140 0.000
DD x SR 4.439 4 1.110 2114.460 0.000
DD x CA 2.769 16 0.173 329.810 0.000
SR x CA 1.291 4 0.323 614.880 0.000
DD x SR x CA 0.446 16 0.028 53.110 0.000
Residual 28.833 54940 0.001
Mean Tardiness
Norm 7036.528 10 703.653 8864.450 0.000
Percent Due Date Internal (DD) 2984.158 4 746.040 9398.430 0.000
Pool Sequencing Rule (SR) 1281.996 1 1281.996 16150.290 0.000
Capacity Adjustment (CA) 2432.767 4 608.192 7661.860 0.000
DD x SR 121.393 4 30.348 382.320 0.000
DD x CA 684.268 16 42.767 538.770 0.000
SR x CA 2.710 4 0.678 8.540 0.000
DD x SR x CA 75.917 16 4.745 59.770 0.000
Residual 4361.091 54940 0.079
Standard Deviation of
Lateness
Norm 206217.040 10 20621.704 8300.240 0.000
Percent Due Date Internal (DD) 192119.800 4 48029.951 19332.070 0.000
Pool Sequencing Rule (SR) 82494.553 1 82494.553 33204.090 0.000
Capacity Adjustment (CA) 92636.006 4 23159.001 9321.510 0.000
DD x SR 1254.560 4 313.640 126.240 0.000
DD x CA 3478.860 16 217.429 87.520 0.000
SR x CA 12333.877 4 3083.469 1241.100 0.000
DD x SR x CA 106.462 16 6.654 2.680 0.000
[image:30.612.74.541.241.701.2]31
Table 3: Link between Control Functions and Performance Objectives
Performance Objective
Throughput Timing
Control Function
Due Date Setting
Weak impact through the forward loading mechanism, which combined with the dispatching rule introduces SPT effects
Strong impact on timing performance
Order Release
Strong impact on the shop floor throughput time, weaker impact on the total lead time
Weak impact through the pool sequencing rule
Output Control (Capacity Adjustments)
Strong impact on the total lead time Weak impact the through relationship
32
[image:32.612.78.540.68.678.2](a) 100% of DDs Set Internally (b) All DDs Set Externally
Figure 1: Performance Comparison for PRD Pool Sequencing:
33
[image:33.612.78.539.70.494.2](a) 75% DDs Set Internally (b) 50% DDs Set Internally (c) 25% DDs Set Internally
34
[image:34.612.77.537.68.679.2](a) 100% of DDs Set Internally (b) All DDs Set Externally