ISSN Online: 2169-2688 ISSN Print: 2169-267X
DOI: 10.4236/ars.2018.72007 Jun. 22, 2018 91 Advances in Remote Sensing
Multispectral Image Processing System
Developed in CARTOMORPH
Software—NDVI Module
Tiago Oyan Aguiar, Samara Calçado de Azevedo, Miriam Maria Pedrosa, Guilherme Pina Cardim,
Erivaldo Antonio da Silva
Department of Cartography, São Paulo State University (UNESP), Presidente Prudente, Brazil
Abstract
In this paper, we have evaluated the multispectral module implemented in the CARTOMORPH software, which is a public domain software under devel-opment by the mathematical morphology research group at FCT/UNESP. The aim of CARTOMORPH is to provide an open software with feature extraction methods and a library that contains a variety of implemented code (functions) that can be easily operated by users through graphical interface. The multis-pectral image processing system has been developed to allow feature discrim-ination by operations between bands from Remote Sensing images. The nor-malized difference vegetation index (NDVI) was selected to be implemented on CARTOMORPH because of its acknowledged performance for monitoring of vegetation and cartographic applications. The experiments were applied to multispectral bands from Quick Bird image and the results were compared with those provided by the SPRING and ENVI software. Former is a Brazilian free software, developed by National Institute for Space Research-INPE and dedi-cated to image processing and Geographic Information Systems (GIS) analysis, as well as ENVI, which is a traditional remote sensing image analysis system. The results prove that the implementation of this module is correct, allowing potential usage in the field of cartography and for environmental applications.
Keywords
NDVI, CARTOMORPH, Quick Bird, Remote Sensing
1. Introduction
The society’s demand for up-to-date surface information has been steadily in-How to cite this paper: Aguiar, T.O., de
Azevedo, S.C., Pedrosa, M.M., Cardim, G.P. and da Silva, E.A. (2018) Multispectral Image Processing System Developed in CARTOMORPH Software—NDVI Module. Advances in Remote Sensing, 7, 91-100. https://doi.org/10.4236/ars.2018.72007
Received: April 3, 2018 Accepted: June 19, 2018 Published: June 22, 2018
Copyright © 2018 by authors and Scientific Research Publishing Inc. This work is licensed under the Creative Commons Attribution International License (CC BY 4.0).
DOI: 10.4236/ars.2018.72007 92 Advances in Remote Sensing creasing and has a direct contribution to continuous technological progress in the production of maps. In the Brazilian context, as well as in other countries of continental scale, reliable alternatives to deal with cartographic updating are needed in order to obtain consistent and economically viable cartographic data-bases. One of the possible solutions employed to solve this ongoing problem has been data integration from remote sensing (RS) with digital image processing (DIP) techniques [1].
RS imagery are timely and cost-effective data which plays a significant role in a wide range of real-world applications, such as natural disasters assessment [2], vegetation monitoring [3] and climate change understanding [4]. The develop-ments of sensors and imagery have required improvedevelop-ments in computer soft-ware and hardsoft-ware to handle with data complexity. Besides the increased availa-bility of spatial details, new challenges were imposed to the traditional RS me-thods which are a core research topic to be pursued [5].
For this reason, the Mathematical Morphology (MM) research group at the FCT/UNESP, Presidente Prudente has developed a software named CARTOMORPH. CARTOMORPH is a public domain software and it is available with open source, allowing anyone to obtain efficient results for various applications within digital image processing [6].
One of the proposals of CARTOMORPH software is to establish functions that produce results consistent with commercials software currently available. Some routines and functions for features extraction based on morphological processing are already available in its library. However, most of these routines enable operations with individual monochromatic images. This can restrict many analysis techniques, since spectral properties permit that different types of target, such as vegetation species, soil, crop or rock types, can be distinguished from their spectral signatures on multispectral images [7].
The development of the CARTOMORPH multispectral module is clearly ne-cessary to provide reliable identification of particular targets on remotely sensed images. This paper presents the results obtained in the processing module de-veloped and implemented in CARTOMORPH. At this stage, NDVI spectral ra-tioning was selected for deployment, because of its valuable contribution in monitoring vegetation and environmental studies of indicators of vegetation health or productivity [8] [9]. Additionally, the cartographic research field also takes advantage of the spectral ratio, since topographic effects and variations in scene illumination are reduced, and the resulting image better reflects real cha-racteristics of the surface [7].
anal-DOI: 10.4236/ars.2018.72007 93 Advances in Remote Sensing ysis system in the cartography context. The comparison of the outcomes allows information to be gained about the efficiency and agreement of both software’s, in order to verify CARTOMORPH’s performance and its ability to provide relia-ble results.
2. Literature Review
Operations between bands from RS images are simple spectral transformations of two or more bands, designed to enhance or to characterize targets present on the surface. The process consists of bringing up certain aspects of different Earth surface cover types based on the behaviour of its spectral reflectance. Image divi-sion or Spectral Rationing, for example, involves dividing two different spectral bands in order to enhance variations of the spectral reflectance curves and high-light suitable variations in the spectral responses of various surface targets [1].
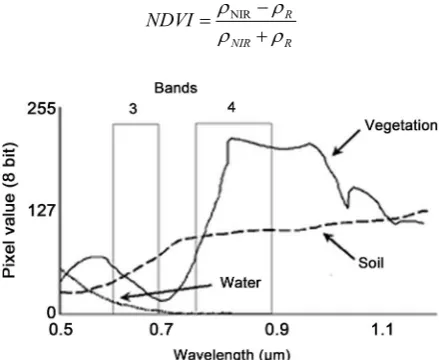
One of the earliest known spectral ratios used in RS applications, being able to highlight dense vegetation cover, is called the vegetation index. Figure 1 presents the vegetation spectral reflectance curve to illustrate the practical con-cept of the index, where two more reflectance spectra (water and soil) are also illustrated. The differences between the curves can easily be seen, mainly due to slope between the red and the near-infrared bands, for example bands 3 (red) and 4 (near-infrared) in a Landsat ETM + image, as also stated on Figure 1.
In the vegetation spectrum, the main feature absorption is in the visible red waveband (centred on 650 nm), and reflects strongly in the near infrared, where the wavelength from 760 nm to 900 nm is situated [10]. Chlorophyll pigments in the leaves, which are photosynthetically active, absorb incident energy, being in-dicative of healthy vegetation, and cause the absorption effect.
Therefore, the Normalized Difference Vegetation Index (NDVI) exploits this spectral vegetation behaviour, using the ratio between the near infrared and red band, as showed by Equation (1).
NIR R
NIR R
[image:3.595.262.482.501.681.2]NDVI= ρρ −ρρ +
Figure 1. The reflectance curve from targets shows high slope between the red and near
DOI: 10.4236/ars.2018.72007 94 Advances in Remote Sensing Results obtained from NDVI is known to range between ±1, where generally the higher pixels values are correlated with vegetation cover, density and vigour. Pixels from other targets, such as water, result in values less than or equal to 0, while the soil gives values less than or equal to 0.5. NDVI is computed as float-ing-point values, which can be resampled to integer values for display purposes, for example a monochromatic image on the range 0 - 255.
The ability of NDVI to highlight vegetation properties through remotely sensed images has been a key for assessing and managing natural resources. The main advantage is the capacity of RS offer systematic data over large areas, which goes beyond traditional methods [11]. Therefore, NDVI allows global ve-getation studies and monitoring seasonal and inter-annual of veve-getation pheno-logical, and biophysical parameters, which are essential to better understanding the land cover and associated changes [12].
More recently, new indices based on NDVI has been created to overcome problems in dense forest canopies as well as seen new functionalities allowed by recent multispectral sensors [13]. Thus, the continuous development of various spectral indices for the rapid and accurate classification of land use and land cover imposes the development of algorithms and software, such CARTOMORPH, that are able to deal with this data.
3. Study Area and Data Sources
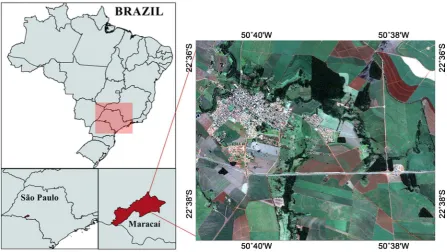
The experiments were carried out on QuickBird (QB) image of April 2009 from Maracaí city, located in São Paulo State. The multispectral imagery used in the application of NDVI was red (R) and near infrared (NIR) bands with 2.7 m of spatial resolution. Figure 2 shows the geographical location of the study site inside of Brazil, with false color composite RGB-432 to better illustrate existing vegetation in this area.
As can be seen in Figure 2, the study area contains few urban segments represented in cyan colour (such as streets, commercial and residential build-ings), bare soil in green and small area of water body showed in dark green. The most of the land cover is occupied by vegetation as grassland and sugarcane cul-tivation, represented by several tones of red. The presence of dense vegetation can also be seen in dark red. The high spatial resolution of QB image enhances surrounding targets identification and, as we can see, the scene have no cloud contamination, which is essential to achieve better NDVI results.
4. Methodology
DOI: 10.4236/ars.2018.72007 95 Advances in Remote Sensing
Figure 2. The geographical location of the study area and QB false color composite used to the application of NDVI.
In this study, we focused on verifying the correct implementation of cmNDVI. Thus, the experiments were carried out in digital values, and the dynamic range of the QB image was resampled to 8 bits, since CARTOMORPH is currently op-erating with this data.
The next step in the implementation, was the processing of the images by CARTOMORPH software. Depending on the applied operation, there may be loss of information when the new values exceed the range of digital numbers or result in fractional numbers. For example, an 8 bits image, after processing op-eration, for values that fall below 0 will be defined as 0. On the other hand, any value greater than 255 is shifted to 255, which is required to maintain the dy-namic range purpose at 8 bits of radiometric resolution. Typically, in the band rationing process, a reducing of digital values happens to very small values. It is therefore necessary to consider parameters of gain (multipliers) and an offset (additive), as shown in Equation (2). Thus, the cmNDVI algorithm was based and applied following Equation (2).
NIR R
NIR R
cmNDVI Gain= ∗ρρ −ρρ +Offset
+
Finally, we performed a comparative analysis between results from cmNDVI
and the outcome of NDVI from SPRING and ENVI software. The last two soft-ware were used as a mathematical proof to verify whether the cmNDVI was im-plemented properly and to determine whether the results are coherent.
5. Presentation and Results Analysis
DOI: 10.4236/ars.2018.72007 96 Advances in Remote Sensing combinations between spectral bands to acquire information from images. Ve-getation indices, as NDVI, is one example of success in this sense, and has con-tributed to several applications such as monitoring vegetation cover and assess-ing ecosystem changes [14]. Therefore, the implementation of cmNDVI enables CARTOMORPH to be placed in the free image processing software context.
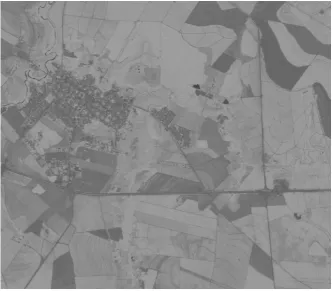
The results obtained with the cmNDVI algorithm for the whole image of the study area are shown in Figure 3. In order to provide better visualization, the output values were scaled to the range 0 - 255 through gain and offset parame-ters, defined empirically as being 80 and 100, respectively. This setting applied resulted in a monochromatic image within the range [20, 180].
It can be seen from the monochromatic image, when compared with the original false color composite (Figure 2), that vegetation regions are represented by brighter grey pixels. This output was compatible, as discussed by [7], where vegetation regions are represented by higher values due to differences between bands. In the case of absence of vegetation, such as bare soil or water body re-gions, we found mid and darker grey pixels, as well as some areas prepared for planting.
[image:6.595.208.542.412.703.2]Although it is possible to identify features such as road and urban regions in the resulting monochromatic image, we performed a transformation of the dy-namic range into color scale image. Figure 4 represents this color map trans-formation, where we can clearly see targets that do not pose vegetation areas in purple and dense vegetation coverage in dark green. These labels are based on
DOI: 10.4236/ars.2018.72007 97 Advances in Remote Sensing the spectral characteristics of each pixel location.
The SPRING and ENVI software was used for comparison, as mentioned ear-lier, and the results found with NDVI were visually identical. In order to verify the results numerically, the morphological operator mmisequal from SDC In-formation Systems toolbox was used. This operator compares two images pixel by pixel and returns true, if both are equal for all pixels. As visual result, numer-ical comparison also showed equality of results.
Despite visual and numerical results proved to be the same, the green area of three NDVI were calculated. An automatic binarization by [15] method was performed, since the NDVI was able to separate vegetation from others targets of the scene. The binarized images are shown in Figure 5, where dark areas do not correspond to the areas of interest, so the calculation was based on bright areas. Based on the binarized images, the green area values obtained for the three NDVI results are shown in Table 1.
As can see by inspecting results, it was found exactly green area for the three NDVI output. It was therefore possible to verify that results with the cmNDVI
[image:7.595.181.530.379.694.2]operator were appropriate and coherent. It is important to bear in mind that the processing was performed in an equivalent form and was used the same data and parameter of gain and offset. In this way, values achieved by the three software could be mathematically compared and shown to be identically, which confirms
Figure 4. Results from cmNDVI in image’s color map with purple being non-vegetated areas,
DOI: 10.4236/ars.2018.72007 98 Advances in Remote Sensing
Figure 5. Binary images from automatic thresholding process for green area
calcula-tion, where in black are the excluded pixels that do not pose interesting areas: (a) CARTOMORPH results; (b) SPRING results and (c) ENVI results.
Table 1. Comparison of green area estimation for CARTOMORPH, SPRING and ENVI
software.
NDVI Results Green Area (pixels)
CARTOMORPH 3,656,822
SPRING 3,656,822
ENVI 3,656,822
the consistent output and correctness of the cmNDVI algorithm.
6. Conclusions
[image:8.595.206.540.490.560.2]DOI: 10.4236/ars.2018.72007 99 Advances in Remote Sensing We also carried out mathematical evaluation of data, in order to confirm the analyses and results obtained. This evaluation consisted of comparing the
out-come from the cmNDVI algorithm available in the CARTOMORPH software
and the output from the SPRING and ENVI software. It was found no discre-pancies between the three NDVI results, which indicates that the multispectral module of CARTOMORPH software is ready and consistently for operation by users. In addition, the processing of high spectral resolution images should be overcome by CARTOMORPH, since this data provides finer representation within class and it is available nowadays and has been widely employed.
Finally, the importance of vegetation indices, especially NDVI dealt in this study, is already more consolidated and has shown to be a good indicator of ve-getation growth and gives some responses to climate change. Therefore, with freely availability of the multispectral module in CARTOMORPH, new applica-tions may be proposed, allowing quantitatively and qualitatively assessing of forest resources distribution, which will be suitable for cartographic applications and to various other fields.
Acknowledgements
The authors would like to thank FAPESP (Proc. No. 2013/10487-4 and 2013/ 25257-4) for the financial support given to the development of this work.
References
[1] Mather, P.M. (2004) Computer Processing of Remotely-Sensed Images: An Intro-duction. 3rd Edition, John Wiley & Sons, Chichester, 442 p.
[2] Poursanidis, D. and Chrysoulakis, N. (2017) Remote Sensing, Natural Hazards and the Contribution of ESA Sentinels Missions. Remote Sensing Applications: Society and Environment, 6, 25-38. https://doi.org/10.1016/j.rsase.2017.02.001
[3] Schultz, M.G., Clevers, J.G.P.W., Carter, S., Verbesselt, J., Avitabilea, V., Quang, H.V. and Herold, M. (2016) Performance of Vegetation Indices from Landsat Time Series in Deforestation Monitoring. International Journal of Applied Earth Obser-vation and Geoinformation, 52, 318-327. https://doi.org/10.1016/j.jag.2016.06.020
[4] Plummer, S., Lecomte, P. and Doherty, M. (2017) The ESA Climate Change Initia-tive (CCI): A European Contribution to the Generation of the Global Climate Ob-serving System. Remote Sensing of Environment, 203, 2-8.
https://doi.org/10.1016/j.rse.2017.07.014
[5] Zhong, Y., Ma, A., Ong, Y.S. and Zhu, Z. (2018) Computational Intelligence in Optical Remote Sensing Image Processing. Applied Soft Computing, 64, 75-93.
https://doi.org/10.1016/j.asoc.2017.11.045
[6] Cardim, G.P. (2105) Desenvolvimento do sistema computacional CARTOMORPH para processamento de imagens de sensoriamento remoto. Dissertação (mestra-do)-UNESP, Presidente Prudente, 119 p.
[7] Schowengerdt, R.A. (2007) Remote Sensing: Models and Methods for Image Processing. Academic Press, 560 p.
DOI: 10.4236/ars.2018.72007 100 Advances in Remote Sensing Environment, 185, 57-70. https://doi.org/10.1016/j.rse.2015.12.024
[9] Sonawane, K.R. and Bhagat, V.S. (2017) Improved Change Detection of Forests Using Landsat TM and ETM+ Data. Remote Sensing Land, 1, 18-40.
https://doi.org/10.21523/gcj1.17010102
[10] Jensen, J.R. (2004) Introductory Digital Image Processing—A Remote Sensing Perspective. 3rd Edition, Prentice Hall, Upper Saddle River, 544 p.
[11] Xie, Y., Sha, Z. and Yu, M. (2008) Remote Sensing Imagery in Vegetation Mapping: A Review. Journal of Plant Ecology, 1, 9-23. https://doi.org/10.1093/jpe/rtm005
[12] Yin, H., Udelhoven, T., Fensholt, R., Pflugmacher, D. and Hostert, P. (2012) How Normalized Difference Vegetation Index (NDVI) Trends from Advanced Very High Resolution Radiometer (AVHRR) and Système Probatoire d’Observation de la Terre VEGETATION (SPOT VGT) Time Series Differ in Agricultural Areas: An Inner Mongolian Case Study. Remote Sensing, 4, 3364-3389.
https://doi.org/10.3390/rs4113364
[13] Addabbo, P., Focareta, M., Marcuccio, S., Votto, C. and Ullo, S.L. (2016) Contribu-tion of Sentinel-2 Data for ApplicaContribu-tions in VegetaContribu-tion Monitoring. Acta IMEKO, 5, 44-54. https://doi.org/10.21014/acta_imeko.v5i2.352
[14] Ke, Y., Im, J., Lee, J., Going, H. and Ryu, Y. (2015) Characteristics of Landsat 8 OLI-Derived NDVI by Comparison with Multiple Satellite Sensors and In-Situ Ob-servations. Remote Sensing of Environment, 164, 298-313.
https://doi.org/10.1016/j.rse.2015.04.004
[15] Otsu, N. (1979) A Threshold Selection Method from Gray-Level Histograms. IEEE Transactions on Systems, Man and Cybernetics, 9, 62-69.