Classification of AI Powered Social Bots on Twitter by
Sentiment Analysis and Data Mining through SVM
Abu Foysal
Dept. of Computer Science & Engineering
BRAC University Dhaka
Safat Islam
Dept. of Computer Science & Engineering
BRAC University Dhaka
Touhidur Rahaman
Dept. of Computer Science & Engineering
BRAC University Dhaka
ABSTRACT
In this paper, the behavior of twitter bots and their influence on the social media is investigated. As the user population increased on Twitter, it became an ideal platform for social manipulation and influencing perspectives. There has been a rise in autonomous entities, which are known to exploit Twitter’s API feature by performing actions such as tweeting, retweeting, liking, following, or messaging other users, that engage in social engineering. In this research, a framework based on existing research to detect these autonomous entities on Twitter is presented. For detection, tweet syntax analysis, user behavior along with sentiment analysis is performed. Sentiment analysis is an opinion mining technique which analyzes people’s opinions or sentiments. Crawling on Twitter is performed for random tweets, user specific tweets and features are extracted by aggregating the tweets by their senders. Based on the resultant information the human or bot training and classification is made. After successfully training with SVM, this model was able to detect Twitter bots with a precision of 0.75.
Keywords
Twitter, social network, sentiment analysis, machine learning, feature selection.
1.
INTRODUCTION
Social bots are gaining more and more attention very recently due to the eminence and influence of social media networks. As mentioned by Adams [1], it is already recognized that social bots are influencing the sentiments of groups of people. It is very easy for bots to manipulate particular user group to promote their content [2]. The bots were at large during the 2016 U.S. election, deploying some large influential campaigns on Twitter. In his paper, Subrahmanian [3], discusses about the existence of influence bots during Indian election 2014 [4]. Kagan [4] has worked on Twitter bot classification using sentiment analysis technique on both Pakistani election (2013) and Indian election (2014). However, there has not been any such analysis for Twitter bots in Bangladesh. In this paper, a model is proposed to classify bots which uses tweet syntax, user behavior and sentiment analysis as the main approach to extract features. Sentiment analysis is an opinion mining technique which for a given string of text identifies whether the sentiment is more positive, negative or neutral.
2.
RELATED WORKS
Nowadays most people use social networks to communicate with each other and it has a lot of influence in the everyday life [5]. Since it is growing rapidly, a large amount of research is going on about social network’s growth over time and the
influence of social networks on young generation [6]. One of the most popular social networks is Twitter. Twitter allows people to share their thinking and the details of their life with each other whereas celebrities shares their culture and lifestyle with their followers to expand their personal brand [7]. This shows how much a person can influence each other via social network and how this network of different user group can spread information in a very short amount of time [8]. Since, in social network it is easy to manipulate a person, a growing number of organizations are using bot to spread their contents [9]. They are using bots to generate contents more frequently and analyze people’s behavior to spread right content for right user. Detecting these bots can be very difficult since some of them use human intervention to create more realistic content [10]. Although most of the bots share some common features.
While planning and making progress for the paper, many research papers related to twitter bots were reviewed. Krishnamurthy [11], in his paper, classified twitter users into three groups, broadcasters, acquaintances, miscreants and evangelists. He concluded this were based on the number of followers, the number of following or the follower-following ratio respectively. Mislove [12], analyzed the structure of several online social media networks. He discussed that it is typical in online social networks to show mutuality. Yardi [13], also investigated on spammers on twitter and concluded that a high follower to following ratio increases the chances of the account being a spam. Varol [14], extracted 1150 features based on their framework and divided them into six sections. In their research they concluded that user meta-data related features are the most valuable in terms of bot detection and classification. In this model, only ten key features are used to classify bot account rather than a huge set of features used in the previous models. This enables the users to cut short on the time and execution process of extracting extra features.
3.
PROPOSED MODEL
Figure 1: The proposed model for detecting twitter bot.
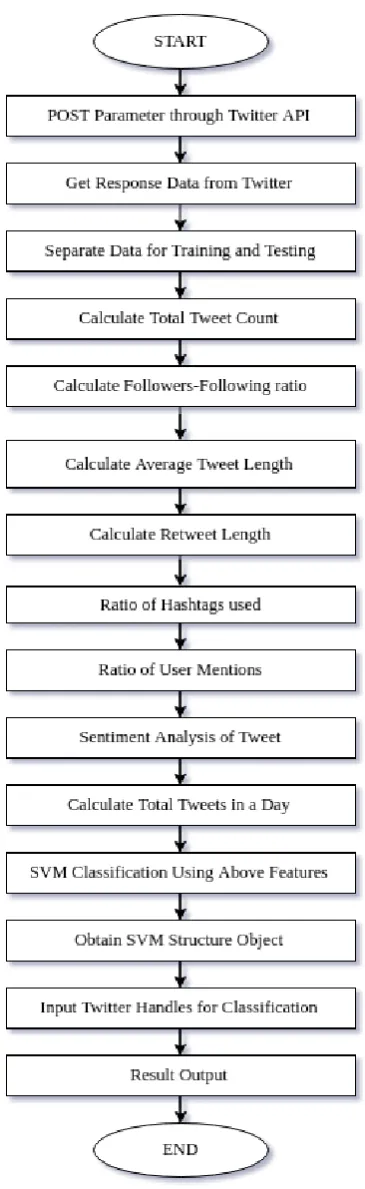
Next, all the tweets are grouped by their twitter handle name and the following features for each twitter account is generated, as shown in Table 1 & Table 2. The user features extracted through the Twitter API are: @handle, total count, followers, following, retweet percentage, hashtags per tweet,
tweets per day and sentiment score.
The handle is the twitter username for the account and is used as display name as well as tagging and mentioning. Total count is total number of tweets the user has tweeted in their lifetime. Followers are the number of users following the given account and following is the total number of accounts, the said account is following. The followers and following numbers are used to calculate the ratio and the correlation between them. Retweet percentage is the percentage the user has retweeted any tweet, in their overall posts. The next feature is the average number of hashtags that has been used in a tweet. The bot accounts have been known to use several hashtags in their tweets to get attention from people. Sometimes, trending hashtags are used in their tweets to get better visibility on Twitter newsfeed. So, this feature is used as a means to detect any abuse of hashtag usage by the user account. Next, the number of tweets per day is extracted from the data for each user. Finally, the raw tweets are collected and sentiment analysis is performed on them to determine the ratio of positive, negative and neutral opinions.
4.
EXPERIMENTAL SETUP AND
RESULT ANALYSIS
The proposed model consists of extracting Twitter user data using programmable spreadsheet tools such as Google Docs, Tags v6.1 [16]. This script uses the Twitter API along with passing a set of parameters, like user handle or hashtags to fetch user metadata. However, directly using Twitter API is also possible but it increases the complexity of the procedure. To narrow down the search result, geo-coordinates and radius can be specified in the parameters to fine tune and specifically target any physical region. For this research, numerous techniques were used which involved the data retrieval using user handle and a collection of hashtags. Without using the geo-coordinates, the data being received is of very broad domain. So, for some of part of the analysis, the coordinates of Motijheel (23.6850, 90.3563) were used along with a radius of 100 miles. This enabled the model to grab all the relevant data from a very specific region.
4.1
Feature extraction
To distinguish the bot account from the user account, some features were extracted from the twitter data. First of all, the total amount of tweets/retweets posted by the users was calculated. Next, the total number of followers and the following of the users was retrieved from the dataset. A follower and following ratio were made for the feature extraction, as showing in Equation 1.
(1)
Table 1: Feature extraction from the raw data of suspected Twitter bots.
@handle Total count Followers Following Retweet % Hashtag Tweet/day Sentiment
AddAWordBot 3233 183 0 0 1 462 1.57
BioPapers 3291 1039 1 0 0 9 1.95
CultEvoBot 3244 414 455 0.062 0 7 1.87
EcoEvoJourn 3236 3698 4 0.062 0.173 10 1.87
EcoLog_L 3249 4183 4 0 0.001 14 1.25
EdTaters 3200 50 2 0 0.999 47 1.71
everyword 3200 68738 33 0 0 46 1.69
evoldir 3225 9529 23 0.031 0 7 1.65
Exoriders 3246 104 1 0 0 23 1.86
Exosaurs 3248 354 2 0 0 24 1.71
fuckexosaur 23 17 0 0 0.043 23 2.32
lawandorder 394 37s 0 0 0 16 1.19
pentametron 2898 24888 2 99.965 0.022 7 2.10
PlantEcolog 1125 802 3 0 0 2 1.69
ProfJocular 3247 403 0 0 0 4 2.97
RealHuman 3216 14861 0 0 1 643 3.24
Table 2: Feature extraction from human user accounts.
@handle Total count Followers Following Retweet % Hashtag Tweet/day Sentiment
abrarkadabbra 198 11 126 8.586 0.874 2 2.10
Afroz_mymuna 79 17 50 98.734 1.709 7 1.47
AhmedRahnuma 199 247 10 16.08 0.859 6 1.77
AhmedSumon 199 210 208 30.653 0.503 2 1.99
AlamMoshiul 199 653 98 23.618 1.96 4 1.71
Ashik_29 199 67 157 12.563 0.643 4 2.14
AzharLeeTon 199 70 742 91.96 0.698 3 1.58
bd_rock 199 234 342 17.085 1.874 2 1.36
BRACJPGSPH 199 691 2382 38.693 1.432 2 1.64
DhakaOpinion 199 205 160 29.146 0.653 9 1.55
DhakaTribune 199 152499 161 0 1.794 33 1.66
eeazim 199 1085 1039 38.191 1.281 6 1.74
FarahGhuznavi 199 2438 118 0 3.915 28 2.95
mjahid98 107 274 713 42.056 1.533 3 2.51
muktadirnewage 199 1037 642 39.196 0.834 8 1.63
TechHubBD 199 12 44 0 5.09 2 2.33
Afrin_nusraat 199 1942 213 36.683 0.714 3 1.80
ainul_bd 199 1136 157 18.593 2.337 2 1.41
[image:3.595.44.557.407.752.2]The bots are known to use lots of hashtags and user mentions compared to a human user, which increases the length of the tweet. Hence, this can be a feature to identify probable bots. Next, the percentage of retweets from the tweets is calculated as sentimental bots are known to promote sentiments. Retweeting tweets for a positive or negative sentiment can be easy and efficient way to boost its promotions. The number of hashtags and user mentioned in the tweet is extracted from the retrieved data and used amongst the other detection features. One of the other important features that was found out is the total number of tweets a particular user has posted. The higher the number, the more likely it is to be a bot user.
One of the other features used for bot detection was sentiment analysis. Bots had been known to manipulate a group of people or promote their content on the social media. A typical sentimental bot behavior is promoting positive contents for a certain amount of time. This promotion is targeted to a general set of people in order to manipulate their view on the topic. Next, the bot abruptly changes its behavior by promoting negative contents on the topic to another set of people. It is mainly done to create a conflict of opinions amongst the general people. Lai [17] discussed in his paper, the day-to-day sentiment can be estimated by counting the number of strongly positive tweets and strongly negative tweets. He has used a sentiment voting scheme to determine whether a tweet contains strong positive sentiment or strong negative sentiment.
For this research, a sentiment analysis tool was used to determine the sentiments from any given tweets. The tweet data retrieved using Twitter API was used to collect the sentiment analysis result. The sentiment analyzer is composed of 2 classifiers trained on twitter sentiments movie reviews [18]. Jacob [18] developed a module which uses the Hierarchical Classification for Sentiment Analysis. Hierarchical classification is grouping two or more classifiers in a hierarchy such that the classifiers on the top have higher authority than the lower ones in the hierarchy. Jacob's hierarchical classification is performed by combining a subjectivity classifier and a polarity classifier. The subjectivity classifier is placed on the top level. It is used to determine if the tweet is objective or subjective. If the tweet is objective, then it is marked as neutral, and the lower level classifier, polarity classifier, is not required. However, if the tweet is found to be subjective (or polar), then the polarity classifier is used to determine if the tweet text is positive or negative.
As shown in Equation 2, a ratio is formed by using this sentiment analysis to retrieve the sentiment ratio.
(2)
The value calculated by dividing the total number of positive and negative sentiments over total neutral sentiments is the ratio used in the bot classification on this paper.
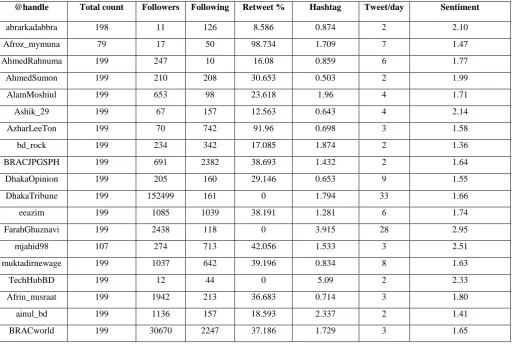
[image:4.595.320.539.85.201.2]For the research and understanding training quality, some tests were performed on our dataset. In order to obtain an accurate scale, “precision” and “recall” methods were used. As mentioned by Manning [19], this method is usually used in pattern recognition and information retrieval. Precision states the fraction of how many retrieved results are relevant and correct. On the other hand, recall, gives an estimated fraction of how many positives is returned by the model. Figure 2 and 3 show the pie chart for better illustration of them and their relationship.
[image:4.595.318.539.87.361.2]Figure 2: Relationship between retrieved data and total set of data.
Figure 3: Relationship between retrieved, not retrieved and irrelevant data retrieved.
Precision and recall are then defined as shown in Equation 3 and 4.
(3)
(4)
where, tp = true positive, fp = false positive, fn = false negative.
For this model’s dataset, tp is the number of bots correctly identified, fp is the number of users incorrectly tagged as bots and fn will be the number of bots not identified by the algorithm. The following results were found:
(5)
(6)
A perfect precision score of 1.0 signifies that every retrieved result was relevant. However, it says nothing about whether or not all the bots were detected or not. Secondly, a recall score of 1.0 means that all bots were retrieved, but says nothing about the incorrectly recognized bots. If recall decreases it indicates that less relevant data was retrieved. Therefore, as the amount of relevant data increases, the possibility of irrelevant data goes up as recall does not keep count of the irrelevant ones.
several advantages as it is based on sound mathematics theory, has better generalization ability(less overfitting), it is robust to noisy data, is not trapped in local minima, and finally works very well with fewer training examples. Even though SVM has long training time, it can fast evaluate the learned target function [20].
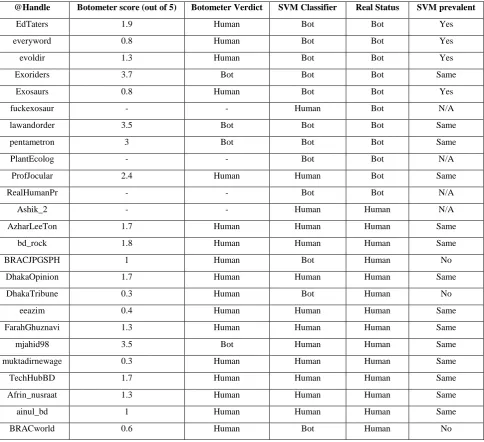
A larger portion of the data was then used to test the classifier’s performance. The features used are as follows the total tweets by the user as “totalcount”, the followers count of the user as “followers”, the friends count of the user as “following”, the follower/following ratio as “ratio”, user’s average tweet length as “avg_tweet_length”, percentage of retweets by user as “rts_percent”, average number of hashtags in tweets by user as “hashtagsPerTweet”, average user accounts mentioned in tweet by user as “userMentionsperTweet”, user’s average sentiment (positive or negative) to neutral sentiment ratio as “Sentiment_ratio” and average tweets by user in a day as “tweets_per_day”. Table 3 shows a comparison with sample output obtained from the trained classifier in comparison to the Botometer status of a user account. Four of the accounts were closed
down so it could not be used in the comparison with full effect. The final result shows, this paper’s classifier has less false positive in compared to Botometer® by OSoMe. Botometer has five false positive out of eight, whereas, SVM classifier has only two.
[image:5.595.316.539.133.272.2]Figure 4: Botometer Classification Results Table 3: Comparison between Botometer and SVM Classifier.
@Handle Botometer score (out of 5) Botometer Verdict SVM Classifier Real Status SVM prevalent
EdTaters 1.9 Human Bot Bot Yes
everyword 0.8 Human Bot Bot Yes
evoldir 1.3 Human Bot Bot Yes
Exoriders 3.7 Bot Bot Bot Same
Exosaurs 0.8 Human Bot Bot Yes
fuckexosaur - - Human Bot N/A
lawandorder 3.5 Bot Bot Bot Same
pentametron 3 Bot Bot Bot Same
PlantEcolog - - Bot Bot N/A
ProfJocular 2.4 Human Human Bot Same
RealHumanPr - - Bot Bot N/A
Ashik_2 - - Human Human N/A
AzharLeeTon 1.7 Human Human Human Same
bd_rock 1.8 Human Human Human Same
BRACJPGSPH 1 Human Bot Human No
DhakaOpinion 1.7 Human Human Human Same
DhakaTribune 0.3 Human Bot Human No
eeazim 0.4 Human Human Human Same
FarahGhuznavi 1.3 Human Human Human Same
mjahid98 3.5 Bot Human Human Same
muktadirnewage 0.3 Human Human Human Same
TechHubBD 1.7 Human Human Human Same
Afrin_nusraat 1.3 Human Human Human Same
ainul_bd 1 Human Human Human Same
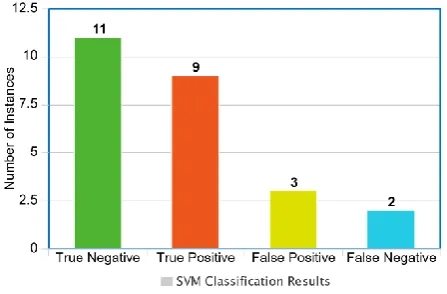
[image:5.595.58.543.314.756.2]After observing Table 3, it is found that some a few false positives are encountered, e.g. BRACJPGSPH, DhakaTribune and BRACworld. The comparison These accounts were classified as bots account, however, that is not the case here. Their features overlap with the bot account features that have used to train the SVM model. By increasing the training data as well as using only the relevant dataset, the number of false positives can be minimized and then model will be able to more accurately detect the actual bot accounts. Figure 4 shows the chart for Botometer and figure 5 shows the depiction of the SVM classification results in chart format. True negative is when the user was a human and it was detected as such. For true positive, the user was a bot and the classifier has detected it correctly. In false positive, the user was a human but it was detected as bot. Finally, false negative is when the user was actually a bot account, but was classified as human.
[image:6.595.55.279.342.489.2]There are many different approaches towards detecting social automated bots. DeBot [22] is a per-user method with Pearson’s χ2 method, which tests the independence of minutes-of-an-hour and seconds-of-a-minute. Limitation of this model is it cannot detect bot accounts with uniformly distributed activities. However, with the proposed model in this paper is using a totally different approach where by using sentiment analysis it is possible to ignore the problem with uniformly distributed activities.
Figure 5: SVM classification results
In another model proposed by S. Kuduguntaa [23], they achieved almost 99% accuracy with a large number of datasets with 8386 accounts with a large number of features set matrix and using deep neural network. Comparing to that model, the model this paper proposed takes way less features only 10 but can achieve an accuracy of around 71-80% using SVM. The accuracy can even be increased with a larger number of train dataset. So, this model is more suitable when best result is needed with minimal computational resources.
5.
CONCLUSION AND FUTURE WORK
Currently, social media such as Facebook, Twitter are of growing concern to everyone around the world and for many reasons. Among all the reasons autonomous entities or BOTs are one of the major concerns. Every social media platform is now working on a way to eliminate all these autonomous entities by implementing different AI tools that can identify the autonomous activities as these bots can generate tweets, retweet, follow, like and spread information rapidly and cause social unrest. These autonomous entities or bots are already making impact on different occasions on different countries around the world. A classification between a human and a bot was performed by using syntax analysis and user behavior along with the sentiment analysis of random tweets, user
specific tweets and extracted features by aggregating the tweets by their senders. This was performed in the context of Dhaka, Bangladesh by using the geolocation feature. The model was able to detect social bots with a precision of 0.75 and recall value of 0.81. Increasing the training dataset will help involve this value to an even higher number.
6.
REFERENCES
[1] Adams, T. AI-powered social bots. arXiv preprint arXiv:1706.05143 (2017)
[2] Ferrara, E., Varol, O., Davis, C.; Menczer, F., Flammini, A., The rise of social bots. Comm. ACM 59(7). (2016) 96-104
[3] Subrahmanian, V., Azaria, A., Durst, S., Kagan, V., Galstyan, A., Lerman, K., Zhu, L., Ferrara, E., Flammini, A., Menczer, F. The DARPA Twitter Bot Challenge. Computer, 49(6). (2016) 38-46.
[4] Kagan, V., Stevens, A., Subrahmanian, V. Using Twitter Sentiment to Forecast the 2013 Pakistani Election and the 2014 Indian Election. IEEE Intelligent Systems, 30(1) (2015) 2-5.
[5] Cotterell, J. Social Networks in Youth and Adolescence (Adolescence and Society). Routledge (2007)
[6] Doreian, P. and Stokman, F. Evolution of social networks, ser. The journal of mathematical sociology. Gordon & Breach Publishing Group, (1997), no. v. 1.
[7] Kwak, H., Lee, C., Park, H., and Moon, S. What is Twitter, a social network or a news media? in Proceedings of the 19th international conference on World wide web, ser. WWW ’10. New York, NY, USA: ACM, (2010) 591–600.
[8] Boyd, D., Golder, S., Lotan, G. Tweet, tweet, retweet: Conversational aspects of retweeting on Twitter, in 43rd Hawaii International Conference on System Sciences (HICSS). IEEE, (2010) 1–10.
[9] Wald, R., Khoshgoftaar, T. M., Napolitano, A., Sumner, C. Predicting susceptibility to social bots on Twitter. 10.1109/IRI.2013.6642447 (2013) 6-13.
[10] Chu, Z., Gianvecchio, S., Wang, H., Jajodia, S. Detecting automation of Twitter accounts: Are you a human, bot, or cyborg? IEEE Transactions on Dependable and Secure Computing (2012) 811–824.
[11] Krishnamurthy, B., Gill, P., Arlitt, M. A few chirps about twitter. Proceedings of the first workshop on Online social networks - WOSP (2008)
[12] Mislove, A., Marcon, M., Gummadi, K., Druschel, P., Bhattacharjee, B. Measurement and analysis of online social networks. Proceedings of the 7th ACM SIGCOMM conference on Internet measurement - IMC (2007)
[13] Yardi, S., Romero, D., Schoenebeck, G., Boyd, D. Detecting spam in a Twitter network. First Monday, 15(1) (2009)
[14] Varol, O., Ferrara, E., Davis, C. A., Flammini, A. Online Human-Bot Interactions: Detection, Estimation, and Characterization. AAAI Publications, Eleventh International AAAI Conference on Web and Social Media (2017)
Networking Sites: A Machine Learning Approach. Lecture Notes in Computer Science (2010) 335-342.
[16]Get TAGS. (2019). Get TAGS v6.1. [online] Available at: https://tags.hawksey.info/get-tags/ [Accessed 2 Apr. 2019]
[17]Lai, P. Extracting Strong Sentiment Trends from Twitter. Stanford Digital Library, Stanford University, Stanford, California, United States (2010)
[18]StreamHacker. Hierarchical Classification. [online] Available at: https://streamhacker.com/2011/01/05/ hierarchical-classification/ [Accessed 9 Nov. 2019]
[19]Manning, C., Schütze, H. Foundations of Statistical Natural Language Processing. Cambridge, Mass. MIT Press (1999)
[20] Olson, D. L., Delen, D. Advanced Data Mining Techniques, Springer, 1st edition ISBN 3-540-76916-1. (2008) 138.
[21] Chu, Z., Gianvecchio, S., Wang, H., Jajodia S. Who is Tweeting on Twitter: Human, Bot, or Cyborg? Proceeding ACSAC '10 Proceedings of the 26th Annual Computer Security Applications Conference (2010) 21-30
[22] Zhang, C. M., Paxson, V. Detecting and analyzing automated activity on twitter. In Lecture Notes in Computer Science (including subseries Lecture Notes in Artificial Intelligence and Lecture Notes in Bio informatics), volume 6579 LNCS of PAM (2011)