ESTIMATION OF STRESS INTENSITY FACTOR FOR THE DIFFERENT CRACK
MODES USING FINITE ELEMENT ANALYSIS
Parnasala Pavan Sai Ram
1, G. Naga Raju
2and Mr. M. RAMESH
31
M.Tech Student
,
Department of Mechanical Engineering, Chirala Engineering College, Chirala, Prakasam, Dist.
Andhra Pradesh
2
Assistant Professor, Department of Mechanical Engineering, Chirala Engineering College, Chirala, Prakasam, Dist.
Andhra Pradesh
3
Associate. Professor and Head, Department of Mechanical Engineering, Chirala Engineering College, Chirala,
Prakasam, Dist. Andhra Pradesh
---***---
ABSTRACT: All the structural and mechanical componentsare designed with an intension to meet the required life cycles. For this factor of safety is also considered for the design of the model. But during working many components fail to reach the designed number of life cycles. This happens even with the stress levels very much less than the yield point of the material. This is because of variation of Mean stress due to compressive and tensile loads. These randomly varying loads along with the material voids in the geometry may lead to crack generation. After few numbers of stress cycles the generated crack leads to the catastrophic failure of the component called as Fracture.
Some of the important factors affecting the fracture of a component are stress cycles and Crack Dimensions. The failure of cracked components is governed by the stresses in the vicinity of the crack tip called as Stress Intensity Factor (SIF).The stress intensity factors depend on the geometry of the component and on loading condition.This paper work is on the evaluation of stress intensity factor of opening mode at the crack tip for compressive and Tensile Load cases for bonding homogeneous material for different crack dimensions. Static Structural analysis is also carried out for the designed Rivet component to find the stresses and Displacements developed for load cases which differ in magnitude and direction. Pre-stressed Modal analysis is carried out to find the effect of above stresses on the stiffness of the component. Random vibrations analysis is also carried out to find the deformations developed in the component due to the excitations because of above considered cases. The finite element model required for the above analysis is modeled in the Ansys Package.
Keywords: FEA, Stress intensity factor & Method of separation of variables
1. INTRODUCTION TO RIVETS
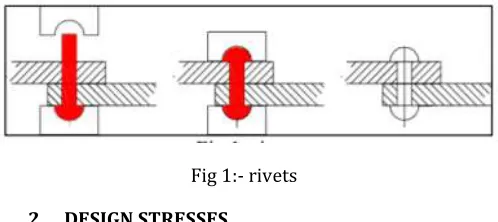
Rivets are taken into consideration to be permanent fasteners. Riveted joints are consequently similar to
[image:1.612.328.577.486.597.2]welded and adhesive joints. whilst thinking about the energy of riveted joints comparable calculations are used as for bolted joints. Rivets had been used in lots of massive scale packages including shipbuilding, boilers, strain vessels, bridges and buildings and so on. In recent years there has been a revolutionary circulate from riveted joints to welded, bonded and even bolted joints A riveted joint, in larger quantities is every so often inexpensive than the opposite options however it calls for better talent levels and extra get admission to to each sides of the joint There are strict standards and codes for riveted joints used for structural/strain vessels engineering however the requirements are much less rigorous for the usage of riveted joints in popular mechanical engineering Mechanical joints are widely categorised into two classes viz., non-permanent joints and permanent joints. Non-everlasting joints may be assembled and dissembled with out detrimental the additives.
Fig 1:- rivets
2. DESIGN STRESSES
The riveted joints are analyzed based on the subsequent assumptions :
1) Rivets are loaded in shear the weight is distributed in share to the shear area of the rivets.
2) There are not any bending or direct stresses in rivets.
© 2019, IRJET | Impact Factor value: 7.34 | ISO 9001:2008 Certified Journal
| Page 2361
4) After meeting rivet absolutely fills in the rivet hole.
5) power of the joint won't be affected due to friction among the adjoining surfaces.
2.1 Riveted Joints
1) Tearing of the plate at an facet: A joint may additionally fail due to tearing of the plate at an edge as shown in discern 1. this can be avoided by way of keeping the margin, m=1.5d, in which d is the diameter of the rivet hole.
Fig: 2- Tearing of the plate at an part
2.2 Crushing of the plate or rivet:
once in a while under tensile strain rivets crushed in preference to shear off as proven in parent 4. because of this the rivet hole is available in to an oval shape and joint becomes loose. This failure is referred to as bearing failure. while the crushing resistance is more than the carried out load consistent with pitch length, then this type of failure will arise.
Fig: 3- Crushing of the plate or rivet
2.3 Performance of riveted joint
Efficiency of the riveted joint is the ratio of least cost of power of tearing, shearing or crushing to strength of unriveted plate and is given as Joints of uniform power: Lozenge joint A riveted joint also called lozenge joint used for roof, bridge work or girders etc. Diamond riveting is employed in this form of joints which gives uniform energy to the joint. The diameter of the rivet hole is obtained by way of using Unwin’s system i.e. d=6√t, where ‘t’ is the thickness of the plate . The quantity of rivets required for the joint is received by means of the shearing or crushing resistance of the rivets. Double shear is considered for double strap butt joint. Thickness of the plate is considered
based at the variety of straps or covers required to make the efficient joint.
3. RAILWAY BRIDGES
The Godavari Bridge is a truss bridge over the river Godavari at Rajahmundry, Andhra Pradesh kingdom of India. Godavari Bridge is likewise referred to as Kovvur-Rajahmundry Bridge is the Asia's 2d longest street-cum-rail bridge above the water. This 2.7 kilometres lengthy bridge is the landmark of Rajahmundry and the second out of total three bridges over the Godavari River at Rajahmundry.
Fig4:- Godavari bridge
Fig5 :Sliding-in of Brinnington Bridge
4. LITERATURE REVIEW
“B. Langrand”[1], “Full scale experimental characterization for riveted joint design”,21stJune 2002.This paper works on the riveted joints design for airframe applications. It also shares the information regarding the state of material after the process of Riveting. A test Rig named ARCAN was proposed for Multi Axial failure criterion for rivets. Results obtained fromN number of testswith maximum angular position and maximum load showed that failure mode was continued up to 30and propagation of failure was altered as per this angle. It is observed that counter sank head of the rivet was sheared for angles between 450 and 900. A comparison was made to the ratio between maximum tension and shear loads to the ratio of effective shear and found that (Fmax/So)tension =~(Fmax/So)shear = 200Mpa. This has given the effect of rivet geometry on the structure. ARCN tests were performed which has defined experimental failure criterion of rivet at some configurations like Pure tension 0, Mixed shear and Tension 15,30 & 45 and Pure tension. The future scope of this work was carried out by an ONERA grant. “ZH NG Kaifu”[2], “ Riveting Process Modelling and Simulating for Deformation analysis of Aircraft’s thinwalled Sheet-metal Parts”, 29thOctober 2002.Simulations were carried out in this paper to analyse the deformations more accurately for the thin-walled sheet-metal parts. This paper was involved in the Mathematics model and Mechanics model of the riveting process for the Elastic and Plastic deformations along with spring back of the rivets. It has used the ABAQUS package for analysing the stresses and Deformations of a rivet at two thin walled sheet metal parts made of Aluminium Alloys. They have compared the results of Analytical Model and Fem Model, There by proving that both the results are approximate. For this an example of a hammer is considered. Hammer is Moved to a limiting position where T=0.50s, Shift of the Hammer S=2.500mm and Rivet deflection (δ) is found as 2.5 mm. “Wojciech Wronicz”[3], “Numerical analysis of riveted Lap Joint Used In aircraft Structures”, February 2006.This paper deals with the FEM analysis of riveted lap joints loaded in tension. The Joint is made with 2024-T3 clad alloy material and Consists of two sheet metals with 125x60 mm dimensions and with a nominal thickness of 1.2 mm. Only half of the joint is considered for analysis and Symmetry boundary conditions were applied. This article involves in the numerical analysis of the riveted lap joints which are found more often in fuselage structures of Passenger Aircrafts.
A study was carried by the EUREKA-IMPE-J entitled “Improving the Fatigue Performance of riveted Joints in airframes”. He had worked on optimizing the fatigue performance of joints. He focused to achieve this by finding optimal riveting process parameters along with optimising
rivet and Joint Geometry. He also involved in increasing the accuracy of the fatigue estimating methods. The Finite element Model was generated with linear solid Elements. MSC MARC Solver was used to obtain the solution.MSC PATRAN and MARC MENTAT softwarewere used for the Pre-Processing of the Model and Post- Processing of the Results.
5. INTRODUCTION TO CREO
PTC Creo, earlier known as CREO& Wildfire, is a 3D CAD/CAM/ CAE and associative solid modelling application. Creo is one of a suite of 10 synergistic applications that give solid, assembly modelling, 2D orthographic perspectives, FEA, parametric and direct modelling, NURBS &sub-divisional surface modelling, and functionality of NC & tooling for mechanical designers.
Creo Elements/Parametric contend specifically with CATIA, NX, SolidEdge & Solidworks. It was made by Parametric Technology Corporation (PTC) & was the first of its kind to advertise. Creo Elements/Pro-E (in the past CREO), PTC's parametric, incorporated 3D CAD/CAM/CAE arrangement, is utilized by discrete makers for mechanical building, plan and assembling.
6. INTROCUCTION TO FEA
The FEM (Finite Element Method), is a numerical technique for solving mathematical physics and engineering problems. Normal problems of areas of interest incorporate structural analysis, thermal analysis, mass transport, electromagnetic potential and fluid flow. These problems analytical solutions require the answer for limit esteem issues for partial differential conditions. The FEM definition of the issue results in an arrangement of algebraic equations. The strategy yields rough estimations of the questions at discrete number of focuses over the domain.
To tackle the issue, it subdivides a huge problem into littler, more straightforward parts which are known as finite elements. These simple equations that model these finite elements are then collected into a bigger arrangement of conditions that models the whole issue. FEM at that point utilizes variation techniques from the math of varieties to inexact an answer by limiting a related mistake work.
7. BOUNDARY CONDITIONS
The boundary conditions applied in the analysis of the model are summarized as follows.
The selected faces of the model are constrained in
© 2019, IRJET | Impact Factor value: 7.34 | ISO 9001:2008 Certified Journal
| Page 2363
Input Force applied as 10KN, 15KN & 20KN for
tensile and compressive load on the joints in railway bridges.
8. MATERIAL SPECIFICATIONS
The material data required for the Analysis is taken from online sources [Matweb] and Reference research works. Below table shows the material data.
S.No Parameter Steel
1 Young’s Modulus (GPa) 210
2 Poisson’s Ratio 0.23
3 Density (Kg/m3) 7800
Table:1: Material Details
9. MODELING OF RIVET JOINT IN CREO 2.0
The design data considered for the development of Rivet joint is obtained from the work “Determination of stress intensity factor for mode I fatigue crack based on finite element analysis” by Qinghua Han, Yaru Wanga Yue Yin and Danni Wangand areshown below for each of the component separately. The drafting data used for the generation of I section Frame is shown in the below figures.
Fig: 7: I-section frame
The data for the creation of the frame to attach I section, Left and Right side supporting frames is shown in the below drafts.
Fig: 8: Frame to attach the I-Section and other supports
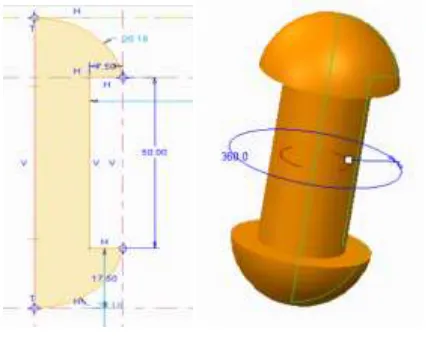
The 2D sketch to create the Rivet is shown in the below figure. A 3D Model is obtained by revolving the 2D Sketch about its own central axis.
Fig: 10:Rivet
[image:5.612.324.589.309.476.2]The final view of the Model after assembling and generating the rivets in the required pattern is shown in the below figure.
Fig: 11: Final assembly of the Model
10. FRACTURE ANALYSIS OF RIVET JOINT
Fig: 12: Imported model of from Creo 2.0
Fig: 13:Meshed model
[image:5.612.48.281.381.524.2]Fig: 14: Crack definition
[image:5.612.43.281.576.710.2]© 2019, IRJET | Impact Factor value: 7.34 | ISO 9001:2008 Certified Journal
| Page 2365
[image:6.612.316.583.91.261.2]Fig: 16:Stress intensity factor K1
Fig: 17:J – Integral on rivet joint
Fig: 18: Forces
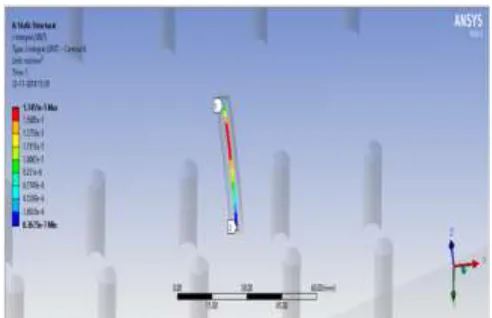
[image:6.612.327.573.289.448.2]Fig 19:Stress intensity factor K1 on Rivet joint
Fig 20:J – Integral on rivet joint
[image:6.612.45.280.293.466.2] [image:6.612.44.287.491.685.2]Fig22: Equivalent Von-Mises Stress
Fig 23: Mode 1
Fig 24: Mode 2
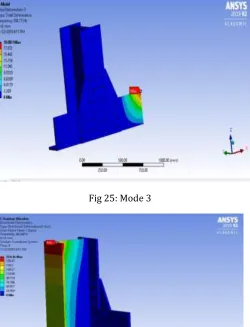
Fig 25: Mode 3
Fig 26: Directional Deformation
© 2019, IRJET | Impact Factor value: 7.34 | ISO 9001:2008 Certified Journal
| Page 2367
Fig 28: Comparison of Stress Intensity Factor K1 values for different Loads.
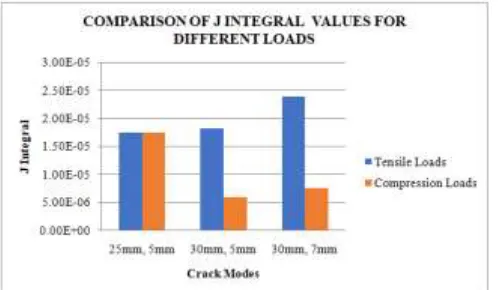
Fig 29: Comparison of J Integral values for different Loads.
Fig 30: Comparison of Stress values for Tensile and Compression Loads.
[image:8.612.326.577.296.452.2]Fig 31: Comparison of Deformation values for Tensile and Compression Loads.
Fig 32: Comparison of Frequency values of modes for Tensile Loads
[image:8.612.39.291.484.628.2]11. CONCLUSIONS
The analysis is carried for a/d ratios at 2 where ‘a’ is half crack length and ‘d’ is diameter of hole. Fracture analysis and static analysis are done to determine the stress intensity factors, stresses and deformation and compared for Tensile and Compression loads.
By observing analysis results, the stress intensity factors and stresses are increasing by increasing the a/d ratio. The variation of S.I.F with respect to a/d ratio is used to obtain the characteristic curve of SIF which depends only on the geometrical factor and its variation within the given domain (a/d). It is observed that the value of SIF rises suddenly when the crack tip is near to the hole and it stabilises as the crack tip move far from the hole.
The Stress Intensity Factor is increasing by about 2.39% for mode 30mm, 7mm when compared with a/D using different crack modes as 25mm, 5mm and 30mm, 5mm at Tensile Loads. Increasing by about -0.69% for mode 25mm, 5mm when compared with a/D using different crack modes as 30mm, 5mm and 30mm, 7mm at Compression Loads.
The J Integral is increasing by about 2.48e-05% for mode 30mm, 7mm when compared with different crack modes as 25mm, 5mm and 30mm, 5mm at Tensile Loads. Increasing by about 1.75e-05% for mode 25mm, 5mm when compared with different crack modes as 30mm, 5mm and 30mm, 7mm at Compression Loads.
By observing Structural Analysis, the Stresses are increasing by about 6.95% for 20KN Load when compared with 10 and 15KN loads by using Tensile and Compression loads. The Deformation is decreasing by about 0.0065% for 10KN load when compared with 15 and 20KN by using Tensile and Compression loads.
By observing Modal Analysis, the Deformations are increasing by about 19.99 % at Mode 3 when compared with remain Modes using Tensile Load. The Deformations are increasing by about 20% at Mode 3 when compared with remain Modes using Compression Load.
By observing Random vibrational analysis, the shear Stress is increasing by about 9459% for Compression load at 10KN when compared with Tensile load for remain 15 and 20KN. The directional Deformation is decreasing by about 222.53% for Tensile load at 20KN when compared with Compression Load for remain 10 and 15KN.
REFERENCES
[1] J.J.Homan, R.P.G. Muller “Fatigue of Riveted Joints,” Fibre Metal Laminates, vol.6, pp.173-195, 2001.
[2] Pravin M. Patil; sharadkachave, “Influence of Rivet Association on Strength of Riveted Joint,” International journal of Emerging Technology and Advanced Engineering, vol.6, pp.240-244, May 2016
[3] Suyogkumar W Balbudhe and S R Zaveri, “Stress Analysis of Various Types of Riveted Lap Joint,” International Journal of Mechanical Engineering and Robotics Research, vol. 2, pp. 127-133, Oct 2013.
[4] Jacek Mucha, waldemar Witkowski, “The structure of the strength of Riveted joints Determined in the Lap Joint Tensile shear stress,” acta mechanica et automatica, vol. 9, pp. 44-49, March 2015.
[5] Kurmi R S and Gupta J K , “A Text book of Machine Design” 2009.
[6] Shashikumar.C, Nagesh.N, Ganesh, Design and Analysis of Wing fuselage attachment bracket for fighter aircraft. International Journal of Engineering Research and General Science Volume 4, Issue 1, January-February, 2016 ISSN 2091-2730.
[7] Madiha Khan, Mohammed Rehman Khan, D. Smitha, Design And Analysis On Aircraft Wing To Fuselage Lug
Attachmen, IOSR Journal of Engineering (IOSRJEN) ISSN (e): 2250-3021, ISSN (p): 2278-8719 PP 37-42,2018.
[8] T. NarendiranathBabu, Prasanth, E. Raj Kumar, R. Mageshvaran , Structural Analysis On Wing Box Spliced Joint For An Aircraft Using Finite Element Method, International Journal of Civil Engineering and Technology (IJCIET) Volume 8, Issue 3, March 2017, pp. 302–313 Article ID: IJCIET_08_03_031 Available online at http://www.iaeme.com/IJCIET/issues.asp?JType=IJCIET& VType=8&IType=3 ISSN Print: 0976-6308 and ISSN Online: 0976-6316
[9] N. Bhaskara Rao, K. Sambasiva Rao, Dynamic Analysis and Fatigue Life Estimation of Wing Fuselage Attachment Bracket of an Airframe Structure, IJSRD - International Journal for Scientific Research & Development| Vol. 4, Issue 12, 2017 |