Proceedings of NAACL-HLT 2016, pages 60–65,
An Unsupervised System for Visual Exploration of Twitter Conversations
Derrick Higgins, Michael Heilman, Adrianna Jelesnianska and Keith Ingersoll
Civis Analytics
Abstract
Social media provides a wealth of information regarding users’ perspectives on issues, pub-lic figures and brands, but it can be a time-consuming and labor-intensive process to de-velop data pipelines in which those perspec-tives are encoded, and to build visualizations that illuminate important developments. This paper describes a system for quickly devel-oping a model of the conversation around an issue on Twitter, and a flexible visualization system that allows analysts to interactively ex-plore key facets of the analysis.
1 Introduction
This paper introduces a visualization system de-signed to support deep analysis of Twitter conversa-tions that persist over a long period of time (as well as inform decisions concerned with recent develop-ments). Given a set of tweets that define the con-versation to be modeled (and which may be selected by arbitrary criteria including keywords, users, and time frames of interest), Civis Analytics’ web-based system provides a rich and interactive set of visual-izations that illustrate
• the major themes of discussion and user per-spectives,
• communities of users engaged in the conversa-tion (and their centrality to it),
• how strongly users and user groups address par-ticular themes,
• the activity of themes and user groups over time, and
• the activity of themes and user groups in differ-ent geographical regions.
We anticipate that an analyst can use this tool to quickly develop a high-level understanding of the dynamics of a given issue on Twitter, to drill down into the specifics of how particular users and tweets contribute to changes in the conversation, and to develop informed strategies for outreach or inter-vention. The tool takes advantage of current re-search in topic modeling and community analysis, and can easily incorporate domain-specific knowl-edge where it is available.
2 Related Work
Civis’ system for visualizing the dynamics of social media conversations builds upon prior research in a number of areas.
2.1 Data processing technologies
the same mixture component (topic), and the Biterm Topic Model (Yan et al., 2015) combines adjacent terms to provide richer information about the subject of a short text. The topic modeling method incorpo-rated into the Civis social listening tool builds upon this research to provide meaningful topic groupings on short texts, but currently does not make use of any tweet metadata such as author or time frame.
Similarly, much progress has been made in re-cent years in adapting sentiment analysis to mi-croblog data. Promising methods include hybrid topic-sentiment models (Xiang and Zhou, 2014), the incorporation of tweet metadata into the model (Vosoughi et al., 2015), and the application of word sense disambiguation as a pre-processing step (Sumanth and Inkpen, 2015).
Finally, our visualization tool makes use of graph-based community analysis. We use the Louvain al-gorithm (Blondel et al., 2008) on the friend-follower graph to find coherent user communities in a Twitter conversation; a survey of modern methods for com-munity analysis is given by Malliaros and Vazirgian-nis (2013).
While the current version of the Civis visualiza-tion tool includes topic modeling, community infer-ence, and sentiment analysis, it is agnostic as to the source of these data layers. Our data abstraction layer guarantees that the visualization too will work as long as the relevant model can assign numeric val-ues to tweets (or, in the case of community analysis, categories to users).
2.2 Visualization research
We also build on previous work that has developed interfaces for visualizing microblog metadata de-rived using natural language tools. Xie et al. (2013) use high-frequency bar charts to demonstrate the ac-tivity associated with “bursty” topics identified by their algorithm, while Malik et al. (2013) conduct user studies to refine a Twitter topic exploration tool with multiple information displays.
In the area of sentiment analysis, many dash-boards have been developed to show the time course of opinion associated with a particular topic or key-word. Hao et al. (2011) develop a system with more engaging displays than the standard line chart, in-cluding heatmaps embedded within calendars, and activity maps.
The tool we will present in our demonstration dif-fers from these previous interfaces primarily in the flexibility it allows for faceting the analysis accord-ing to NLP-related features, location, user commu-nity, and time.
3 System Overview
Civis Analytics’ system for visualizing conversa-tions on Twitter is intended to allow an analyst to quickly develop a model of the most important themes of discussion on an issue, the parties in-volved in the conversation, and trends across time and space.
In our live demonstration of the system, we will show how it can be used to analyze a wide variety of issues, including climate change, data science, and education. To provide a clearer indication of the type of views the system supports, though, we focus here on an analysis of the 2015-16 US Presidential pri-mary campaign. The dataset for our analysis con-sists of approximately 15 million tweets posted be-tween May, 2015 and February, 2016. These tweets were selected to include references to one or more of the Republican or Democratic candidates for the presidency (by name or using a strongly associated hashtag).
We applied a version of topic modeling adapted to short texts to infer a set of 44 topics, which are not mutually exclusive. Some of these topics are associated with particular candidates, while others are related to issues or events in the campaign. An analyst manually labeled these topics by inspect-ing the words and tweets most strongly associated with each, and the resulting topic definitions are in-cluded in our visualization tool for reference; Fig-ure 1 demonstrates how topic-word associations are shown to users for the first 5 topics in our set (alpha-betically).
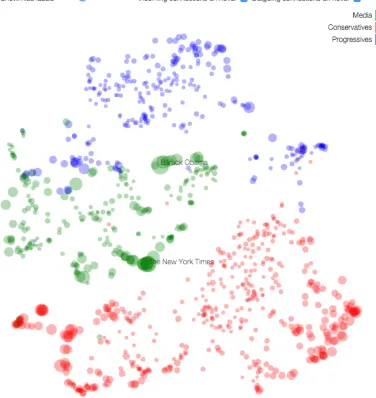
projected into two dimensions (cf. Figure 2). The 2D projection is done using the t-SNE algorithm (van der Maaten and Hinton, 2008) so that users with similar friend-follower relationships generally appear near one another. Users can interactively ex-plore the graph to identify key users in each commu-nity and access their profiles.
The Civis interface also allows users to access more information about particular Twitter accounts that are relatively central to the network for a partic-ular issue (using a network centrality measure such as PageRank). We hypothesize that accounts with a central position in the friend-follower network re-stricted to a particular issue are likely to be impor-tant, and perhaps influential figures in the relevant Twitter community. As shown in Figure 3, the avail-able metadata about these key accounts includes the number of followers, how active they are on a given issue, and their relative engagement across topics.
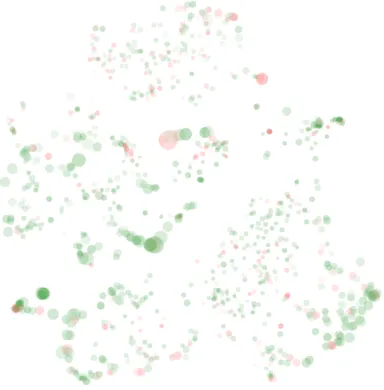
[image:3.612.100.292.439.634.2]Our system also supports sentiment analysis; Fig-ure 4 demonstrates the average sentiment polarity of tweets overlaid on the graph of relationships be-tween Twitter users. While the activity of particular topics is often strongly indicative of sentiment on its own, the sentiment layer may sometimes encode in-dependent information as well.
Figure 4:Overlay of sentiment on to user exploration view
Finally, given base data associated with each tweet regarding topics, sentiment, and user commu-nities, the Civis social listening tool provides mul-tiple visualizations that allow users to explore the
inter-relationships among these variables (including crosstabs, maps, and time series charts). Figure 5 shows a sample line chart displaying the time course of activation of the Bernie Sanders, Hillary Clinton and Black Lives Matter topics, restricted to the sub-set of Twitter users who are classified as belonging to the Progressive community.
4 Discussion and Future Work
The Civis social listening tool provides a flexible en-vironment in which an analyst can interactively ex-plore selected dimensions of a Twitter conversation. We hope it will inspire future research on visualiza-tion techniques for social media, and we anticipate extending the tool in a number of directions in the near future.
First, we plan to extend the set of case studies we have developed in order to test and demonstrate its functionality. We have built out analyses of the 2016 US Presidential Primary, climate change, and data science, but we would like to extend this set to in-clude a more diverse set of topic areas.
Second, we plan to conduct more formal usability studies to establish which parts of the interface are most useful, and which users may find confusing or superfluous.
Figure 1:Visualization of words most strongly associated with selected topics
[image:4.612.113.489.270.668.2]Figure 3:List of most influential accounts from the Conservative community in the Presidential Primary analysis
[image:5.612.97.523.439.683.2]References
David M. Blei, Andrew Y. Ng, and Michael I. Jordan. 2003. Latent Dirichlet allocation. Journal of Machine Learning Research, 3:993–1022, March.
Vincent D. Blondel, Jean-Loup Guillaume, Renaud Lam-biotte, and Etienne Lefebvre. 2008. Fast un-folding of communities in large networks. Jour-nal of Statistical Mechanics: Theory and Experiment, 2008(10):10008+, July.
Ming C. Hao, Christian Rohrdantz, Halldor Janetzko, Umeshwar Dayal, Daniel A. Keim, Lars-Erik Haug, and Meichun Hsu. 2011. Visual sentiment analysis on Twitter data streams. InIEEE VAST, pages 277–278. IEEE Computer Society.
Sana Malik, Alison Smith, Timothy Hawes, Panagis Pa-padatos, Jianyu Li, Cody Dunne, and Ben Shneider-man. 2013. TopicFlow: visualizing topic alignment of Twitter data over time. In Jon G. Rokne and Christos Faloutsos, editors,ASONAM, pages 720–726. ACM. Fragkiskos D. Malliaros and Michalis Vazirgiannis.
2013. Clustering and community detection in directed networks: A survey. Physics Reports, 533(4):95 – 142. Clustering and Community Detection in Directed Networks: A Survey.
Chiraag Sumanth and Diana Inkpen. 2015. How much does word sense disambiguation help in sentiment analysis of micropost data? In Proceedings of the 6th Workshop on Computational Approaches to Sub-jectivity, Sentiment and Social Media Analysis, pages 115–121, Lisboa, Portugal, September. Association for Computational Linguistics.
Laurens van der Maaten and Geoffrey E. Hinton. 2008. Visualizing high-dimensional data using t-SNE. Jour-nal of Machine Learning Research, 9:2579–2605. Soroush Vosoughi, Helen Zhou, and deb roy. 2015.
En-hanced Twitter sentiment classification using contex-tual information. InProceedings of the 6th Workshop on Computational Approaches to Subjectivity, Senti-ment and Social Media Analysis, pages 16–24, Lis-boa, Portugal, September. Association for Computa-tional Linguistics.
Bing Xiang and Liang Zhou. 2014. Improving Twitter sentiment analysis with topic-based mixture modeling and semi-supervised training. In Proceedings of the 52nd Annual Meeting of the Association for Compu-tational Linguistics (Volume 2: Short Papers), pages 434–439, Baltimore, Maryland, June. Association for Computational Linguistics.
Wei Xie, Feida Zhu, Jing Jiang, Ee-Peng Lim, and Ke Wang. 2013. TopicSketch: Real-time bursty topic detection from twitter. In Hui Xiong, George Karypis, Bhavani M. Thuraisingham, Diane J. Cook, and
Xin-dong Wu, editors,ICDM, pages 837–846. IEEE Com-puter Society.
Xiaohui Yan, Jiafeng Guo, Yanyan Lan, Jun Xu, and Xueqi Cheng. 2015. A probabilistic model for bursty topic discovery in microblogs. In The Twenty-Ninth AAAI Conference on Artificial Intelligence.