Original Article
Procalcitonin levels correlates with the pathogeny and
severity of community acquired pneumonia:
a meta-analysis
Li Chen*, Cong Feng*, Jing Dong*, Yongzhi Zhai*, Xin Chen, Bei Li, Xuan Zhou, Wei Chen, Tanshi Li
Department of Emergency, General Hospital of The PLA, Beijing 100853, China. *Equal contributors.
Received March 4, 2016; Accepted June 7, 2016; Epub July 15, 2016; Published July 30, 2016
Abstract: Background: The purpose of this study was to comprehensively evaluate the role of PCT (procalcitonin) in diagnosis and prognosis of community acquired pneumonia (CAP) by a meta-analysis. Methods: Two researchers independently performed a retrieve on the databases of PubMed, Embase and Cochrane published in English up to July 2015. The search strategy was (“community acquired pneumonia” OR CAP) AND procalcitonin. The risk ratio
(RR) with 95% CI (confidence interval) was used for the analysis of dichotomous data. Standardized mean differenc -es (SMD) and 95% CI were used to perform the analysis for continuous outcom-es. All statistical analys-es were per-formed by using RevMan (Review Manager) 5.3 software and Stata 12.0 statistical software package. Heterogeneity was analyzed with the Cochran Q test and I2 test. Stata 12.0 was used to perform sensitivity analysis. Results: A
total of 15 studies (6401 adult patients diagnosed with CAP) were selected in this meta-analysis. The number of
patient mortality in PCT≥0.5 ng/ml was twice that of PCT<0.5 ng/ml (RR = 0.50 (95% CI: 0.40, 0.62)). The number of patients that pathogen could be detected was 1.31 times that of could not be detected (RR = 1.31 (95% CI: 1.11, 1.55)). PCT levels of death cases were significantly higher than those of survival cases (SMD = -0.31 (95% CI: -0.50,
-0.13)). The sensitivity analysis showed that this meta-analysis result was stable. Conclusions: Serum PCT levels are
significantly related with detection of CAP pathogen and severity of CAP cases.
Keywords: Meta-analysis, procalcitonin levels, community acquired pneumonia
Introduction
Community acquired pneumonia (CAP), the sixth leading cause of death in the United
States, is a common lung inflammatory process
that respond to infection with community (non-hospital) pathogens [1, 2]. It is estimated that about 83,000 CAP patients are admitted to hospital annually in the UK and 6% of these patients require admission to the ICU (intensive care unit) [3]. In addition, the mortality of ICU patients with CAP is more than 30% [3]. The risk factors for CAP include alcohol ingestion and the presence of prior ambulatory antimi-crobial treatment [4]. Therefore, evaluation of the severity and prediction of the clinical
out-comes are significantly important for the selec -tion of therapeutic decision-making.
Procalcitonin (PCT), the prehormone of calcito-nin [5], is produced by the liver and peripheral
In our present study, we searched the databas-es of PubMed, Embase and Cochrane for stud-ies published in English up to July 2015 and used meta-analysis to analyze the relationships between PCT levels and pathogeny and severity of CAP. We expected to evaluate the role of PCT levels in pathogen and severity of CAP.
Materials and methods
Search strategy
We studied publications that reported the cor-relation of PCT levels and pathogeny and sever-ity of CAP. We searched the databases of PubMed, Embase and Cochrane for studies published in English up to July 2015. The key words used in this study were “procalcitonin” and “community acquired pneumonia”. The se- arch strategy was (“community acquired pneu-monia” OR CAP) AND procalcitonin.
with the third researcher. Extracted data in-
clude the first author, published year, study
type, country, study period, contained clinical characteristics, evaluation standards of CAP’s severity, measuring method of PCT, numbers and age of contained cases, and outcome indi-cators of meta analyses.
The Newcastle-Ottawa Scale (NOS) [20] was used to assess the quality of the contained study.
Statistical analyses
The risk ratio (RR) and 95% CI (confidence inter -val) were used for the analysis of dichotomous data. Standardized mean differences (SMD) and 95% CI were used to perform the analysis for continuous outcomes. Heterogeneity was analyzed with the Cochran Q test and I2 test
[21]. If P<0.05 or I2>50%, which indicated that
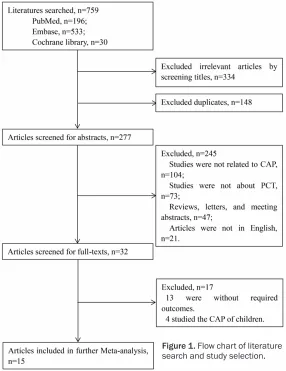
[image:2.612.91.377.73.444.2]all the studies were heterogeneity, the random Figure 1. Flow chart of literature
search and study selection.
Study selection
Two researchers reviewed ti- tles, abstracts and full text independently. Disparities we- re resolved by discussion with the third researcher.
The inclusion standards were as follows: English literature; literatures related with PCT levels of CAP; adults with CAP; the study contained at least one required outcome that this study aimed to pool. The exclusion standards were as follows: Non-English litera-ture; studies not related to CAP; studies not about PCT; articles such as reviews, let-ters and meeting abstracts; repeated publications; stud-ies without required outco- me.
Data extraction and study quality assessment
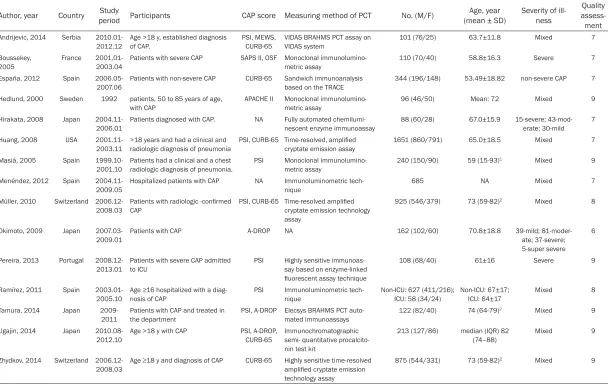
Table 1. Characteristics of the included articles
Author, year Country period ParticipantsStudy CAP score Measuring method of PCT No. (M/F) (mean ± SD)Age, year Severity of ill-ness assess-Quality ment
Andrijevic, 2014 Serbia 2010.01-2012.12
Age >18 y, established diagnosis of CAP.
PSI, MEWS, CURB-65
VIDAS BRAHMS PCT assay on VIDAS system
101 (76/25) 63.7±11.8 Mixed 7 Boussekey,
2005
France 2001.01-2003.04
Patients with severe CAP SAPS II, OSF Monoclonal immunolumino-metric assay
110 (70/40) 58.8±16.3 Severe 7 España, 2012 Spain
2006.05-2007.06 Patients with non-severe CAP CURB-65 Sandwich immunoanalysis based on the TRACE 344 (196/148) 53.49±18.82 non-severe CAP 7 Hedlund, 2000 Sweden 1992 patients, 50 to 85 years of age,
with CAP APACHE II Monoclonal immunolumino-metric assay 96 (46/50) Mean: 72 Mixed 9 Hirakata, 2008 Japan
2004.11-2006.01
Patients diagnosed with CAP. NA Fully automated chemilumi-nescent enzyme immunoassay
88 (60/28) 67.0±15.9 15-severe; 43-mod-erate; 30-mild
7 Huang, 2008 USA
2001.11-2003.11
>18 years and had a clinical and radiologic diagnosis of pneumonia
PSI, CURB-65 Time-resolved, amplified
cryptate emission assay
1651 (860/791) 65.0±18.5 Mixed 7 Masiá, 2005 Spain
1999.10-2001.10 Patients had a clinical and a chest radiologic diagnosis of pneumonia. PSI Monoclonal immunolumino-metric assay 240 (150/90) 59 (15-93)
1 Mixed 9
Menéndez, 2012 Spain
2004.11-2009.05 Hospitalized patients with CAP NA Immunoluminometric tech-nique 685 NA Mixed 7 Müller, 2010 Switzerland
2006.12-2008.03
Patients with radiologic -confirmed
CAP
PSI, CURB-65 Time-resolved amplified
cryptate emission technology assay
925 (546/379) 73 (59-82)2 Mixed 8
Okimoto, 2009 Japan
2007.03-2009.01 Patients with CAP A-DROP NA 162 (102/60) 70.8±18.8 39-mild; 81-moder-ate; 37-severe; 5-super severe
6
Pereira, 2013 Portugal
2008.12-2013.01 Patients with severe CAP admitted to ICU PSI Highly sensitive immunoas-say based on enzyme-linked
fluorescent assay technique
108 (68/40) 61±16 Severe 9
Ramírez, 2011 Spain 2003.01-2005.10
Age ≥16 hospitalized with a diag -nosis of CAP
PSI Immunoluminometric tech-nique
Non-ICU: 627 (411/216); ICU: 58 (34/24)
Non-ICU: 67±17; ICU: 64±17
Mixed 8 Tamura, 2014 Japan
2009-2011 Patients with CAP and treated in the department PSI, A-DROP Elecsys BRAHMS PCT auto-mated immunoassays 122 (82/40) 74 (64-79)
2 Mixed 9
Ugajin, 2014 Japan
2010.08-2012.10 Age >18 y with CAP PSI, A-DROP, CURB-65 Immunochromatographic semi- quantitative procalcito-nin test kit
213 (127/86) median (IQR) 82
(74–88) Mixed 9 Zhydkov, 2014 Switzerland
2006.12-2008.03 Age ≥18 y and diagnosis of CAP CURB-65 Highly sensitive time-resolved amplified cryptate emission
technology assay
875 (544/331) 73 (59-82)2 Mixed 9
effects model was chosen. If not, the fixed
effect model was selected. All statistical analy-ses were performed by using RevMan (Review Manager) 5.3 [22] software and Stata12.0 [23] statistical software package.
Sensitivity analysis
Stata 12.0 was used to perform sensitivity analysis. We trimmed one study at a time to assess the sensitivity of this analysis. The dif-ference of pooled effects was compared before and after the trim. If the pooled results reversed after the trim, then it illustrated that the results was unstable.
Results
Study selection
A total of 759 articles were identified after the
preliminary screening, with 196 from the PubMed, 533 from the Embase and 30 from the Cochrane library. After eliminating unrelat-ed studies (334) and duplicate literatures (148), 277 studies remained. We obtained 32 studies for the full text screening after abstract screening, which eliminated non-English arti-cles (21), summarizes, letters and conference excerpts (47), CAP studies (104) and non-PCT studies (73). Finally, after eliminating 4 studies of the CAP of children and 13 studies without required outcomes, a total of 15 stud-ies were selected in this meta-analysis. The
flow diagram of study selection for meta-analy
-Characteristics of the studies
Fifteen studies [14, 16, 19, 24-31] with 6401 adult patients diagnosed with CAP were includ-ed in this meta-analysis. The study period was 2000-2014 and the study samples came fr- om several countries (France, Span, and USA
etc.). The characteristics of the included arti-cles are shown in Table 1. The scoring stan-dards for severity of CAP were PSI (the pneumo-nia severity index), CURB-65 (the “confusion, urea, respiratory and blood pressure” (CURB) score, and age >65) and A-DROP (age, dehydra-tion, respiratory failure, orientation distur-bance, pressure scale).The assay methods of PCT concentration in serum were monoclonal immunoluminometric assay, time-resolved,
and amplified cryptate emission assay etc..
Articles that scores got 6-9, indicating all included studies had higher quality. The research quality of Okimoto et al. [30] was rela-tively low with 6scores, because the study lacked the comparison of baseline differences and the description of result’s assay method.
Identification of pathogen (PCT>0.5 ng/ml)
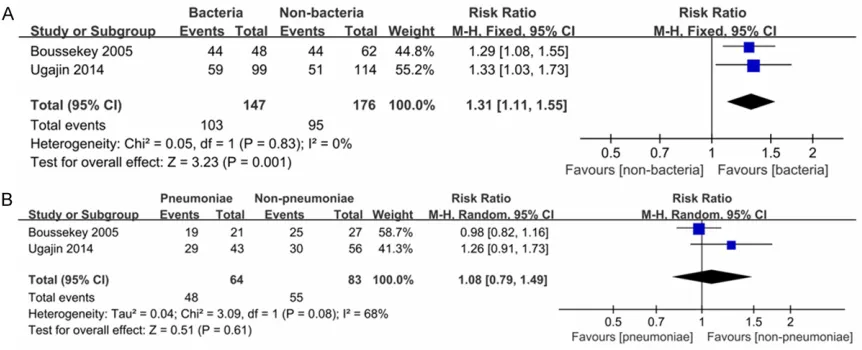
This analysis was use to show that whether the pathogen of CAP could be detected in PCT>0.5 ng/ml. A total of 2 studies [19, 32] report-
ed probability of pathogen’s identification in
[image:4.612.92.523.72.247.2]fixed effect model was used and the pooled result was RR = 1.31 (95% CI: 1.11, 1.55). The
results showed that the number of patients that pathogen could be detected was 1.31 times that of patients that pathogen could not be detected, and there was a statistical differ-ence between patients that pathogen could be detected and patients that pathogen could not
be detected (P = 0.001) (Figure 2A).
Identification of Streptococcus pneumonia (PCT>0.5 ng/ml)
This analysis was use to explain the probability
of identification of Streptococcuspneumonia
(one of the major pathogens of CAP) in PCT>0.5 ng/ml. There were 2 studies [19, 32] reported the probability of Streptococcus pneumonia’ s
identification in PCT>0.5 ng/ml. A total of 147
patients were studied, including 64 pneumonia patients and 83 non-pneumonia patients. Prominent heterogeneity was found between
studies with P = 0.08 and I2 = 68%. Therefore, the random effects model was used and the
pooled result was RR = 1.08 (95% CI: 0.79,
1.49). There was no statistical difference in the probability of Streptococcus pneumonia’s
identification between pneumonia patients and non-pneumonia patients (P = 0.61) (Figure 2B).
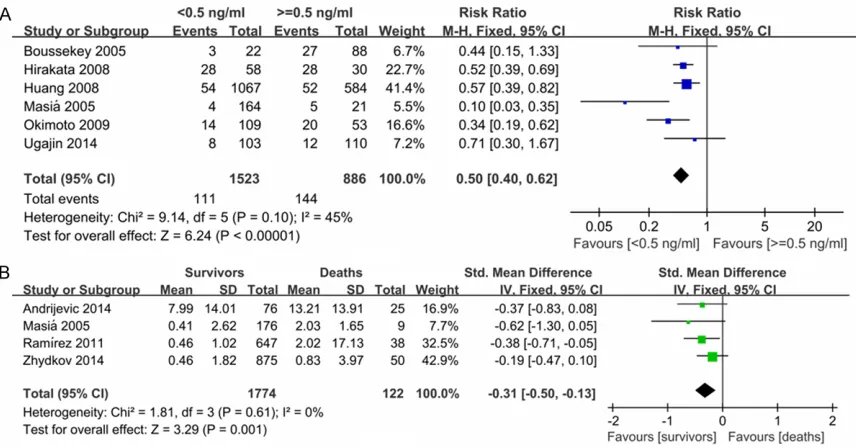
Comparison of the mortality between PCT-positive and PCT-negative patients (PCT<0.5 ng/ml vs. PCT≥0.5 ng/ml)
This comparison was used to explain the rela-tionship between PCT levels and CAP severity (mortality). A total of 6 studies [16, 26, 27, 30, 32] reported mortality between PCT-positive
(PCT<0.5 ng/ml, 1523 patients) and PCT-negative (PCT≥0.5 ng/ml, 886 patients). No
prominent heterogeneity was found between studies with P = 0.10, I2 = 45%. The fixed effect
model was used and the pooled result was RR
= 0.50 (95% CI: 0.40, 0.62). The results sug -gested that the number of patient mortality in
PCT≥0.5 ng/ml was twice that of PCT<0.5 ng/
ml and there was a statistical difference be-
tween PCT<0.5 ng/ml and PCT≥0.5 ng/ml
(Figure 3A). The final result was RR = 0.43 (95% CI: 0.30, 0.62; P<0.01) after trimming a study
which was a retrospective study [32].
Comparison of the PCT levels between survival cases and death cases
[image:5.612.93.521.71.295.2]This comparison was also used to explain the relationship between PCT levels and CAP sever-ity (survival cases and death cases). There were 4 studies [16, 24, 33, 34] reported the difference of PCT levels between survival cases Figure 3. A: Comparison of the mortality between PCT<0.5 ng/ml and PCT≥0.5 ng/ml; B: Comparison of PCT levels
and death cases, and 1774 survival cases and 122 death cases were included in this study. No prominent heterogeneity was present be-
tween studies with P = 0.61, I2 = 0%. Therefore, the fixed effect model was used and the pooled result was SMD = -0.31 (95% CI: -0.50, -0.13).
It suggested that the PCT levels of survival cases were lower than those of death cases, and there was a statistical difference between
survival cases and death cases (P = 0.001)
(Figure 3B).
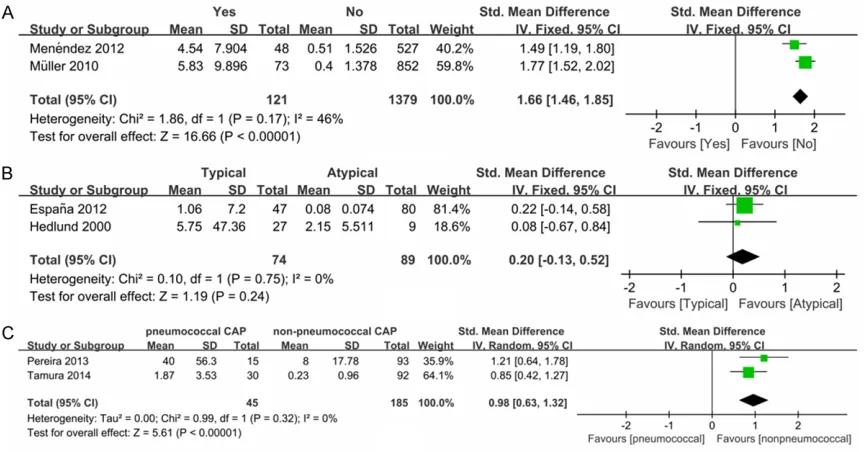
Comparison of the PCT levels between tients that bacteria could be detected and pa-tients that bacteria could not be detected.
This comparison was used to explain the rela-tionship between PCT levels and detection of pathogens. A total of 2 studies [31, 35] report-ed the difference of PCT levels between pa- tients that bacteria could be detected and patients that bacteria could not be detected. There were 121 cases that bacteria could be detected and 1379 cases that bacteria could not be detected in this study. No prominent heterogeneity was present between studies
with P = 0.17, I2 = 46%. Therefore, the fixed effect model was used and the pooled resul-
ts were SMD = 1.66 (95% CI: 1.46, 1.85; P<0.001). It suggested that the PCT levels of
higher than those patients that bacteria could not be detected (Figure 4A).
Comparison of the PCT levels between patients of typical bacteria and patients of atypical bacteria
This comparison was used to explain the rela-tionship between PCT levels and diagnosis of pathogens (typical bacteria or atypical bacte-ria). A total of 2 studies [28, 29] reported the difference of PCT levels between patients of typical bacteria and these of atypical bacteria, and 74 patients were included in typical bacte-ria group and 89 patients were included in atypical bacteria group. No prominent
hetero-geneity was found between studies with P =
0.75, I2 = 0%. Therefore, the fixed effect model was used and the pooled results were SMD = 0.20 (95% CI: -0.13, 0.52; P = 0.24). It indicat -ed that the difference of PCT levels between typical bacteria group and atypical bacteria
group was not significant (Figure 4B).
Comparison of the PCT levels between patients of pneumococcal CAP and patients of non-pneumococcal CAP
[image:6.612.92.526.72.298.2]mococcal CAP). Two studies [14, 25] reported the PCT levels between patients of pneumococ-cal CAP (45 patients) and patients of non-pneu-mococcal CAP (185 patients). No prominent heterogeneity was found between studies with
P = 0.32, I2 = 0%. Therefore, the fixed effect model was used and the pooled results were
SMD = 0.98 (95% CI: 0.63, 1.32; P<0.01). It
indicated that the PCT levels of pneumococcal CAP group were higher than those of non-pneu-mococcal CAP group, and there was a statisti-cal difference between two groups (Figure 4C).
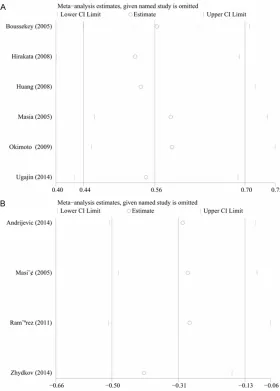
Sensitivity analysis
The sensitivity analysis, in which one study was trimmed at a time, was used to judge the stabil-ity of the results. It showed that this
meta-anal-controls, and injection of drugs that prevent PCT can improve survival [36, 37]. The correla-tions between PCT levels and survival/mortality rate of CAP patients have also been studied in clinical trials [38, 39]. Several studies showed that PCT levels’ increase was a risk factor of
death within the first 48 hours on ICU admis -sion, whereas a decrease had a better outcome [40, 41]. In this study, the number of CAP
mor-tality rate in PCT≥0.5 ng/ml was twice that of PCT<0.5 ng/ml, and PCT levels of death cases were significantly higher than those of survival
cases. Therefore, PCT levels were related with severity of CAP.
[image:7.612.92.372.72.463.2]In our study, the number of CAP patients that pathogen could be detected was 1.31 times that of CAP patients that pathogen could not be Figure 5. Sensitivity analysis. A: Sensitivity analysis of morality; B: Sensitivity
analysis of PCT levels (survivors vs deaths).
ysis result was stable (Figure 5A, 5B).
Discussions
This meta-analysis of 15 pub-lications suggested that PCT levels were related with sever-ity of CAP patients and detec-tion and diagnosis of CAP pathogen. The present study showed that the number of
patient mortality in PCT≥0.5
ng/ml was higher than that of
PCT<0.5 ng/ml [16, 26, 27,
30, 32], PCT levels of death
cases were significantly high -er than those of survival ca- ses [16, 24, 33, 34], PCT lev-els of cases that CAP patho-gen could be detected were notably higher than those of cases that CAP pathogen co-uld not be detected [31, 35], and PCT levels of pneumococ-cal cases were evidently high-er than those of non-pneumo-coccal cases [14, 25].
detected in PCT>0.5 ng/ml, and the PCT levels of pneumococcal CAP group were higher than those of non-pneumococcal CAP group. One study shows that severe bacterial infections are related with increased PCT levels, whereas
non-infectious inflammatory reactions or viral
infections do not or moderately increase serum levels of PCT [8]. Based on 96 patients treated for CAP, Hedlund et al. suggest that measure-ment of PCT may help the physician to distin-guish atypical bacterial etiology from typical
etiology and its PCT threshold is 0.5 μg/l [14].
Besides, Moulin et al. indicate that PCT levels have greater predictive values in differentiation of bacterial infections and viral pneumonia with
above a cut-off 1 μg/ml [42]. Therefore, PCT
levels were related with diagnosis and detec-tion of CAP pathogeny.
There were several strengths in this meta-an- alysis. Firstly, more comprehensive analyses were performed for diagnosis and detection of CAP pathogeny. Secondly, heterogeneity was relatively small. Finally, the results of this analy-sis were stable.
Despite these advantages, some limitations of this meta-analysis should be mentioned. We
could not completely exclude the influence of
heterogeneity, though the heterogeneity of this study was relatively small. Possible sources of heterogeneity were the difference of CAP sever-ity, the difference in evaluation criterion of CAP severity and the difference of measuring meth-od. Besides, there were limited number of stud-ies included in this meta-analysis, so more sub-sequent clinical researches were needed to support our results.
This meta-analysis suggests that serum PCT
levels are significantly related with diagnosis
and detection of CAP pathogen and severity of CAP cases. Therefore, it can provide the basis for the clinical diagnosis of CAP. Because of some strengths and limitations of this study, rigorous research and large samples are need-ed to support our views.
Acknowledgements
The authors acknowledge the financial support
of Welfare Industry Research Program of Ministry of Health (No. 201302017, 2015- 02019). The National Natural Science Fund (No. 81272060) and the Hai Nan Natural
program of the PLA (No. 13QNP171). Beijing
scientific and technologic supernova support -ive project (Z15111000030000/XXJH2015- B100). PLA General Hospital Science and technology innovation nursery Fund Project (16KMM56). PLA logistic major science and technology project (14CXZ005, AWS15J004). Disclosure of conflict of interest
None.
Address correspondence to: Drs. Wei Chen and Tanshi Li, Department of Emergency, PLA General Hospital, 28 Fuxing Road, Haidian District, Beijing 100853, China. Tel: +8601066937224; Fax: +8601066937224; E-mail: [email protected] (WC); [email protected] (TSL)
References
[1] Martin SW and Al-Haddad M. Community-acquired pneumonia. Anaesthesia & Intensive Care Medicine 2013; 14: 457-459.
[2] Bartlett JG and Mundy LM. Community-ac- quired pneumonia. N Engl J Med 1995; 333: 1618-1624.
[3] Lim W, Macfarlane J, Boswell T, Harrison T, Rose D, Leinonen M and Saikku P. Study of community acquired pneumonia aetiology (SCAPA) in adults admitted to hospital: impli- cations for management guidelines. Thorax 2001; 56: 296-301.
[4] Ruiz M, Ewig S, Torres A, Arancibia F, Marco F, Mensa J, Sanchez M and Martinez JA. Severe community-acquired pneumonia: risk factors and follow-up epidemiology. Am J Respir Crit Care Med 1999; 160: 923-929.
[5] Whicher J, Bienvenu J and Monneret G. Pro- calcitonin as an acute phase marker. Ann Clin Biochem 2001; 38: 483-493.
[6] Nijsten MW, Olinga P, de Vries EG, Koops HS, Groothuis GM, Limburg PC, Henk J, Moshage H, Hoekstra HJ and Bijzet J. Procalcitonin be-haves as a fast responding acute phase pro-tein in vivo and in vitro. Crit Care Med 2000; 28: 458-461.
[7] Oberhoffer M, Stonans I, Russwurm S, Stonane E, Vogelsang H, Junker U, Jäger L and Reinhart K. Procalcitonin expression in human periph-eral blood mononuclear cells and its modula-tion by lipopolysaccharides and sepsis-related cytokines in vitro. J Lab Clin Med 1999; 134: 49-55.
[9] Gendrel D and Bohuon C. Procalcitonin, a marker of bacterial infection. Infection 1997; 25: 133-134.
[10] Schuetz P, Christ-Crain M, Thomann R, Falconnier C, Wolbers M, Widmer I, Neidert S, Fricker T, Blum C and Schild U. Effect of procal-citonin-based guidelines vs standard guide-lines on antibiotic use in lower respiratory tract infections: the ProHOSP randomized controlled trial. JAMA 2009; 302: 1059-1066.
[11] Briel M, Schuetz P, Mueller B, Young J, Schild U, Nusbaumer C, Périat P, Bucher HC and Christ-Crain M. Procalcitonin-guided antibiotic use vs a standard approach for acute respira-tory tract infections in primary care. Arch Int Med 2008; 168: 2000-2007.
[12] Jones AE, Fiechtl JF, Brown MD, Ballew JJ and Kline JA. Procalcitonin test in the diagnosis of bacteremia: a meta-analysis. Ann Emerg Med 2007; 50: 34-41.
[13] Meisner M, Tschaikowsky K, Palmaers T and Schmidt J. Comparison of procalcitonin (PCT) and C-reactive protein (CRP) plasma concen-trations at different SOFA scores during the course of sepsis and MODS. Crit Care 1999; 3: 45.
[14] Hedlund J and Hansson LO. Procalcitonin and C-reactive protein levels in community-acqu- ired pneumonia: correlation with etiology and prognosis. Infection 2000; 28: 68-73.
[15] Christ-Crain M, Stolz D, Bingisser R, Muller C, Miedinger D, Huber PR, Zimmerli W, Harbarth S, Tamm M and Muller B. Procalcitonin guid-ance of antibiotic therapy in community-ac-quired pneumonia: a randomized trial. Am J Respir Crit Care Med 2006; 174: 84-93. [16] Masiá M, Gutierrez F, Shum C, Padilla S,
Navarro JC, Flores E and Hernández I. Use- fulness of procalcitonin levels in community-acquired pneumonia according to the patients outcome research team pneumonia severity index. Chest J 2005; 128: 2223-2229.
[17] Polzin A, Pletz M, Erbes R, Raffenberg M, Mauch H, Wagner S, Arndt G and Lode H. Procalcitonin as a diagnostic tool in lower re-spiratory tract infections and tuberculosis. Eur Respir J 2003; 21: 939-943.
[18] Brunkhorst F, Al-Nawas B, Krummenauer F, Forycki Z and Shah P. Procalcitonin, C-reactive protein and APACHE II score for risk evaluation in patients with severe pneumonia. Clin Micro-biol Infect 2002; 8: 93-100.
[19] Boussekey N, Leroy O, Georges H, Devos P, d’Escrivan T and Guery B. Diagnostic and Prognostic Values of Admission Procalcitonin Levels in Community-Acquired Pneumonia in an Intensive Care Unit. Infection 2005; 33: 257-263.
[20] Wells GA, Shea B, O’connell D, Peterson JEA, Welch V, Losos M, Tugwell P. The
Newcastle-Ottawa Scale (NOS) for assessing the quality of nonrandomised studies in meta-analyses, 2000.
[21] Higgins JP, Thompson SG, Deeks JJ and Altman DG. Measuring inconsistency in meta-analy-ses. BMJ 2003; 327: 557.
[22] Collaboration C. Review Manager (RevMan). 5.3. Copenhagen: The Nordic Cochrane Centre 2014.
[23] StataCorp L. Stata version 12.0. College sta-tion. TX: StataCorp LP 2011.
[24] Andrijevic I, Matijasevic J, Andrijevic L, Kovacevic T and Zaric B. Interleukin-6 and pro-calcitonin as biomarkers in mortality predic-tion of hospitalized patients with community acquired pneumonia. Ann Thorac Mede 2014; 9: 162-7.
[25] Espana P, Capelastegui A, Bilbao A, Diez R, Izquierdo F, De Goicoetxea ML, Gamazo J, Medel F, Salgado J and Gorostiaga I. Utility of two biomarkers for directing care among pa-tients with non-severe community-acquired pneumonia. Eur J Clin Microbiol Infect Dis 2012; 31: 3397-3405.
[26] Hirakata Y, Yanagihara K, Kurihara S, Izumikawa K, Seki M, Miyazaki Y and Kohno S. Comparison of usefulness of plasma procalci-tonin and C-reactive protein measurements for estimation of severity in adults with communi-ty-acquired pneumonia. Diagn Microbiol Infect Dis 2008; 61: 170-174.
[27] Huang DT, Weissfeld LA, Kellum JA, Yealy DM, Kong L, Martino M, Angus DC; GenIMS Investigators. Risk prediction with procalcito-nin and clinical rules in community-acquired pneumonia. Ann Emerg Med 2008; 52: 48-58, e42.
[28] Menéndez R, Sahuquillo-Arce JM, Reyes S, Martínez R, Polverino E, Cillóniz C, Córdoba JG, Montull B and Torres A. Cytokine activation
patterns and biomarkers are influenced by mi -croorganisms in community-acquired pneumo-nia. Chest J 2012; 141: 1537-1545.
[29] Müller F, Christ-Crain M, Bregenzer T, Krause M, Zimmerli W, Mueller B and Schuetz P. Procalcitonin levels predict bacteremia in pa-tients with community-acquired pneumonia: a prospective cohort trial. Chest J 2010; 138: 121-129.
[30] Okimoto N, Hayashi Y, Ishiga M, Nanba F, Kishimoto M, Yagi S, Kurihara T, Asaoka N and Tamada S. Procalcitonin and severity of com-munity-acquired pneumonia. J Infect Chemoth-er 2009; 15: 426-427.
[31] Pereira JM, Teixeira-Pinto A, Basílio C, Sousa-Dias C, Mergulhão P and Paiva JA. Can we pre-dict pneumococcal bacteremia in patients with severe community-acquired pneumonia? J Crit Care 2013; 28: 970-974.
procalci-tonin test and common biomarkers for the clinical outcomes of community-acquired pne- umonia. Respir Care 2013; 59: 564-73. [33] Ramírez P, Ferrer M, Martí V, Reyes S, Martínez
R, Menendez R, Ewig S and Torres A.
Inflam-matory biomarkers and prediction for intensive care unit admission in severe community-ac-quired pneumonia*. Crit Care Mede 2011; 39: 2211-2217.
[34] Zhydkov A, Christ-Crain M, Thomann R, Hoess C, Henzen C, Zimmerli W, Mueller B, Schuetz P; ProHOSP Study Group. Utility of procalcitonin, C-reactive protein and white blood cells alone and in combination for the prediction of clini-cal outcomes in community-acquired pneumo-nia. Clin Chem Lab Med 2015; 53: 559-566. [35] Tamura M, Watanabe M, Nakajima A, Kurai D,
Ishii H, Takata S, Nakamoto K, Sohara E,
Honda K and Nakamura M. Serial quantifica -tion of procalcitonin (PCT) predicts clinical out-come and prognosis in patients with communi-ty-acquired pneumonia (CAP). J Infect Che-mother 2014; 20: 97-103.
[36] Nylen ES, Whang KT, Snider RH, Steinwald PM, White JC and Becker KL. Mortality is increased by procalcitonin and decreased by an antise-rum reactive to procalcitonin in experimental sepsis. Crit Care Med 1998; 26: 1001-1006. [37] Wagner KE, Martinez JM, Vath SD, Snider RH,
Nylén ES, Becker KL, Müller B and White JC. Early immunoneutralization of calcitonin pcursors attenuates the adverse physiologic re-sponse to sepsis in pigs. Crit Care Med 2002; 30: 2313-2321.
[38] Cheval C, Timsit J, Garrouste-Orgeas M, Assicot M, De Jonghe B, Misset B, Bohuon C and Carlet J. Procalcitonin (PCT) is useful in predicting the bacterial origin of an acute circulatory failure in critically ill patients. Intensive Care Med 2000; 26: S153-S158.
[39] Pettilä V, Hynninen M, Takkunen O, Kuusela P and Valtonen M. Predictive value of procalcito-nin and interleukin 6 in critically ill patients with suspected sepsis. Intensive Care Med 2002; 28: 1220-1225.
[40] Harbarth S, Holeckova K, Froidevaux CL, Pittet D, Ricou B, Grau GE, Vadas L, Pugin J; Geneva Sepsis Network. Diagnostic value of procalcito-nin, interleukin-6, and interleukin-8 in critically ill patients admitted with suspected sepsis. Am J Respir Crit Care Med 2001; 164: 396-402.
[41] Claeys R, Vinken S, Spapen H, ver Elst K, Decochez K, Huyghens L and Gorus FK. Plasma procalcitonin and C-reactive protein in acute septic shock: clinical and biological cor-relates. Crit Care Med 2002; 30: 757-762. [42] Moulin F, Raymond J, Lorrot M, Marc E, Coste J,