A Machine Learning based Approach to Evaluating Retrieval Systems
Huyen-Trang Vu and Patrick Gallinari Laboratory of Computer Science (LIP6)
University of Pierre and Marie Curie 8 rue du capitaine Scott, 75015 Paris, France
{vu,gallinar}@poleia.lip6.fr
Abstract
Test collections are essential to evaluate Information Retrieval (IR) systems. The relevance assessment set has been recog-nized as the key bottleneck in test col-lection building, especially on very large sized document collections. This paper addresses the problem of efficiently se-lecting documents to be included in the assessment set. We will show how ma-chine learning techniques can fit this task. This leads to smaller pools than tradi-tional round robin pooling, thus reduces significantly the manual assessment work-load. Experimental results on TREC col-lections1 consistently demonstrate the ef-fectiveness of our approach according to different evaluation criteria.
1 Introduction
The effectiveness of retrieval systems is often justi-fied by benchmark test collections. A standard test collection consists of lots of documents, a set of in-formation needs, called topics and human judgment about the relevance status of each document for a topic. Nowadays, it is relatively easy to gather huge set of millions of documents and hundreds of topics. The key obstacle for forming large sized test col-lections lies therefore in the topic assessment pro-cedure. Assessing the whole document sets is un-feasible, even for small sized collection of 800,000 documents (Voorhees and Harman, 1999). In order to keep the assessment process practical, one often
1http://trec.nist.gov
selects a certain number of documents for judgment. This is called (document) pooling and the outcome the pool or the qrels (query relevance set). The col-lected documents are then judged by humans, doc-uments outside the pool are assumed non relevant. A representative pool is therefore essential to the whole evaluation process.
This paper proposes a method to form the assess-ment set with the support of machine learning algo-rithms. Based on relevance judgments of relatively shallow pools, a ranking algorithm will attempt to give priority for relevant documents so that the as-sessment set can be fixed at a feasible size without skewing the system evaluation result. The judgment process is indeed kept as much subjective-free as possible: the first relevance feeback step is designed appropriately so that the assessor cannot give any bias towards any particular rank or any system, the learning process is completely transparent to the as-sessors and parameters of the ranking function are collection-tailored rather than exported from previ-ous collections.
The method will then be evaluated on TREC ad-hoc collections. Results from our comprehensive experiment confirm that the qrels generated by our method are much more representative than those of the same size by the TREC method. The outcome qrels is substantially smaller, so much cheaper to produce than the official TREC qrels, yet their con-clusions about system effectiveness are quite com-patible.
The remaining of this paper is organized as fol-lows. We review related work in Section 2. Sec-tion 3 presents the general framework of apply-ing machine learnapply-ing techniques to formapply-ing test collections. We also give a brief introduction
about RankBoost (Freund et al., 2003) and Rank-ing SVM (Joachims, 2002b), the two learnRank-ing algo-rithms used in our experiment. Section 4 introduces data sets and experimental setup. Section 5 is ded-icated to present experimental results according to different evaluation criteria. Precisely, Section 5.1 shows the capacity of small pools on identifying rel-evant documents and Section 5.2 illustrates their im-pact on system comparison; Section 5.3 presents sta-tistical validation tests. We conclude and discuss perspectives in Section 6.
2 Related work
2.1 TREC methodology
Since the seminal work of test collection forming in 1975 (Sparck Jones and Van Rijsbergen, 1975), pooling has been outlined as the main approach to form the assessment set. The simple solution of round robin pooling from different systems pro-posed in that report has been adopted in most exist-ing IR evaluation forums such as TREC, CLEF2 or NTCIR3. For convenience, we will denote that strat-egy as TREC-style pooling. To have the assessment set, from submissions (restricted length L = 1000 for most TREC tracks), only n top documents per submission are pooled. Despite different technical tricks to control the final pool size such as gathering only principal runs or reducing the value of n, the assessment procedure is still quite time-consuming. In TREC 8 ad-hoc track, for example, despite lim-iting the pool depth n at 100 and gathering only 71 of 129 submissions, each assessor has to work with approximately 1737 documents per topic (precisely, between 1046 and 2992 documents). Assuming that it takes on average 30 seconds to read and judge a document, the whole judgment procedure for this topic set can therefore only terminate after a round-the-clock month. Meanwhile, a simple analysis on the ad-hoc collections from TREC-3 to TREC-8 re-vealed that there are on average 94% documents judged as non relevant. Since most of existing ef-fectiveness measures do not take into account these non relevant documents, it would be bettter to not waste effort on judging non relevant documents pro-vided that the quality of test collections is always
2http://www.clef-campaign.org/ 3http://research.nii.ac.jp/ntcir/
conserved. Several advanced pool sampling meth-ods have been proposed but due to some common drawbacks, none of them has been used in practice.
2.2 Topic adaptive pooling
Zobel (Zobel, 1998) forms the shallow pools accord-ing to the TREC methodology. When there are enough judged documents (up to the set of 30 top documents per run in his experiment), an extrapo-lation function will then be estimated to predict the number of unpooled relevant documents. The idea is to judge more documents for topics that have high potential to have relevant documents else. Carterette and Allan (Carterette and Allan, 2005) have recently replaced that extrapolation function by statistical tests to distinguish runs. This method produced in-teresting empirical outcomes on TREC ad-hoc col-lections, lack however a sound theoretical basis and is clearly of very high complexity due to iterative statistical tests of every run pairs. Furthermore, this incremental/online pooling approach raises a major concern about the unbiasness requirement from the human judgment as the assessors know well that documents come later are of lower ranks, thus of lower relevance possibility.
2.3 System adaptive pooling
Cormack et al. (Cormack et al., 1998) propose the so-called Move-To-Front (MTF) heuristic to give priority for documents based on the correspond-ing system performance. In their experiment, the latter factor has been simply the number of non relevant documents this system has intro-duced to the pool since the last relevant document. Aslam et al. (Aslam et al., 2003) formulate this pri-ority rule by adopting an online learning algorithm called Hedged (Freund and Schapire, 1997).
on-line paradigm. The second difference lies in the way of estimating the ranking function. It is widely ac-cepted that machine learning techniques can deliver more reliable model on previously unseen data given much less training instances than any classical statis-tical techniques or expert rules can.
2.4 Generate pseudo assessment set
Several evaluation methodologies, especially for web search engines, have been proposed to evaluate systems without relevance judgment. These propos-als can be grouped into two main categories. The first (Soboroffet al., 2001; Wu and Crestani, 2003; Nuray and Can, 2006) exploits internal information of submissions. The second (Can et al., 2004; Joachims, 2002a; Beitzel et al., 2003) benefits
ex-ternal resources such as document and query
con-tent, or those of web environment. We skip the sec-ond category since these resources are not available in generic situations.
Soboroff et al. (Soboroffet al., 2001)
sam-ple documents of a shallow pool (top ten
documents returned by retrieval systems)
based on statistics from past qrels. Wu and Crestani (Wu and Crestani, 2003), Nuray and Can (Nuray and Can, 2006) adopt metasearch strategies on document position. A certain number of top out-come documents will then be considered as relevant without any human verification. Different voting schemes have been tried in the two aformentioned papers. Their empirical experiment illustrated how the quality of these pseudo-qrels is sensible to the chosen voting scheme and to other parameters such as the pool depth or the diversity of systems used for fusion. They also confirm that pseudo-qrels are often unable to identify best systems.
In sum, the thorough literature review confirmed the importance of relevance assessment sets in IR evaluation yet the lack of an appropriate solution to have a reliable set given a moderate amount of judg-ment resource.
3 Machine learning based Pooling
3.1 General framework
Let M denote the topic set size available for the training purpose, N the number of participating sys-tems, k1the pool depth to get the training data from
any participating system and K the final pool size.
The training process consists of two main steps. Firstly, for each training topic, k1 first documents
of all N systems are gathered and the assessors are asked to assess all of these documents. LetT denote the outcome of this assessing step on all M topics. From the information ofT, a function f will then be learned which assigns to each document a value cor-responding to its relevance degree for a given query.
At the usage time, for each given topic, the whole retrieved list of N systems will be fused. These doc-uments will then be sorted in the decreasing order of their values according to f and the K top documents will be sent to the assessor for judgment. This last set of judgements will be the qrels used for the sys-tem evaluation.
In the training framework, it is clear that the sec-ond step plays the major role. An effective scoring function can substantially save the workload at the last assessment step. We will now focus on methods for estimating such scoring function.
3.2 Document ranking principle
The scoring function f can be estimated in diff er-ent ways as seen in the last section. In this study, we adopt the learning-to-rank paradigm for estimat-ing this scorestimat-ing function. The principle of document ranking will be sketched in this section. The next sub-section will introduce the two specific ranking algorithms used in our experiment.
A ranking algorithm aims at estimating a function which describes correctly all partial orders inside a set of elements. An ideal ranking in information re-trieval must be able to place all relevant documents above non relevant ones for a given topic. The prob-lem can be described as follows. For each topic, the document collection is decomposed into two disjoint sets S+ and S− for relevant (non relevant
respec-tively) documents, R and NR are their cardinality. A ranking function H(d) assigns to each document d of the document collection a score value. We seek for a function H(d) so that the document ranking generated from the scores respect the relevance rela-tionship, that is any relevant document has a higher score than any non relevant one. Let “d⊲d′”
objective can therefore be stated as follows.
d+⊲d−⇔H(d+)>H(d−),∀(d+,d−)∈ S+× S−
There are different ways to measure the ranking error of a scoring function h. The natural criterion might be the proportion of misordered pairs (a rele-vant document is below a non relerele-vant one) over the total pair number R.NR. This criterion is an estimate
of the probability of misordering a pair P(d−⊲d+).
RLoss(H)= X
d+∈S+
d−∈S−
D(d+,d−)
d−⊲d+
(1)
= X
∀(d+,d−)
D(d+,d−)
H(d−)> H(d+)
(2)
where~φis 1 ifφholds, 0 otherwise; D(d+,d−)
de-scribes the importance of the pair in consideration, it will be uniform R.1NR if the information is un-known.
In practice, we have to average RLoss over the training topic set. This can be done by either macro-averaging at topic level or micro-macro-averaging at docu-ment pair level. For presentation simplification, this operation has been implicit.
3.3 Discriminative ranking algorithms
Since RLoss is neither continuous nor differentiable, its direct use as a training criterion raises practical difficulties. Also, in order to provide reliable predic-tions on previously unseen data, the prediction error of the learning function has to be bounded with a significant confidence. For both practical and theo-retical reasons, RLoss is then often approximated by a smooth error function.
In this study, we will explore the
per-formance of two ranking algorithms, they
are RankBoost (Freund et al., 2003) and
Ranking SVM (Joachims, 2002b). As far as
we know, these algorithms are actually among a few state-of-the-art ranking learning algorithms whose convergence and generalization properties have been theoretically proved (Freund et al., 2003; Joachims, 2002b; Cl´emenc¸on et al., 2005).
3.3.1 RankBoost
RankBoost (aka RBoost) (Freund et al., 2003) re-turns a scoring function for each document d by min-imizing the following exponential upper bound of
the ranking error RLoss (Eq. (2)):
ELoss(H)= X
(d+,d−)
D(d+,d−)eH(d−)−H(d+) (3)
This is an iterative algorithm like all other boosting methods (Freund and Schapire, 1997). The global ranking function of a document d is a linear combi-nation of all base functions H(d)=PT
t=1αtht(d). At each iteration t, a new training data sample is gener-ated by putting more weight D(., .) on difficult pairs (d+,d−). A scoring function ht is proposed (it can even be chosen among the features used to describe documents) and the weightαt is estimated in order to minimize the ELoss at that iteration.
RBoost has virtues particularly fitting the pool-ing task. First, it can operate on relative values. Second, it does not impose any independence as-sumption between combined systems. Finally, in the case of binary relevance judgment which usu-ally occurs in IR, there is an efficient implementa-tion of RBoost whose complexity is linear in terms of the training instance number (cf: the original text (Freund et al., 2003)).
3.3.2 Ranking SVM
Ranking SVM (Joachims, 2002b), rSVM for short, is a straightforward adaptation of the max-margin principle (Vapnik, 2000) to pairwise object ranking. The score function is often assumed to be linear in some feature space, that is H(d)=wTΨ(d) where w is the vector of weights to be estimated and Ψis a feature mapping. The max-margin approach minimizes the following approximation of RLoss:
rSVMLoss(H)=maxn1+H(d−)−H(d+)
,0o (4) for all pairs (d+,d−) while at the same time
control-ling the complexity of function space described via the norm of vector w for generalization objective.
Notice that rSVM does not explicitly support rank values as does RBoost. Nevertheless, we will see later that the discriminative nature allows rSVM to work quite well on features merely deduced from rank values. Its behavior difference is in fact ignor-able in comparison with RBoost.
4 Experimental setup
could be useful. In this paper, we will however fo-cus on TREC traditional ad-hoc retrieval collections. Experiments have been performed on the three cor-pora TREC-6, TREC-7 and TREC-8. Statistics about the number of runs, of judgments, of rele-vant documents are shown in Tab. 1. Due to limit of space, we will detail results on the TREC-8 case and only mention the results on the two others.
#runs #judgments #rel. docs Depth-5
TREC 6 79 1445.4 92.2 144.3
TREC 7 103 1606.9 93.5 114.6
TREC 8 129 1736.6 94.6 143.4
Table 1: Information about three TREC ad-hoc col-lections. The three last columns are averaged over the topic set size (50 topics/collection).
Training data is gathered from the top five an-swers of each run. The pool depth of five has been arbitrarily chosen to have both sufficient training data and to eliminate potential bias from assessors towards a particular system or towards early iden-tified answers while judging a shallow pool. Fur-thermore, this training data set is large enough for testing the ranking algorithm efficiency.
Each document is described by an N-dimensional feature vector where N is the number of participat-ing systems. The jth feature value for a document
is a function of its position in the retrieved list, ties are arbitrary broken. A document at rank i is as-signed a feature value of (L+1−i) where L is the
TREC limit of submission run (L is usually set up at 1000). Documents outside submission runs receive the zero feature value (i.e. it is assumed to be at rank (L+ 1)). For implementation speed, the input for rSVM is further scaled down to the interval [0,1].
Due to the small topic set size, we use a
leave-one-out training strategy: a model will be trained
for each topic by using judgments of all other top-ics. The training data set size is presented in the last column of Tab. 1. The workload for training dataset does not exceed the effort for assessing 5 topics in the full pool of TREC.
We employ SVMlight package4 for rSVM.
We adopt the efficient RBoost version for bi-nary feedback and bibi-nary base functions ht (cf. (Freund et al., 2003)), boosting is iterated 100
4http://svmlight.joachims.org
times and we impose positive weighting for all coef-ficientsαt.
The non-interpolated average precision (MAP) has been chosen to measure system perfor-mance5. This metric has been shown to be
highly stable and reliable with both small topic set size (Buckley and Voorhees, 2000)
and very large document
collec-tions (Hawking and Robertson, 2003).
RBoost and rSVM pools will be compared to the TREC-style pools of the same size. We also include “local MTF” (Cormack et al., 1998) in the experi-ment. The “global MTF” has been shown to slightly outperform the local version in the aforementioned paper. However, we believe that the global mode is merely for demonstration but unlikely practical of online judgment since it insists that all queries are judged simultaneously with a strict synchroni-sation among all assessors. Hereafter, for simplic-ity, the TREC-style pool of the first n documents retrieved by each submission will be denoted by Depth-n, the equivalent pool (with the same aver-age final pool size m over the topic set) produced by RBoost, rSVM or MTF will be RBoost-m, rSVM-m or MTF-m respectively. In all figures in the next sec-tion, the abscissa denotes the pool size m and values of n will be present along the Depth-n curve.
5 Experimental results
This section will examine small pools produced ei-ther by the TREC method or by RBoost/rSVM/MTF from two angles: their pooling performance and their influence on system comparison result.
5.1 Identify relevant documents
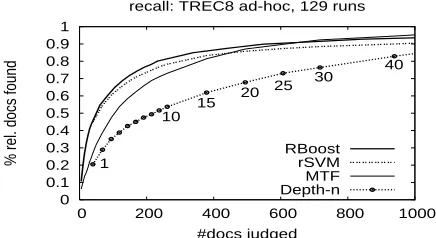
Fig. 1 shows the ratio of relevant documents re-trieved by different pooling methods (i.e. the re-call). The curves obtained by RBoost and rSVM are quite similar and much higher than that by TREC methodology. The curve of MTF is in the middle of RBoost/rSVM and Depth-n at the beginning and then catches that of RBoost at the pools of about 600 documents.
0 0.1 0.2 0.3 0.4 0.5 0.6 0.7 0.8 0.9 1
0 200 400 600 800 1000
% rel. docs found
#docs judged
recall: TREC8 ad-hoc, 129 runs
1
10
15 20
25 30
40
[image:6.612.77.295.65.184.2]RBoost rSVM MTF Depth-n
Figure 1: Along the incrementally enlarged pools:
relevant documents identified in comparison with
the full assessment set.
5.2 Correlation of system rankings
Once the pool is obtained by a given method, the assessor will give relevance judgment for all docu-ments of that pool, called qrels for the outcome. This qrels will be used as the ground truth to measure ef-fectiveness of a retrieval system.
0.7 0.75 0.8 0.85 0.9 0.95 1
0 200 400 600 800 1000
Kendall’s
τ
qrels size
sys. ranking, MAP: TREC8 ad-hoc, 129 runs
1 2
7 10 15 20 25
RBoost rSVM MTF Depth-n
Figure 2: Kendall’sτcorrelation of system ranking according to different qrels methods in comparison with that produced by the full assessment set.
The simplest way to compare different sys-tems is to sort them by the decreasing eff ective-ness values. The correlation of each two sys-tem rankings will then be quantified through a correlation statistic. In this study, we follow TREC convention (Buckley and Voorhees, 2004; Carterette and Allan, 2005), that is taking the 0.9 value of Kendall’s τ as the sufficient threshold to conclude that the difference of two system rankings is ignorable. We compare here the system ranking obtained by the official TREC qrels with those by Depth-n where n varies from 1 to 100. We then
re-place Depth-n by RBoost-m, rSVM-m and MTF-m. The results are shown in Fig. 2 for TREC-8 and in Tab. 2 for the 7 first pool depths. We observe from the figure the similar order of pooling methods as seen in the previous section. The MTF curve meets those of RBoost and rSVM from qrels of more than 400 documents. The results obtained on the two col-lections of TREC-6 and TREC-7 are in line with those observed on TREC-8 (Tab. 2).
It is clear that system ranking correlation quan-tified by any rank correlation statistics provides necessary but not sufficient information about sys-tem comparison. Ranking systems by their sam-ple means is indeed the simsam-plest way with at least two implicit assumptions. First, runs have
simi-lar variances, this usually does not hold in practice
even after discarding poorest runs. Second, all run swaps have the same importance without taking into account their statistically significant difference and
their positions in the system ranking. In practice, swap of adjacent systems does not make much sense if they are not significantly different to each other according to statstical tests. The next section will be devoted to further statistical validations.
5.3 Statistical Validations
5.3.1 Significant difference detection
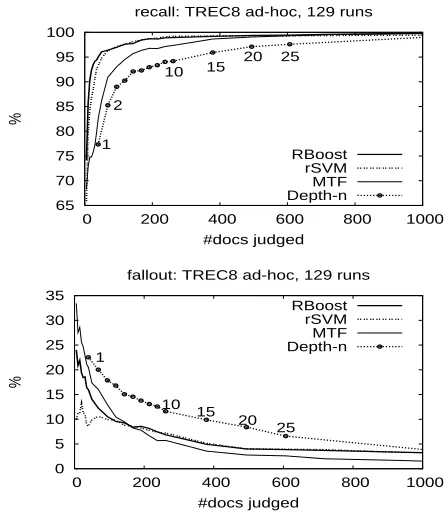
We register for a given qrels all system pairs which are significantly different on the topic set. The quality of a qrels can be measured by the similarity of this significant difference detection in compari-son with that obtained by the official TREC qrels. We carry out the paired t-test for each pair of runs with 95% significance level. The recall and the false alarm rate of these detections are shown in Fig. 3. In terms of recall, RBoost and rSVM qrels are much more better than its TREC-style counterparts and MTF is in the middle. In terms of false alarm rate, there are some changes concerning rSVM and MTF. Precisely, rSVM at small qrels of less than 100 doc-uments is the best whilst that is MTF qrels of more than 150 documents.
5.3.2 Tukey grouping
This multicomparison test6 aims to group runs based on their statistical difference. We concentrate
[image:6.612.75.296.359.480.2]TREC-6 (79 sys.) TREC-7 (103 sys.) TREC-8 (129 sys.)
n m D-n MTF SVM RBst m D-n MTF SVM RBst m D-n MTF SVM RBst
1 37 .835 .843 .888 .914 32 .788 .809 .888 .891 40 .733 .805 .927 .909
2 66 .875 .899 .925 .934 56 .831 .890 .920 .922 68 .829 .877 .939 .933
3 93 .892 .925 .939 .956 76 .851 .918 .931 .935 95 .864 .903 .948 .946
4 118 .903 .940 .949 .967 95 .876 .926 .935 .947 119 .877 .921 .951 .953
5 144 .907 .949 .958 .972 115 .884 .936 .942 .954 143 .896 .933 .959 .955
6 170 .915 .953 .961 .974 133 .894 .942 .951 .957 168 .898 .940 .963 .963
[image:7.612.78.537.56.151.2]7 195 .925 .959 .967 .977 152 .903 .950 .956 .962 191 .901 .946 .967 .966
Table 2: Kendall’s τ obtained on small qrels. D-n: TREC-style Depth-n qrels, SVM: rSVM-m; RBst: RBoost-m.
65 70 75 80 85 90 95 100
0 200 400 600 800 1000
%
#docs judged
recall: TREC8 ad-hoc, 129 runs
1 2
10 15
20 25
RBoost rSVM MTF Depth-n
0 5 10 15 20 25 30 35
0 200 400 600 800 1000
%
#docs judged
fallout: TREC8 ad-hoc, 129 runs
1
10 15
20 25 RBoost
rSVM MTF Depth-n
Figure 3: Comparing qrels of RBoost-m, rSVM-m, MTF-m and Depth-n in terms of pairs of signifi-cantly different systems: recall (top) and false alarm rate (bottom)
particularly on the top group, called group A which consists of runs on which there is not enough
evi-dence to conclude that they are statistically
signifi-cantly worse than the top run. In practice, this fig-ure will be meaningful if it is around 10 (one often says about the top 10 runs). It will however become meaningless if the group A is too large, for exam-ple contains more than half of systems in consider-ation. Note that Tukey test relies on the assump-tion of Equality of Variances. This requirement can not be completely satisfied in practice, even after
0 10 20 30 40 50 60 70 80
0 200 400 600 800 1000
card. of group A
#docs judged
sys. grouping, MAP: TREC8 ad-hoc, 129 runs
1 4
7 (57)
10 15
20 25 RBoost
[image:7.612.79.302.207.463.2]rSVM MTF Depth-n
Figure 4: Cardinality of group A (95% confidence level) after the arcsine-root data transformation.
some data transformation such as arcsine-root or us-ing rank values.
The size of group A on TREC-8 collection is shown in Fig. 4. We observe from that figure the stability of the two curves of RBoost and rSVM, this implies that the two qrels RBoost-35 and rSVM-35 which have both satisfied the 0.9 requirement of Kendall’sτcan replace the official TREC qrels. The effort saving is therefore a factor of 50 (if ignoring the cost of training data set preparation) and of 10.5 otherwise. MTF needs qrels of at least 168 docu-ments to produce comparable group A’s with that of the official TREC qrels. The Depth-n pools how-ever should not be recommended with less than 1000 documents in total (i.e. pooling more than 40 top documents per run).
6 Conclusions and Discussion
[image:7.612.317.536.217.332.2]comparison with the counterpart of TREC method-ology and that of MTF.
It is necessary to include other metasearch meth-ods for further study. This will allow us to validate not only the impact of the metasearch training prin-ciple based on pairwise ranking error RLoss but also the capacity of automatic feature selection of the two ranking algorithms used in this paper.
This method needs to be further verified on chal-lenging ad-hoc retrieval scenarios such as Terabyte, Web Topic Distillation or Robust Tracks in TREC context. The hardness of these scenarios involves two main issues. First, the number of document judged relevant varies largely across the whole topic set. Second, some topics might even have no rele-vant document in shallow pools. These matter any statistical inference on shallow pools.
Acknowledgement The authors thank M.-R. Amini,
B. Piwowarski, J. Zobel and the anonymous re-viewers for their thorough comments. We ac-knowledge NIST to make accessible the TREC submissions. This work was supported in part by the IST Programme of the European Commu-nity, under the PASCAL Network of Excellence, IST-2002-506778. The publication only reflects the authors’ views.
References
[Aslam et al.2003] J.A. Aslam, V. Pavlu, and R. Savell. 2003. A unified model for metasearch, pooling, and system evaluation. In Proc. CIKM’03.
[Beitzel et al.2003] S. M. Beitzel, E. C. Jensen, A. Chowdhury, and D. Grossman. 2003. Using titles and category names from editor-driven tax-onomies for automatic evaluation. In Proc. CIKM’03.
[Buckley and Voorhees2000] C. Buckley and E.M. Voorhees. 2000. Evaluating evaluation measure stability. In Proc. SIGIR’00.
[Buckley and Voorhees2004] C. Buckley and E.M. Voorhees. 2004. Retrieval evaluation with incomplete information. In Proc. SIGIR’04.
[Can et al.2004] F. Can, R. Nuray, and A. B. Sevdik. 2004. Automatic performance evaluation of web
search engines. Info. Process. Management,
40(3):495–514, May.
[Carterette and Allan2005] B. Carterette and J. Allan. 2005. Incremental Test Collections. In CIKM’05.
[Cl´emenc¸on et al.2005] S. Cl´emenc¸on, G. Lugosi, and N. Vayatis. 2005. Ranking and scoring using empiri-cal risk minimization. In Proc. COLT’05.
[Cormack et al.1998] G.V. Cormack, Christopher R. Palmer, and C.L.A. Clarke. 1998. Efficient construc-tion of large test collecconstruc-tions. In Proc. SIGIR’98.
[Freund and Schapire1997] Y. Freund and R.E. Schapire. 1997. A decision-theoretic generalization of on-line learning and an application to boosting. J. Compt. Sys.
Sci., 55(1):119–139, August.
[Freund et al.2003] Y. Freund, R. Iyer, R.E. Schapire, and Y. Singer. 2003. An efficient boosting algorithm for combining preferences. J. Mach. Learning Res., 4:933–969, November.
[Hawking and Robertson2003] D. Hawking and
S. Robertson. 2003. On collection size and retrieval effectiveness. Information Retrieval, 6(1):99–105.
[Joachims2002a] Th. Joachims. 2002a. Evaluating re-trieval performance using clickthrough data. In Proc.
SIGIR wshop on Math./Formal Methods in IR.
[Joachims2002b] Th. Joachims. 2002b. Optimizing search engines using clickthrough data. In KDD’02.
[Nuray and Can2006] R. Nuray and F. Can. 2006. Au-tomatic ranking of information retrieval systems using data fusion. Info. Process. Management, 42(3):595– 614, May.
[Soboroffet al.2001] I. Soboroff, Ch. Nicholas, and P. Ca-han. 2001. Ranking Retrieval Systems without Rele-vance Judgments. In Proc. SIGIR’01.
[Sparck Jones and Van Rijsbergen1975] K. Sparck Jones and C. J. Van Rijsbergen. 1975. Report on the need for and provision of an ideal information retrieval test col-lection. Technical Report 5266, Computer Lab., Univ. Cambridge.
[Tague-Sutcliffe and Blustein1995] J. Tague-Sutcliffe and J. Blustein. 1995. A statistical analysis of the TREC-3 data. In Proc. TREC-3.
[Vapnik2000] N. V. Vapnik. 2000. The Nature of
Statisti-cal Learning Theory. Springer-Verlag.
[Voorhees and Harman1999] E.M. Voorhees and D. Har-man. 1999. Overview of the Eighth Text REtrieval Conference (TREC-8). In Proc. TREC 8.
[Wu and Crestani2003] Sh. Wu and F. Crestani. 2003. Methods for Ranking Information Retrieval Systems Without Relevance Judgements. In SAC’03.
[Zobel1998] J. Zobel. 1998. How reliable are the results of large-scale information retrieval experiments? In