Abstract
—
Clustering is a data mining technique of grouping set of data objects into multiple groups or clusters so that objects within the cluster have high similarity, but are very dissimilar to the objects in the other clusters. Fuzzy C-Means is the most widely used method where an element may have partial membership grades in more than one fuzzy cluster. This research work makes use of MATLAB language to produce a fuzzy clustering algorithm for a live URL database into several numbers of clusters. The clusters as well as the membership function has been implemented using MATLAB. The results obtained from the database detect n-clusters to handle the imprecise and ambiguous result. Proposed research work provide a comparative analysis of K-Means, Fuzzy C-Means and Improved Fuzzy C-Means clustering techniques that provide sufficient and accurate data analysis in the field of web log mining. The minimal distance between clusters is determined by using the Hermitian distance method.Index Terms— Web Log Mining, K-Means algorithm, Fuzzy C-Means algorithm, Improved Fuzzy C-Means algorithm
INTRODUCTION
Web Log Mining is a part of Web Mining, which, in turn, is a part of Data Mining. As Data Mining involves the concept of extraction meaningful and valuable information from large volume of data, Web Log mining involves mining the usage characteristics of the users of Web Applications. This extracted information can then be used in a variety of ways such as, improvement of the application, checking of fraudulent elements etc. Web Log Mining is often regarded as a part of the Business Intelligence in an organization rather than the technical aspect. It is used for deciding business strategies through the efficient use of Web Applications. It is also crucial for the Customer Relationship Management (CRM) as it can ensure customer satisfaction as far as the interaction between the customer and the organization is concerned. The major problem with Web Mining in general and Web Log Mining in particular is
the nature of the data they deal with. With the upsurge of Internet in this millennium, the Web Data has become huge in nature and a lot of transactions and usages are taking place by the seconds. Apart from the volume of the data, the data is not completely structured. It is in a semi-structured format so that it needs a lot of preprocessing and parsing before the actual extraction of the required information [6].
1.1 WEB LOG MINING
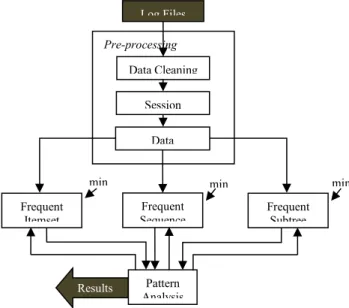
Web log mining, from the data mining aspect, is the task of applying data mining techniques to discover usage patterns from Web data in order to understand and better serve the needs of users navigating on the Web. As every data mining task, the process of Web usage mining also consists of three main steps: (i) preprocessing, (ii) pattern discovery and (iii) pattern analysis. In this work pattern discovery means applying the introduced frequent pattern discovery methods to the log data. For this reason the data have to be converted in the preprocessing phase such that the output of the conversion can be used as the input of the algorithms. Pattern analysis means understanding the results obtained by the algorithms and drawing conclusions.
Pre-processing Log Files
Data Cleaning
Session
Data
Frequent Sequence
Pattern Analysis Frequent
Itemset
Frequent Subtree
min min min
Results
Figure 1.1: Process of Web Log Mining
Development Of Web Log Mining Based On Improved Fuzzy C-Means Clustering
Algorithm
Ashish Gupta, Anil Khandekar
Figure 1.1 shows the process of Web usage mining realized as a case study in this work. As can be seen, the input of the process is the log data. The data has to be preprocessed in order to have the appropriate input for the mining algorithms. The different methods need different input formats, thus the preprocessing phase can provide three types of output data.The frequent patterns discovery phase needs only the Web pages visited by a given user. In this case the sequences of the pages are irrelevant. Also the duplicates of the same pages are omitted, and the pages are ordered in a predefined order.In the case of sequence mining, however, the original ordering of the pages is also important, and if a page was visited more than once by a given user in a user-defined time interval, then it is relevant as well. For this reason the preprocessing module of the whole system provides the sequences of Web pages by users or user sessions[2]. For subtree mining not only the sequences are needed but also the structure of the web pages visited by a given user. In this case the backward navigations are omitted. Only the forward navigations are relevant, which form a tree for each user. After the discovery has been achieved, the analysis of the patterns follows.
The whole mining process is an iterative task which is depicted by the feedback in Figure 1.1. Depending on the results of the analysis either the parameters of the preprocessing step can be tuned (i.e. by choosing another time interval to determine the sessions of the users) or only the parameters of the mining algorithms. The results obtained by the application can be used to form the structure of a portal satisfactorily for advertising reasons and to provide a more personalized Web portal.
1.2 CLUSTERING ANALYSIS
Analysis of clustering is to identify clusters embedded in the data, where a cluster is a collection of data objects that are “similar” to one another. Similarity can be expressed by distance functions, specified by users or experts.
A good clustering method produces high quality clusters to ensure that the inter-cluster similarity is low and the intra-cluster similarity is high. For example, one may cluster the houses in an area according to their house category and geographical locations. The nearest neighbor prediction algorithm simply stated is as follows:
“Objects that are ‘near’ each other will also have similar prediction
values. Thus, if you know the prediction value of one of the objects, you can predict it from its nearest neighbors [7].”
Start
Number of clusters K
Centroids
No object move group Distance objects to centroids
Grouping based on minimum distance
YES End N
O
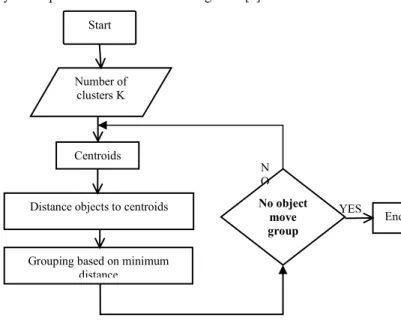
Figure 1.3: Flow diagram of clustering 1.2.1 K-Means Algorithm
Given a database of n objects and k, the number of clusters to form, a partitioning algorithm organizes the objects into k partitions (kn), where each partition represents a cluster. The clusters are formed to optimize an objective-partitioning criterion, often called a similarity function, such as distance, so that the objects within a cluster are
“similar,” whereas the objects of different clusters are “dissimilar”
in terms of the database attributes.
Algorithm: The k-means algorithm is partition based on the mean value of the objects in the cluster.
Input: The number of clusters k and a database containing n objects.
Output: A set of k clusters that minimizes the squared-error criterion.
Method:
1. The dataset is partition into K cluster & dataset is assigned randomly manually or based on some heuristic.
2. For each data points calculate the distance from the data point to each cluster. If the data point is closest to its own cluster, leave it. If the data point is not closest to its own cluster, move it into the closest cluster.
3. Repeat the above step until the complete pass through all the data point result in no data point moving from one cluster to another. At this point, the cluster are stable and the clustering process ends.
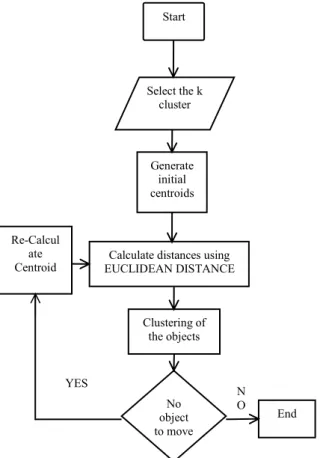
The k-means algorithm takes the input parameter, k and partitions a set of n objects into k clusters so that it results in high intracluster and low intercluster similarity. Cluster similarity is measured in regard to the mean value of the objects in a cluster, which can be viewed as the cluster’s center of gravity [1].
Start
Select the k cluster
Generate initial centroids
No object to move Re-Calcul
ate
Centroid Calculate distances using EUCLIDEAN DISTANCE
Clustering of the objects
End
YES N
O
Figure 1.4: Flow chart of the K-means algorithm 1.2.2 Fuzzy C-Means Algorithm
Fuzzy C-Means iteratively moves the cluster centers to the “right”
location within a data set. Objective function based fuzzy clustering algorithms such as the fuzzy c-means (FCM) algorithm has been used extensively for different tasks such as pattern recognition, data mining, and image processing and fuzzy modeling. Applications have been described from different areas such as financial engineering, direct marketing and systems modeling. Fuzzy clustering algorithms partition the facts and figures set into overlapping groups such that the clusters describe an underlying structure within the facts and figures. In order to get a good presentation from a fuzzy clustering algorithm, a number of matters should be considered. These concern the shape and the volume of the clusters, the initialization of the clustering process, the circulation of the data patterns and the number of clusters in the data[8].
Algorithm
1. Choose the number of the cluster in a given data and determine the cluster center.
2. Calculate the distance of each data to each cluster center.
Using the Euclidean distance formula:
Where and are data points and and cluster points.
3. Determine the distance to nearest cluster to each data.
4. Calculate the membership of individual clusters and finally find the minimum objective function of every cluster so we find the best location for the cluster.
Start
Select the number of cluster
Generate initial cluster
center
No object to move Re-Calculate
Centroid Calculate distances using EUCLIDEAN DISTANCE
Compare two clustering of the
objects
End
YES NO
Figure 1.5: Flow chart of the Fuzzy C-Means algorithm
PROPOSED SOLUTION
2.1 PROPOSED CLUSTER ANALYSIS USING IMPROVED FCM
Improved Fuzzy C-means (FCM) algorithm, in which the data set are taken and cluster will be initialized, normally variable will be selected. The improved FCM is used to form the cluster group by taking some data set. The quality of cluster is calculated by finding the distance measurement.
The improved FCM method are applied in large volume of data and give the true prediction. The objective function is minimized in improved fuzzy c-mean algorithm. The overlapped function is less as compared to other by using the hermitition distance formula. The results are improved by hermitition distance. It give true prediction.
Improved FCM is one of the algorithm which is used in data mining for clustering. The improved FCM algorithm by using two step, first is by decision tree approach with it which mine the data in accurate and sequential manner and second by creating the noise free data.
Cluster validity function are often used to evaluate the performance of clustering in different index and even two different clustering method. Among the criteria there are important type of FCM in which fuzzy partition based sample set. The main idea of validity function based on fuzzy partition is that the less fuzziness of the partition is the better the performance.
An improved FCM algorithm is put forward & applied to deal with dataset on the top of a traditional FCM algorithm. The proposed Algorithm improved the classical FCM Algorithm by adopting a novel strategy for selecting the initial cluster center to solve the
problem of FCM. This algorithm is modified FCM called the improved fuzzy c-mean algorithm depend on the selection of the initial cluster center and the initial membership value. If a good initial cluster center that it is close to the actual final cluster center can be found. Hermitition Distance is an extension method & these technique are expected to have a better performance than conventional method using Euclidean method. The algorithm is an extension of the classical and k-mean clustering method in fuzzy-set domain. Consider the accuracy of dataset we successfully implement the FCM algorithm taking advantage of the basic dataset.
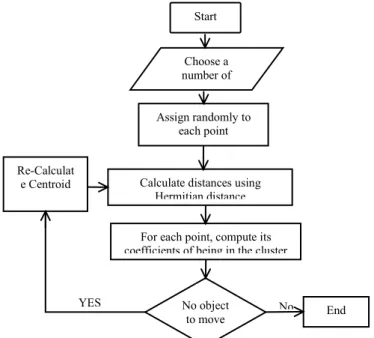
The effectiveness of the FCM algorithm in term of computational rate is improved by modified the cluster and more accurate and precise format.it give a more Explanation and detailed domain information. The major benefit of change in objective function and accurate result in term of DB index and DONE index. Flow chart of the improved fuzzy c-mean algorithm is shown in figure 2.1.
Start
Choose a number of
clusters Assign randomly to
each point coefficients
No object to move Re-Calculat
e Centroid Calculate distances using Hermitian distance
For each point, compute its coefficients of being in the cluster
YES No End
Figure 2.1: Flow chart of the improved fuzzy c-mean algorithm Improved FCM is used to form the cluster group by taking some dataset. The quality of clustering is calculated by finding the distance measure. The proposed FCM is used to form the cluster with less number of iteration .data sets are taken and cluster will be initialize, normally variable will be selected randomly but here tried to avoid selecting the variable randomly. Basically the Fuzzy clustering is useful to mine complex and multidimensional dataset.
Where the member have partial or fuzzy relation. Among the variable developed technique, FCM algorithm is most popular one where a piece of data has partial membership with each of the pre-defined cluster center.
2.2 ALGORITHM FOR PROPOSED WORK
Improved fuzzy c-mean algorithm is put forward and applied to deal with dataset on the top of a traditional fuzzy c-mean algorithm.
1.
First the initial fuzzy partition matrix is generated and the initial fuzzy cluster center are calculated.2.
In each step of iteration the cluster center and the membership grade point are updated and the objective function is minimized to find the best location for the cluster.3.
Improved FCM is proposed cluster technique. It is used to solve the minimal distance by using the Hermitian distance method formula:(2.1) (2.2) Where is a matrix and is a transpose of matrix .
4.
The process stops when the maximum number of iteration isreached or when the objective function improvement between two consecutive iteration is less than the minimum amount of data specified.
The result is in more detailed, precise and better optimized. We focus on the optimization. It will be precisely applicable for the mathematical similarity. The update in the iteration is done using the membership degree as well as the center of the cluster that is the two parameter changes as the steps are being repeated until a set point called the threshold is reached or the process stop when the maximum number of iteration is reached or when the objective function improvement between two consecutive iteration is less than the minimum amount of improvement specified.
RESULT ANALYSIS
3.1 EVALUATION PARAMETERS
Done Index: It is an evaluation parameter & quality index parameter which is the measurement of uniformity of clusters. It aims to identifying dense and well separated cluster. It is defined as the ratio between minimal inter-cluster distances to maximal intra-cluster distance for each partition. It specify the uniformity of cluster.
DB Index: It is an evaluation parameter whose value belongs to 0-1.
It is also known as quality index parameter. It represent the similarity of data. The algorithm that produce cluster will low intra-cluster distance and high inter-cluster distance will have a low Davies–Bouldin index..
3.2 DATA BASE
IP URL Time Referring
URL
Platefo rm
63.251.1 75.215
/portal/handling/
78e68ed12baa9e f7f7d47f9e78869 7ae/
09-09 -2015 02:38
http://ijdacr.
com
Mozilla /5.0
63.251.1 75.215
/portal/handling/
78e68ed12baa9e f7f7d47f9e78869 7ae/
09-09 -2015 02:38
http://ijdacr.
com
Mozilla /5.0
66.249.7 1.175
/advance-risc-mi croprocessorsar m/
09-09 -2015 02:37
http://ijdacr.
com
Mozilla /5.0
1.22.178 .226
/wp-admin/admi n-ajax.php
09-09 -2015 02:35
http://google .com/wp-ad min/index.p hp
Mozilla /5.0
1.22.178 .226
/wp-admin/admi n-ajax.php
09-09 -2015 02:34
http://google .com/wp-ad min/index.p hp
Mozilla /5.0
166.62.2 8.109
/wp-cron.php?do ing_wp_cron=14 41791688.53598 99997711181640 625
09-09 -2015 02:41
http://ijdacr.
com
WordPr ess/4.3;
http://th esiscon cepts.co
m 63.251.1
75.215
/portal/handling/
c40e362561e9ed ad542942b822e7 0621/
09-09 -2015 02:34
Mozilla /5.0
104.128.
138.214
/phd-thesis-writi ng-services/
09-09 -2015 02:34
http://ijdacr.
com
Mozilla /5.0 (Macint
osh;
Intel M 1.22.178
.226
/wp-admin/admi n-ajax.php
09-09 -2015 02:32
http://google .com/wp-ad min/index.p hp
Mozilla /5.0
193.209.
71.2
/favicon.ico 09-09 -2015 02:31
http://ijdacr.
com
Mozilla /5.0
193.209.
71.2
/wpcontent/them es/accesspress-ba sic/images/prev- next.png
09-09 -2015 02:31
http://google .com/
Mozilla /5.0
193.209.
71.2
/wpcontent/plugi ns/accesspress-t witter-feed/css/i mages/bx_loader .gif
09-09 -2015 02:31
http://google .com/
Mozilla /5.0
193.209.
71.2
/wp-content/the mes/accesspress- basic/js/skip-link -focus-fix.js?ver
=20130115
09-09 -2015 02:31
http://google .com/
Mozilla /5.0
193.209.
71.2
/wp-content/uplo ads/2015/09/slid ers-02.png
09-09 -2015 02:31
http://google .com/
Mozilla /5.0 (compat
ible;
MSIE 9.0;
66.249.7 1.153
/modules/forum/f orum.css?nt80ax
09-09 -2015 02:28
Mozilla /5.0
66.249.7 1.164
/ddr3-controller/ 09-09 -2015 02:28
Mozilla /5.0
66.249.7 1.153
/ddr3-controller 09-09 -2015 02:28 171.96.1
70.216
/sites/default/file s/feb13/sr1.pdf
09-09 -2015 03:37
http://www.
google.co.th/
search?q=vh dl+genetic+
algorithm&h l
Mozilla /5.0
171.96.1 70.216
/sites/default/file s/feb13/sr1.pdf
09-09 -2015 03:37
http://www.
google.co
Mozilla /5.0
14.139.2 07.165
/sites/default/file s/volume2/sep%
2013/2.pdf
09-09 -2015 03:29
https://www.
google.co.in/
Mozilla /5.0
3.3 Comperative Result
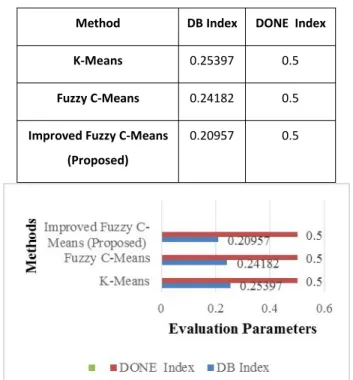
Method DB Index DONE Index
K-Means 0.25397 0.5
Fuzzy C-Means 0.24182 0.5
Improved Fuzzy C-Means (Proposed)
0.20957 0.5
Figure 3.1: Comparative analysis of proposed work using graph method
CONCLUSION
Data Clustering plays a major role in grouping the similar type of data into a specific cluster. Cluster analysis aims at identifying groups of similar objects and, therefore helps to discover distribution of patterns and interesting correlations in large data sets.
Fuzzy clustering is an extension of the cluster analysis, which represents the affiliation of data points to clusters by memberships.
In this research work, a comparative analysis of K-Means, Fuzzy C-Means and Improved Fuzzy C-Means clustering has been adopted using fuzzy relational database to detect clusters on a live URL dataset. The IPs in the database are partitioned in a manner such that similar IPs are in the same cluster. It was found that in Table 6.10 that the Improved Fuzzy C-Means method gives better results in terms of DB Index and Done Index. MATLAB has been used for the definition the membership function, threshold equation and detecting the several clusters.The algorithms are developed in MATLAB for analysis and comparison. The result produced fairly higher accuracy and required less computation. The intention of the algorithm is to provide a categorization of some well–known clustering algorithm. Finally we show our experiment and prove that the improved FCM algorithm technique performance better than other methods.
REFERENCE
[1] Han, Jiawei, Micheline Kamber, and Jian Pei, “Data mining:
concepts and techniques: concepts and techniques”, Elsevier, 2011.
[2] Berson, Alex, and Stephen J. Smith, “Building data mining applications for CRM”, McGraw-Hill, Inc., 2002.
[3] O. Georgieva, F. Klawonn, “Dynamic data assigning assessment clustering of stream data”, pub. in ACM Journal of Soft computing, vol. 8, Iss.4, pp: 1305-1313, September, 2008.
[4] Hristo N. Djidjev, “A scalable multilevel algorithm for graph clustering and community structure detection”, pub. in Springer-Verlag, Algorithms and Models for the Web-Graph Lecture Notes in Computer Science Vol.
4936, pp 117-128, 2008.
[5] Julio Ce. P. G., Felipe P. D, “Ant Colony Algorithm for Clustering through of Cliques”, pub. in proceedings of 8th Mexican International Conference on Artificial Intelligence, (MICAI ,09), 2009.
[6] O. A. Mhd. Jafar, R. Sivakumar, “Ant-based Clustering Algorithms: A Brief Survey”, pub. in International Journal of Computer Theory and Engineering, Vol. 2, No.
5, pp: 17938201, October, 2010.
[7] Xiankun Y., Weihong C., “A Novel Spatial Clustering Algorithm Based on Delaunay Triangulation “, pub. in J.
Software Engineering & Applications, Vol. 3, pp:
141-149, 2010.
[8] Ashish G., Niladri S. M., Susmita G., “Fuzzy clustering algorithms for unsupervised change detection in remote sensing images”, pub. in ELSEVIER, Journal of Information Sciences, 2010.
[9] Dr.N.Rajalingam, K.Ranjini, “Hierarchical Clustering Algorithm - A Comparative Study”, pub. in International Journal of Computer Applications , Vol. 19– No.3, April 2011.
[10]Jiawei Han, Micheline K.,“Data Mining Concepts and Techniques”, Elsevier Publication, 3rd Edition, 2011.
[11]Mamta M., A. K. Sharma, P. Singh, “A Proposed Quartile Clustering Algorithm to Detect Outliers for Large Data Sets”, pub. in proceedings of 5th IEEE International Conference on Advanced Computing & Communication Technologies [ICACCT], Vol. 3, pp:286-290, 2011.
[12]Dewan Md. F., Nouria Ha., “Mining Network Data for Intrusion Detection through Naïve Bayesian with Clustering”, pub. in World Academy of Science, Engineering and Technology, vol. 42, 2011.
[13]Yu Zong, Guandong Xu, “A Projective Clustering Algorithm based on Significant Local Dense Areas”, pub. in proceedings of IEEE World Congress