S1
Migration Villus Crypt
Enterocyte Tuft Goblet
Enteroendocrine Paneth
Progenitor Stem cell
B
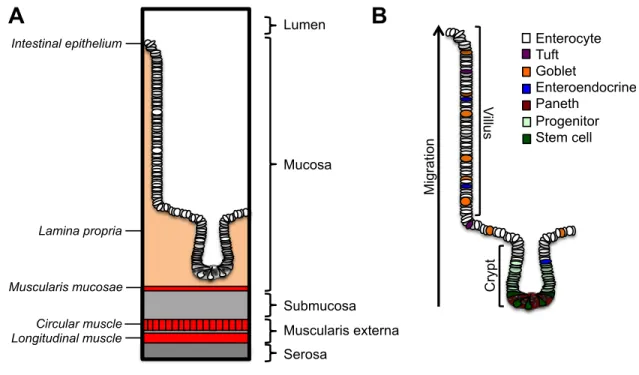
Figure 1.1: The anatomy of the small intestine. (A) The small intestine is composed of four layers organized in a concentric manner (B) The intestinal epithelium consists of a columnar epithelial monolayer organized into microstructures termed crypts and vill. Stem cells residing in the crypt base give rise to progenitor cells that differentiate as the migrate upwards into one of five post mitotic lineages.
Serosa Mucosa Lumen
A
Submucosa Muscularis externa Intestinal epithelium
Lamina propria
Muscularis mucosae Circular muscle Longitudinal muscle
Day: 0.0 0.25 1.0 2.0 3.5
Radiation induced DSBs
formed
DNA repain and P53 dependent
apoptosis
ISCs re-enter cell cycle
ISCs with damaged DNA undergo mitotic catastrophe
ISCs initiate regeneration (Micro-colony Assay) C
B
Non-homologous end joining (NHEJ) Homologous
recombination (HR) Reactive Oxidative
Species (ROS)
DNA Damage (DNA Lesions) Cell Membrane
Damage (lipid peroxidation)
Protein Damage
A
Figure 1.2: The response of the small intestine to radiation damage. (A) Radiation produced reactive oxidative species damage various subcellular components. Organelles are predisposed to lipid peroxidation due to high concentrations of unsaturated fatty acids in their membranes:
endoplasmic reticulum (teal), mitochondria (orange), Golgi (maroon), peroxisome (yellow), lysosome (red).(B) DSB repair is conducted by either by HR or NHEJ. (C) A timeline denoting the behavioral response sequence the small intestinal epithelium undergoes following exposure to high doses of radation
B
S3
Cell Division DNA Synthesis
Stem cell
Daughter Progenitor Cell Stem cell
Immortal Strand
Newly synthesized
strand
Figure 1.3: The “immortal strand hypothesis” states that stem cells retain their genomic DNA and pass along newly synthesized strands to daughter progenitor cells.
CK1 CK1
GSK3β APC AXIN
Frizzled LRP
β-Catenin
TCF WNT
Degradation Transcription β-Catenin GSK3β APC
AXIN
Frizzled LRP
β-Catenin
TCF
Degradation Transcription
β-Catenin
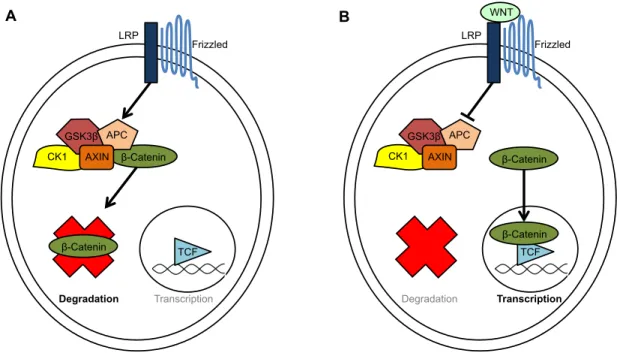
Figure 1.4: Canonical WNT signaling. The transcription of WNT target genes depends on the availability of the transcriptional co-factor β-catenin. (A) β-catenin is targeted for degradation in the absence on WNT. (B) In the presence of WNT, β-catenin is allowed to complex with TCF4 to initiate the transcription of WNT target genes.
A B
S5
Dimeriza ble
Domain High Mo
bility
Gro up Doma
in
Pro
line, Glutamine and Alanine-R ich
Doma
in C-Termi
nus
Central position
1 64 102 181 229 303 339 379 402 509
PHVKRPMNAFMVWAQAARRKLADQYPHLHNAELSKTLGKLWRLLNESEKRRFVEEAERLRVQHKKDHPDYKYQPRRRKS
Nuclear Localization Site 1 Nuclear Export Site Nuclear Localization Site 2
NH2 COOH
1 64 102 181 229 303 339 379 402 509
NH2 COOH
Phosphorylation site Ubiquination/Sumolyation
A
B
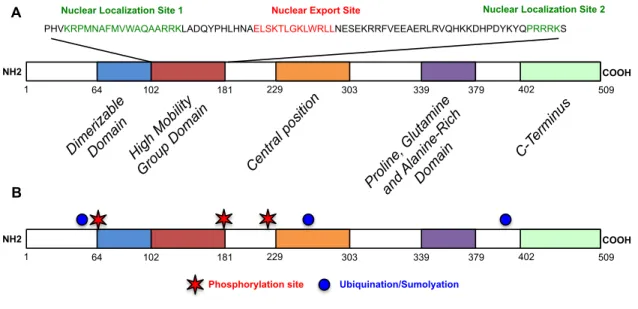
Figure 1.5: Protein structure of Sox9. (A) SOX9 contains five highly conserved protein domains.
Two nuclear localization sites and one nuclear export site are present within the HMG domain. (B) Only six post translational modifications sites for SOX9 are currently known, including three phosphorylation sites (red) and three upiquination sites (blue).
Sox9high Lgr5high
EGFP EGFP
Sox9EGFP
high low sublow
Cell count
Sox9high Sox9low
Sox9su
blow
Relative abundance of Sox9EGFP populations
Cell fraction
neg
EGFP
10 5 10 4 10 3 10 2 10 1 10 0
10 5 10 4 10 3 10 2 10 1
10 0 10 0 10 1 10 2 10 3 10 4 10 5
Cell count Cell Count
C
Supporting Figure 1
0 0.2 0.4 0.6 0.8 1
FSC-Height SSC-Area Pulse Width Sytox/Annexin V
SSC-Height EGFP EpCAM
SSC-Height
A
B
D
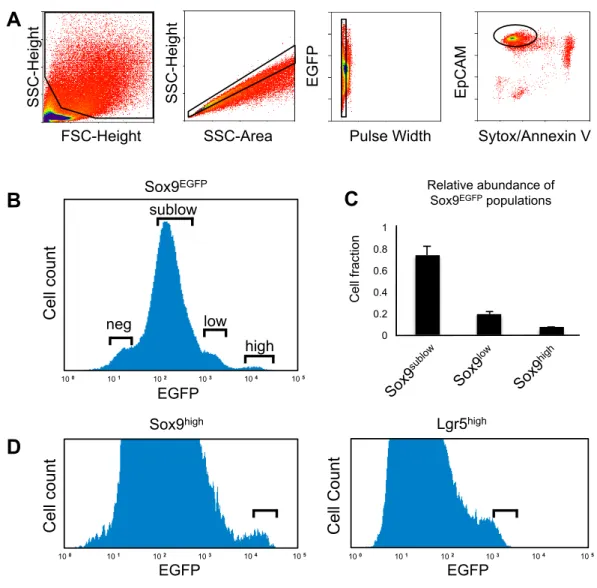
Figure 2.1: FACS profiles used for single cell gene expression analysis and LRC analysis. (A) Gating scheme used for isolation of viable (Sytox/AnnexinV negative) single intestinal epithelial cells (EpCAM positive) applied to B & C. (B) Gating scheme used to isolate Sox9EGFP populations for LRC analysis. Note that crypt enriched preparations result in a de-enrichment of Sox9neg cells, which mostly localize to the villi. (C) Relative abundance of Sox9EGFP populations. Bars represent mean ± standard deviation. n=6. (D) FACS gating scheme for the isolation of Lgr5high and Sox9high cells used for single cell gene expression analysis.
S7
Sox9Lgr5Lgr4Ascl2 Dll1 Bmi1Lrig1Hopx ChgaChgbDcamkl-1Defcr-2
Lgr5 hi Sox9 hi Lgr5
+
Sox9 hi Lgr5 - Lgr5 hi Sox9 hi Lgr5 +
Sox9 hi Lgr5 - Lgr5 hi Sox9 hi Lgr5 +
Sox9 hi Lgr5 -
Distribution of gene expression
active ISC reserve ISC secretory
N.D.
a,b
a b a a b a b c
c a b
c a b
c
a b a b c
c
a b a b c
b a b c
a b a a b
Active Reserve Secretory
Distribution of gene signature
Principle component 1
Principle component 2
A
B
C
Lgr5high Sox9high Lgr5pos Sox9high Lgr5neg
Figure 1
0"
0.5"
1"
1.5"
2"
2.5"
3"
3.5"
0"
0.2"
0.4"
0.6"
0.8"
1"
1.2"
1.4"
N.D. 0" N.D.
0.2"
0.4"
0.6"
0.8"
1"
1.2"
1.4"
1.6"
1.8"
Relative gene expression
Lgr5 Hopx Chga
c
a b a a b a b c
0.0 0.2 0.4 0.6 1.0 1.2 1.4
0.8
0.0 0.2 0.4 0.6 1.0 1.2 1.4
0.8
0.0 0.5 1.0 1.5 2.5 1.6
1.8
2.0 3.0 3.5
N.D. N.D.
N.D.
N.D.
N.D.
D
Principle Component 1
Principle Component 2
Lgr5 hi Sox9 hi Lgr5 + Sox9 hi Lgr5 - Sox9EGFP Overlay Lgr5EGFP Overlay
Tac1
SIS
Absorptive Enteroendocrine
Muc2 Lyz2
Goblet Paneth
N.D.
N.D.
E a a a a b b
a a a a a a
Figure 2.2: The Sox9high population is comprised of Lgr5pos and Lgr5neg cells. (A) Representative confocal images of Sox9high (white arrows) and Lgr5high cells (white arrows) in situ. Scale bar, 20 µm (B) PCA analysis of single cell gene expression data demonstrates that Sox9high cells bisect into two populations when Lgr5 expression is used as a distinguishing criterion. (C) Violin plots demonstrate the distribution of gene expression values of individual single cells. The y axis represents the limit of detection (set to 35 cycles) minus the observed CT value determined by qPCR. Cells that demonstrate high levels of expression (low CT values) are found near the top of the plot, whereas cells that
demonstrate no gene expression (no CT value) are present near at the bottom. Single cell gene expression analysis show that nearly all cells in the Lgr5high population express rISC biomarkers. More single cells present in the Sox9high Lgr5pos population demonstrate expression of ISC biomarkers when compared to to cells present in the Sox9high Lgr5neg population. (D) Violin plots depicting single cell gene expression distributions reveal that a limited number of cells express of absorptive and goblet cell biomarkers and ubiquitous expression of the Paneth cell biomarker Lyz2 across all cell populations assessed. Unlike the Lgr5high population, a subset of Sox9high cells express the enteroendocrine marker Tac1 (E) Sox9high Lgr5pos cells demonstrate a averaged gene expression pattern consistent with the reported LRC gene signature. Bars represent mean ± standard error of respective groups. Statistical significance is indicated with letters above, P<0.05. Cellular populations sharing the same alphabetical value are not significantly different rom each other. Lgr5high cells (n=71), Sox9high Lgr5pos cells (n=34), Sox9high Lgr5neg cells (n=54).
Figure 2.3: Analysis of Sox9high cells reveals a secretory gene signature with heterogeneous expression of aISC and rISC biomarkers. Binary gene expression distribution of 88 single Sox9high cells. Cells with CT values below the limit of detection (CT= 35 cycles) were labeled “Expressing”, while cells with CT values greater than the limit of detection were labeled “Non-Expressing”. Pie charts are organized into columns containing "Active” ISC biomarker, “Reserve” ISC biomarker, and
“Secretory” biomarker transcripts. A subset (40%) of cells in the Sox9high population demonstrate co-expression of Lgr5, while all Sox9high cells express one or more secretory cell biomarkers.
S9
Nuclei / EdU
Supporting Figure 3
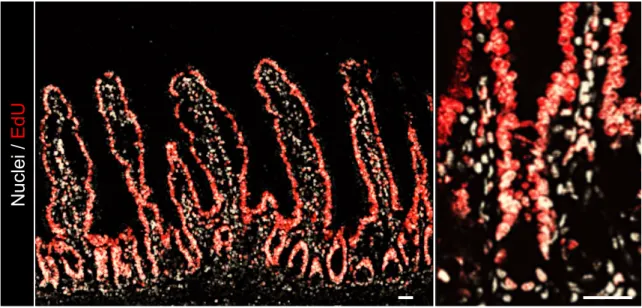
Figure 2.4: Nearly complete EdU-labeling of the epithelium following 28 days of EdU
administration. Representative confocal images of EdU incorporation (red) into the nuclei (white) of the intestinal epithelium. Scale bar, 20 µm.
0"
0.02"
0.04"
0.06"
0.08"
0.1"
0.12"
0.14"
0.16"
0.18"
1" 2" 3" 4" 5" 6" 7" 8" 9" 10" 11" 12" 13" 14" 15"
Crypt Position 2
4 6 8 10 12 14 16 18
0
% LRCs
Supporting Figure 4
Figure 2.5: Label retaining cells primarily localize to crypt positions +4 to +7. Cell position distribution of label retaining cells present following a 10-day washout period. LRCs in this assay are defined as EdUpos (LRCs), EpCAMpos (Epithelial cells), and Lysozymeneg (Non-Paneth cells). Bars represent mean ± standard deviation. n=3.
Autofluorescence
EdU
A
C
2.8%
0.5% 31.2%
97.2%
99.5% 68.8%
Non-LRC LRC
70%
13%
17%
Sox9high Sox9low
Sox9sublow
Nuclei EdU SOX9 Lysozyme Overlay
LRC distribution among Sox9EGFP populations
B
Sox9sublow Sox9low Sox9high Autofluorescence
EdU
A
C
Figure 2
2.8%
0.5% 31.2%
97.2%
99.5% 69.8%
Non-LRC LRC
70%
13%
17%
Sox9high
Sox9low
Sox9sublow
Nuclei EdU SOX9 Lysozyme Overlay
LRC distribution among Sox9EGFP populations
B
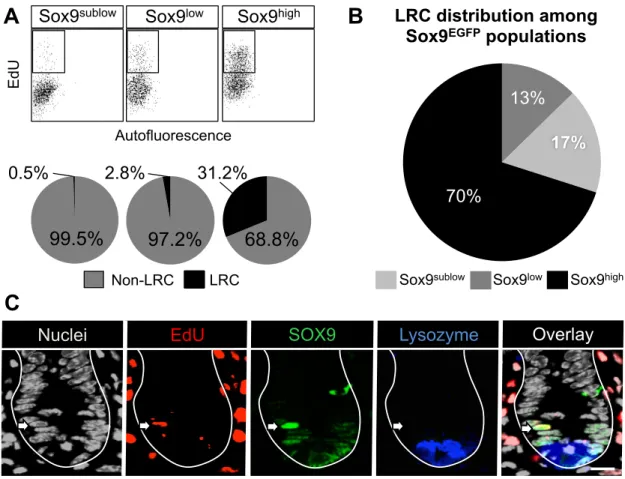
Figure 2.6: LRCs express high levels of Sox9. (A) Representative flow cytometry plots analyzing the percentage of EdU positive LRCs in FACS isolated Sox9EGFP populations. Quantification is shown in pie charts below. (B) LRC distribution among Sox9EGFP shows that 70% of LRCs express high levels of Sox9. (C) Representative confocal image of an LRC expressing high levels of SOX9.
Scale bar, 20 µm. n=6 mice.
S11
0 20 40 60 80 100
% Crypts with SOX9 expression
Control
SOX9 cKO
SOX9 iKO
Supporting Figure 5
Sox9 cKO
Nuclei / SOX9 / EpCAM
SOX9 iKO SOX9 cKO Control
A B
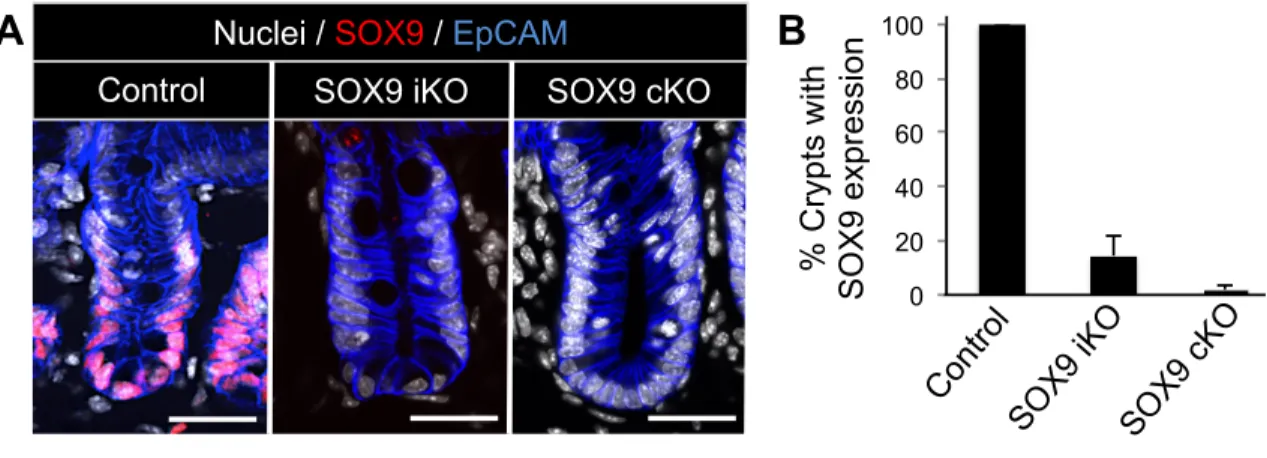
Figure 2.7: SOX9 is efficiently ablated in SOX9cKO and SOX9iKO mouse models. (A) Representative confocal images of SOX9 immunofluorescence used to assess the ablation efficiency of conditional and tamoxifen dependent inducible SOX9 knockout. (B) Quantification reveals a 97.8% knockout efficiency in SOX9cKO mice and 85.5% reduction of SOX9 in SOX9iKO mice following 8 days of tamoxifen treatment. Bars represent mean ± standard deviation. n=3 for each group. Scale bar, 40 µm. *P<0.05.
Nuclei EdU Lysozyme EpCAM Overlay
0 0.05 0.1 0.15 0.2
0 0.01 0.02 0.03 0.04 0.05
LRCs per crypt
SOX9 cKO
*
Figure 3
Control
Nuclei EdU Lysozyme EpCAM Overlay
SOX9 cKO Control
LRCs per crypt
0 0.05 0.1 0.15
SOX9 iKO Control
LRCs per crypt
Nuclei EdU Lysozyme EpCAM Overlay
SOX9 cKOControl
8 Day Washout
B
SOX9 cKOControl
12 Day Washout SOX9 iKOControl
8 Day Washout
A
C
*
*
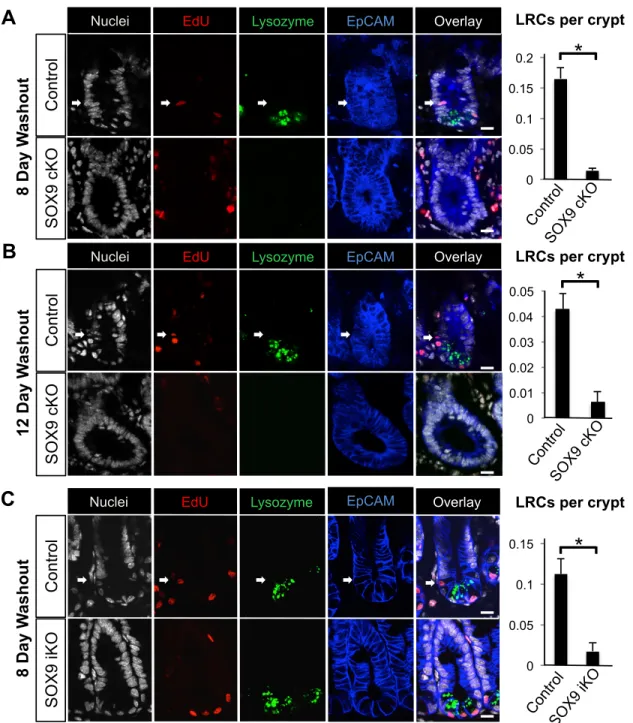
Figure 2.8: LRCs are reduced in SOX9 ablated intestines. (A & B) Confocal images of LRCs (white arrows) present in control and absent in SOX9cKO animals following 8- and 12-day washout periods. (C) Confocal images of LRCs (white arrows) present in control mice and absent in SOX9iKO animals following an 8-day washout period. Note that LRCs in this assay were defined as EdUpos (LRCs), EpCAMpos (Epithelial cells), and Lysozymeneg (Non-Paneth cells). Quantification shown to the right. Bars represent mean ± standard deviation of each group. Scale bar, 20 µm. n=4 mice per group. *P<0.05.
S13
Nuclei /Lineage trace12 hours post injection
A
B
T = Tamoxifen administration IR = Irradiation
Day: -1 0 14 -1 0 14 -1 0 14 -1 0 14
IR
T T T T/IR
Figure 4
Nuclei Tomato Sox9 Overlay
Non-Irradiated Irradiated
Figure 2.9: Sox9-expressing cells lineage trace following irradiation damage. (A)
Representative image of a crypt 12-hours post-injection with tamoxifen demonstrating that lineage tracing is initiated in SOX9 expressing cells. (B) Sox9-expressing cells lineage trace under both homeostatic conditions and after administration 14 Gy of radiation. Experimental timelines are shown below indicating time of tamoxifen injection (T) and irradiation damage (IR). Dotted lines reflect the time point at which images were acquired. Scale bar, 20 µm. n=3 mice per time point.
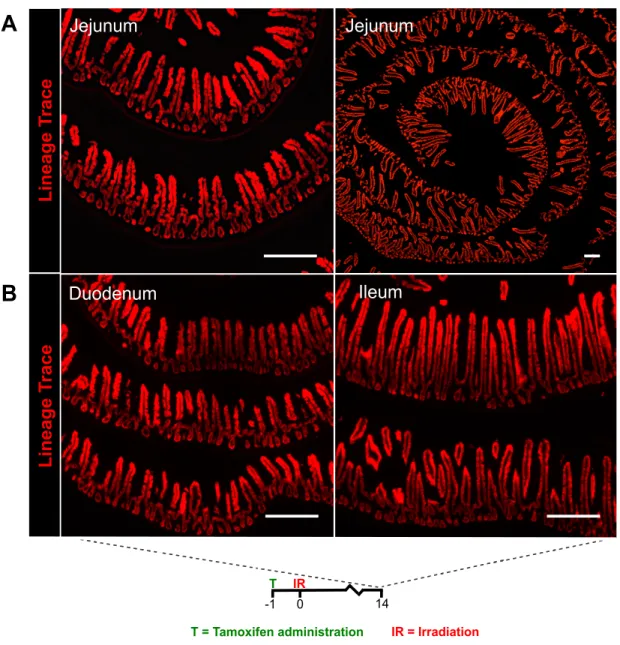
Jejunum
Jejunum
Lineage Trace
A
Ileum
T = Tamoxifen administration IR = Irradiation 0
-1 14
IR T
Lineage Trace
Duodenum
B
Figure 2.10: Sox9-expressing cells lineage trace throughout the small intestine following radiation-induced injury. To determine if Sox9 is expressed in rISCs, lineage-tracing analysis was performed on Sox9-expressing cells following irradiation damage. (A,B) Positive lineage tracing events were observed ubiquitously throughout the length of the small intestinal epithelium.
S15
0 1 2 3
Control
0 1 2 3
Micro-colonies per 1 mm intestine *
SOX9 cKO
Figure 5 B
Control SOX9 iKO Micro-colonies per 1 mm intestine *
EdU
Nuclei EpCAM Overlay
A
EdU
Nuclei EpCAM Overlay
SOX9 cKOControl SOX9 iKOControl
C D
Figure 2.11: Regeneration of SOX9 ablated epithelium is severely impaired following irradiation-induced damage. (A & B) Representative confocal images of micro-colonies (white arrows) present in control and absent in SOX9cKO and SOX9iKO intestines following irradiation damage. Scale bar, 100 µm. (C & D) Quantification of micro-colonies in control, SOX9cKO, and SOX9iKO animals demonstrate that Sox9knockout intestines lack competent ISCs following irradiation damage. Bars represent mean ± standard deviation. n=6 mice per group. *P<0.05
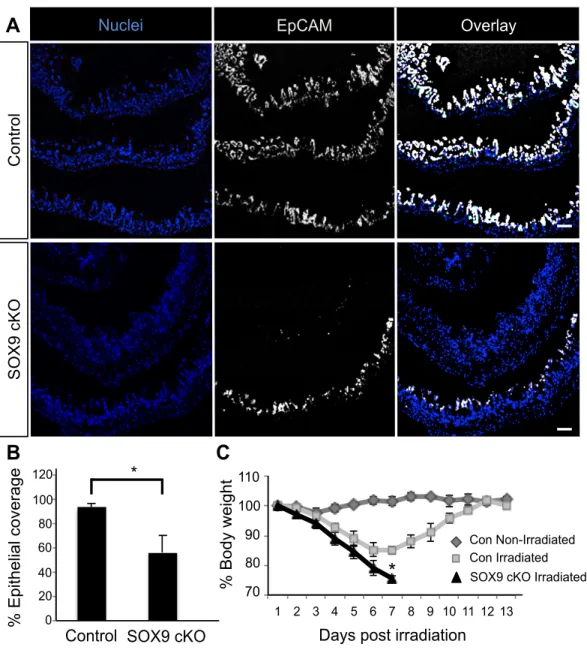
SOX9 cKO
% Epithelial coverage
0 0.2 0.4 0.6 0.8 1
1.2 *
Control
0 20 40 60 80 100 120
A
B
Supporting Figure 7
0.70$
0.80$
0.90$
1.00$
1.10$
1 2 3 4 5 6 7 8 9 10 11 12 13
Days post irradiation
Con Irradiated Con Non-Irradiated SOX9 cKO Irradiated
*
70 80 90 100
% Body weight
C
110
EpCAM
Nuclei Overlay
Control SOX9 cKO
Figure 2.12: Epithelial coverage reduction and severe weight loss is observed in SOX9cKO after irradiation-induced injury. Consistent with impaired ISC function, SOX9cKO animals demonstrate a loss of epithelial coverage following irradiation. (A) Confocal tile-scanned images show normal epithelial coverage in controls (top panel) and reduced epithelial coverage in SOX9cKO (bottom panel) intestines 3.5 days following irradiation damage. Scale bar, 100 µm. (B) Epithelial coverage was quantified by measuring the length of intestine that stained positively and negatively for EpCAM using Image J in control and SOX9cKO intestines. (C) Mice with SOX9cKO epithelium demonstrated profound weight loss (>20% reduction) and morbidity, which required humane euthanasia at days 6 and 7 post-irradiation. n=6 for each group. *P<0.05.
S17
Nuclei / Lysozyme / EpCAM
0 1 2 3 4 5 6
Control SOX9 iKO Number of Paneth Cells per Crypt
Supporting Figure 8
SOX9 iKO Control
A B
Figure 2.13: Acute Inducible SOX9 ablation does not result in a loss of Paneth cells. (A) Representative confocal image of Paneth cells present in SOX9iKO mouse following 8 days of tamoxifen treatment. (B) Quantification demonstrates no difference in Paneth cell numbers present in tamoxifen treated controls and SOX9iKO mice (P=0.42). Bars represent mean ± standard
deviation. n=3 for each group. Scale bar, 40 µm
0"
0.01"
0.02"
0.03"
0.04"
0.05"
0"
0.1"
0.2"
0.3"
0.4"
Control SOX9 cKO
1 hour 6 hours
24 hours
Nuclei / EdU
0"
0.1"
0.2"
0.3"
0.4"
Con SOX9 cKO
* *
*
*
*
*
N.D.
10 20 30 40
0
% CC3 positive
B
Control SOX9 cKO
Nuclei / CC3
A
Non-IR 1 hour
6 hours 24 hours 10
20 30 40
0
% EdU positive
Figure 6
1 hour 6 hours
24 hours 3
4 5 6
0
% Phospho-Histone H3 positive
2 1
*
*
Control SOX9 cKO *
Nuclei / Phospho-Histone H3
C
Non-IR Non-IR
Non-IR Irradiated
Non-Irradiated 1 hour 6 hours 24 hours
Non-Irradiated 1 hour 6 hours 24 hours
Non-Irradiated 1 hour 6 hours 24 hours
Figure 2.14: SOX9cKO crypts exhibit increased apoptosis despite normal cell cycle arrest after irradiation damage. (A) Representative confocal images of control and SOX9cKO crypts immuno- stained for the apoptotic marker Cleaved Caspase-3 at 1, 6, and 24 hours post-irradiation.
Quantification, shown to the right, reveals that crypt-based cells in SOX9cKO mice experience a higher incidence of damage-induced apoptosis. (B) Confocal images depicting EdU incorporation in crypt-based cells following irradiation damage demonstrate a halt of S-phase entry 6-hours post- irradiation in control and SOX9cKO crypts. (C) Confocal images of phospho-histone H3 demonstrate a lack of M-phase occurring at 1 and 6 hours post irradiation in control and SOX9cKO crypts. These results indicate that SOX9 is dispensable for damage-induced cell cycle arrest. Bars represent mean
± standard error. n=3 mice for each time point. Scale bar, 20 µm. *P<0.05.
S19
SOX9cKO Control
Nuclei / γ-H2AX
Supporting Figure 9
Irradiated
Non-Irradiated 1 hour 6 hour 24 hour
Figure 2.15: SOX9 is dispensable for DNA repair following irradiation damage. γH2AX staining was performed to assess whether SOX9cKO crypts exhibited impaired DNA repair following
irradiation damage. While γH2AX staining was not observed in non-irradiated crypts of control or SOX9cKO crypts, extensive positive staining was observed 1 hour post-irradiation. Overt reduction in the number of γH2AX foci in control and SOX9cKO crypts was observed over the course of 24 hours indicating intact DNA repair mechanisms. Scale bar, 20 µm.
Lgr5High
Sox9low
Lgr4 Ascl2 Dll1 Bmi1 Lrig1 Hopx
Active ISC (CBC)
Secretory Precursor
Lgr5Low
Sox9High
Dll1 Bmi1 Lrig1 Hopx Chga Dcamkl1
Paneth Cell Reserve ISC
(LRC)
Sox9 Levels Proliferation
Radiation Damage Homeostasis
Figure 2.16: A model for a dose-dependent role of SOX9 in rISC maintenance and Paneth cell
differentiation. aISCs give rise to daughter progenitors consisting of absorptive and secretory precursors.
Secretory progenitor cells become non-proliferative LRCs as expression of SOX9 increases. In the absence of SOX9, secretory LRC progenitors, which give rise to Paneth cells, are not generated resulting in the loss of the Paneth cell lineage. Following damage, LRCs down-regulate SOX9, re- acquire aISC properties, and facilitate epithelial repair.
!!
S21
cells PDMS Polystyrene Media Matrigel centrifugation
centrifugation
polymerization
A
B
C 200µm
Sox9EGFP CAGDsRed
D E
0hr post-plating
48hr post-plating
2.5cm, ~100 microwells
1.25cm, ~50 microwells
120hr 4 weeks 8 weeks
L M
F
I
G
H
J
K
Figure A.1 – Modified MRAs are compatible with long-term culture of primary ISCs. (A) Completed MRAs consist of polystyrene “raft”-lined PDMS microwells mounted to a glass slide with a thin layer of PAA, and attached to a cassette containing media chambers. (B) Cassettes can be scaled to divide a single MRA into 2 or 4 separate media reservoirs. (C) Microwells are 200µm2, arranged in a grid, and the physical addresses stamped into PDMS at 5 well intervals.
Scale bar represents 600µm (D) ISCs are isolated from Sox9EGFP:CAGDsRedtransgenic mice, which express dsRed throughout the intestinal epithelium. Scale bars represent 50µm. (E) Isolated cells are seeded into microwells through centrifugation in media, and then overlaid with Matrigel. (F) ISCs are randomly distributed across arrays immediately after plating, with some microwells containing single ISCs (G, arrow), and others containing multiple ISCs (H,
arrowhead). (I) Imaging of the same array at 48hrs reveals widespread enteroid formation, with (J,K) typical cystic growth of early structures. Scale bars for panels F-K represent 600µm. (L) Long-term culture experiments demonstrate that developed ISCs grow out from their original microwells over the course of 4 weeks, and (M) can be sustained in the array format for 8 weeks or longer (upper two wells are empty in this image). Scale bars represent 200µm.
A
B
C
D
E
F
G H
Poly(acrylic acid) Glass slide
PDMS spacer PDMS prepolymer
SU-8 master mold
stepper motor
polystyrene
cassette
Figure A.2– Fabrication of glass-mounted microwell arrays. (A) PDMS is liquid molded onto a PAA- coated glass slide on a SU-8 master mold. (B,C) PDMS/SU-8 mold assemblies are cured, and cured, solid PDMS is gently removed from the mold. (D) Polystyrene solution is added to the array and degassed. (E) Dip coating with a programmed stepper motor removes excess polystyrene. (F) Subsequent discontinuous dewetting generates isolated polystyrene pockets inside PDMS microwells.
(G) Arrays are baked at 95°C to remove solvent, resulting in solid polystyrene microrafts embedded in PDMS microwells. (H) Microraft arrays are mounted to polycarbonate cassettes to complete the fabrication process.
30 µm
0 µm
A B
C D
Wrong focal plane Correct focal plane Correct focal plane Correct focal plane
Z-axis displacement
Standard Microraft Array
Glass-mounted Microraft Array
Figure A.3– Glass-mounting reduces PDMS sagging in microwell arrays. (A,C) The elastic properties of PDMS cause standard microwell arrays to sag, preventing tile-scanned imaging in a single Z-plane. (B,D) Mounting arrays to glass slides prevents sagging and facilitates imaging.