5-Iodopyrimidin-2-amine
Yen-Hsun Chiang, Chia-Jun Wu, Pei-Chi Cheng and Jhy-Der Chen*
Department of Chemistry, Chung-Yuan Christian University, Chung-Li, Taiwan Correspondence e-mail: [email protected]
Received 18 May 2010; accepted 21 May 2010
Key indicators: single-crystal X-ray study;T= 295 K; mean(C–C) = 0.005 A˚; Rfactor = 0.032;wRfactor = 0.089; data-to-parameter ratio = 11.9.
The molecule of the title compound, C4H4IN3, has crystal-lographic mirror plane symmetry. In the crystal, the molecules are connected through N—H N hydrogen bonds into polymeric tapes extended along the aaxis, which are typical of 2-aminopyrimidines. Each molecule acts as a double donor and a double acceptor in the hydrogen bonding.
Related literature
For coordination polymers formed with the title compound, see: Linet al.(2006).
Experimental
Crystal data
C4H4IN3
Mr= 221.00 Orthorhombic,Cmca a= 7.9088 (7) A˚
b= 8.3617 (10) A˚ c= 18.3821 (16) A˚ V= 1215.6 (2) A˚3
Z= 8
MoKradiation
= 5.16 mm1
T= 295 K 0.60.40.2 mm
Data collection
Bruker P4 diffractometer Absorption correction: multi-scan
(XSCANS; Siemens, 1995) Tmin= 0.332,Tmax= 1.000
800 measured reflections 573 independent reflections
535 reflections withI> 2(I) Rint= 0.032
3 standard reflections every 97 reflections
intensity decay: none
Refinement
R[F2> 2(F2)] = 0.032
wR(F2) = 0.089
S= 1.10 573 reflections 48 parameters
H atoms treated by a mixture of independent and constrained refinement
max= 0.93 e A˚
3 min=0.83 e A˚
3
Table 1
Hydrogen-bond geometry (A˚ ,).
D—H A D—H H A D A D—H A
N2—H2N N1i
0.79 (5) 2.37 (5) 3.157 (4) 173 (6)
Symmetry code: (i)x1 2;yþ
3 2;zþ1.
Data collection: XSCANS (Siemens, 1995); cell refinement: XSCANS; data reduction: XSCANS; program(s) used to solve structure:SHELXS97(Sheldrick, 2008); program(s) used to refine structure:SHELXL97(Sheldrick, 2008); molecular graphics:XPin SHELXTL(Sheldrick, 2008); software used to prepare material for publication:SHELXTL.
We are grateful to the National Science Council of the Republic of China for support. This research was also supported by the project of specific research fields in Chung-Yuan Christian University, Taiwan, under grant No. CYCU-98-CR—CH.
Supplementary data and figures for this paper are available from the IUCr electronic archives (Reference: GK2275).
References
Lin, C.-Y., Chan, Z.-K., Yeh, C.-W., Wu, C.-J., Chen, J.-D. & Wang, J.-C. (2006). CrystEngComm,8, 841–846.
Sheldrick, G. M. (2008).Acta Cryst. A64, 112–122.
Siemens (1995). XSCANS. Siemens Analytical X-ray Instruments Inc., Madison, Wisconsin, USA.
Acta Crystallographica Section E
Structure Reports
Online
supporting information
Acta Cryst. (2010). E66, o1464 [https://doi.org/10.1107/S1600536810019124]
5-Iodopyrimidin-2-amine
Yen-Hsun Chiang, Chia-Jun Wu, Pei-Chi Cheng and Jhy-Der Chen
S1. Comment
A series of Ag(I) coordination polymers containg 2-amino-5-iodopyrimidine have been prepared, which show
metallocycles and one-dimensional helical chains (Lin, et al., 2006). Within this project the crystal structure of
2-amino-5-iodopyrimidine was determined to investigate its weak interactions.
In its crystal structure weak intermolecular N—H···N hydrogen bonding is found (Tab. 1) and the molecules are almost
planar (Fig. 1).
S2. Experimental
The title compound was purchased from Acros Chemical Co. and used as received. Coloress plate crystals suitable for
X-ray crystallography were obtained by dissolving the title compound in THF, followed by allowing the solution to
evaporate slowly under air.
S3. Refinement
The pyrimidyl hydrogen atoms were placed into idealized positions and constrained by the riding atom approximation
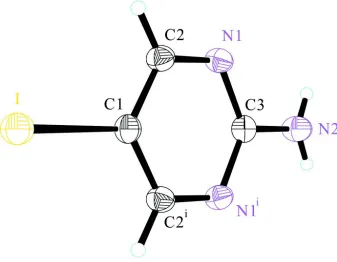
Figure 1
Crystal structure of the title compound with labeling and displacement ellipsoids drawn at the 30% probability
level.Symmetry codes: (i) -x, y, z.
5-Iodopyrimidin-2-amine
Crystal data
C4H4IN3 Mr = 221.00
Orthorhombic, Cmca Hall symbol: -C 2bc 2 a = 7.9088 (7) Å b = 8.3617 (10) Å c = 18.3821 (16) Å V = 1215.6 (2) Å3 Z = 8
F(000) = 816 Dx = 2.415 Mg m−3
Mo Kα radiation, λ = 0.71073 Å Cell parameters from 31 reflections θ = 4.9–12.6°
µ = 5.16 mm−1 T = 295 K Plate, colorless 0.6 × 0.4 × 0.2 mm
Data collection
Bruker P4 diffractometer
Radiation source: fine-focus sealed tube Graphite monochromator
ω scans
Absorption correction: multi-scan (XSCANS; Siemens, 1995) Tmin = 0.332, Tmax = 1.000
800 measured reflections
573 independent reflections 535 reflections with I > 2σ(I) Rint = 0.032
θmax = 25.0°, θmin = 2.2° h = −1→9
k = −1→9 l = −21→1
Refinement
Refinement on F2
Least-squares matrix: full R[F2 > 2σ(F2)] = 0.032 wR(F2) = 0.089 S = 1.10 573 reflections 48 parameters 0 restraints
Primary atom site location: structure-invariant direct methods
Secondary atom site location: difference Fourier map
Hydrogen site location: inferred from neighbouring sites
H atoms treated by a mixture of independent and constrained refinement
w = 1/[σ2(F
o2) + (0.055P)2 + 3.1925P]
where P = (Fo2 + 2Fc2)/3
(Δ/σ)max = 0.001
Δρmax = 0.93 e Å−3
Δρmin = −0.83 e Å−3
Extinction correction: SHELXL97 (Sheldrick, 2008), Fc*=kFc[1+0.001xFc2λ3/sin(2θ)]-1/4
Extinction coefficient: 0.0148 (9)
Special details
Experimental. Refinement of F2 against ALL reflections. The weighted R-factor wR and goodness of fit S are based on F2, conventional R-factors R are based on F, with F set to zero for negative F2. The threshold expression of F2 > σ(F2) is
used only for calculating R-factors(gt) etc. and is not relevant to the choice of reflections for refinement. R-factors based on F2 are statistically about twice as large as those based on F, and R- factors based on ALL data will be even larger.
Geometry. All esds (except the esd in the dihedral angle between two l.s. planes) are estimated using the full covariance matrix. The cell esds are taken into account individually in the estimation of esds in distances, angles and torsion angles; correlations between esds in cell parameters are only used when they are defined by crystal symmetry. An approximate (isotropic) treatment of cell esds is used for estimating esds involving l.s. planes.
Refinement. Refinement of F2 against ALL reflections. The weighted R-factor wR and goodness of fit S are based on F2,
conventional R-factors R are based on F, with F set to zero for negative F2. The threshold expression of F2 > σ(F2) is used
only for calculating R-factors(gt) etc. and is not relevant to the choice of reflections for refinement. R-factors based on F2
are statistically about twice as large as those based on F, and R- factors based on ALL data will be even larger.
Fractional atomic coordinates and isotropic or equivalent isotropic displacement parameters (Å2)
x y z Uiso*/Ueq
I 0.0000 0.25315 (4) 0.72128 (2) 0.0462 (4)
N1 −0.1515 (4) 0.6239 (4) 0.57261 (16) 0.0378 (8)
N2 0.0000 0.8038 (8) 0.5044 (4) 0.0456 (13)
C1 0.0000 0.4412 (6) 0.6466 (3) 0.0345 (11)
C2 −0.1488 (5) 0.5037 (4) 0.6200 (2) 0.0367 (9)
H2C −0.2507 0.4604 0.6358 0.044*
C3 0.0000 0.6791 (7) 0.5508 (3) 0.0343 (11)
H2N −0.085 (7) 0.831 (7) 0.485 (3) 0.061 (15)*
Atomic displacement parameters (Å2)
U11 U22 U33 U12 U13 U23
I 0.0388 (4) 0.0504 (5) 0.0495 (5) 0.000 0.000 0.01869 (14)
N1 0.0321 (17) 0.0427 (17) 0.0385 (16) 0.0031 (14) 0.0005 (12) 0.0041 (13)
N2 0.039 (3) 0.053 (3) 0.045 (3) 0.000 0.000 0.017 (3)
C1 0.038 (3) 0.033 (2) 0.032 (2) 0.000 0.000 0.002 (2)
C2 0.0329 (19) 0.0406 (19) 0.036 (2) −0.0011 (16) 0.0016 (15) 0.0034 (14)
Geometric parameters (Å, º)
I—C1 2.088 (5) N2—H2N 0.79 (5)
N1—C2 1.331 (4) C1—C2 1.377 (4)
N1—C3 1.346 (4) C2—H2C 0.9300
N2—C3 1.346 (10)
C2—N1—C3 116.1 (3) N1—C2—H2C 118.9
C3—N2—H2N 120 (4) C1—C2—H2C 118.9
C2i—C1—C2 117.4 (5) N1i—C3—N1 125.9 (5)
C2—C1—I 121.3 (2) N1i—C3—N2 117.0 (2)
N1—C2—C1 122.2 (4)
Symmetry code: (i) −x, y, z.
Hydrogen-bond geometry (Å, º)
D—H···A D—H H···A D···A D—H···A
N2—H2N···N1ii 0.79 (5) 2.37 (5) 3.157 (4) 173 (6)