Abstract - In the current educational set up, the great challenge that teachers faces is managing convergent learners since most assessment approaches focus on convergent skills. The study was conducted to evaluate the instructional design of the technology module (WileyPLUS) as a learning management tool. The study utilized a descriptive and experimental method with the Solomon four-group design to establish the effectivity of the learning management system in an outcomes based education heuristic model over the lecture-discussion method. One-way analysis of covariance was utilized to compare the gains in posttest scoreswith the pretest as its covariates. Based on the qualitative evaluation using a likert scale questionnaire, the WileyPLUS was found to be an effective aid to instruction. Further analysis shows that the student evaluators placed higher ratings on WileyPLUS evaluation tool, clarity of explanation and design characteristics which were considered as best features enhanced by its adaptability to students’ individual needs. This explains the student’s assessment of the LMS as an effective tool for learning. The quantitative evaluation showed that there is significant difference on the posttest means scores of the students when grouped according to teaching approach in favor of the experimental groups. This translates that independent of testing, the students who were exposed to the technology learning module WileyPLUS system achieved significantly better. The research intends to be a benchmark study for experiential learning as the institution goes forward in a more technology-integrated educational approach. It is recommended that school administrators adopt WileyPLUS as learning management system in teaching Differential Equations.
Index Terms - WileyPLUS, learning management system, outcomes-based education, solomon four group design
I. INTRODUCTION
oday, more than ever, one marvels at the great strides in technological innovation and development. The finiteness and the logic of the human mind could hardly imagine the gigantic proportions in which the trend is sweeping everyone.
Manuscript received March 23, 2016; revised March 27, 2016. This work was supported by WileyPLUS and in part by Mapua Institute of Technology Manila Philippines.
The authors are with Mapua Institute of Technology Mathematics Department. The authors may be contacted at +639178951267, email: [email protected].
With the wide scale and long term impact of technology modules, it is important that school administrators and educators know their nature, their functions and their impact to the whole educational system. It is through a good understanding of the available learning management tool that educators can truly fulfill their genuine tasks as guides in the molding of young minds and in actualizing their roles as instructional leaders. The task “to be in the know” is a serious one, since “we cannot give what we do not have”. Moreover, without a clear idea of the learning management system tool (LMS) technology, those in education will make reactive, rather than pro-active decisions.
An LMS in general is the infrastructure that delivers and manages instructional content, identifies and assesses individual and organizational learning or training goals, tracks the progress towards meeting those goals, and collects and presents data for supervising the learning process of organization as a whole (Surry, D., & Farquhar, J., 1997).
II. PROJECT OBJECTIVE
The purpose of this study is to evaluate the instructional design and determine the effectiveness of the technology module (WileyPLUS) as a learning management tool in teaching Differential Equations (Math24) at Mapua Institute of Technology.
Specifically, the study sought to answer the following questions:
1. How will the evaluators (teachers, experts and students) assess the technology module (WileyPLUS) in terms of the following based on the course outcomes: 1.1 Objectives
1.2 Subject Matter 1.3 Clarity of Explanation
1.4 Adaptability to Students’ Individual Needs (for Teachers and Computer Experts)
1.5 Evaluation Tool
1.6 Effectivity as an Aid to Instruction 1.7 Design Characteristics
2. Is there any significant difference between the pretest and posttest mean scores of the students exposed to the technology module WileyPLUS?
The Effectiveness of the Technology Module
(WileyPLUS) as Learning Management
System Tool in Teaching Differential
Equations
Dante L. Silva, Lilibeth D. Sabino, Dionisia M. Lanuza. Edgar M. Adina,
Rosario S. Lazaro, Member, IAENG
3. Is there any significant difference between the pretest and posttest mean scores of the students exposed to lecture-discussion method of teaching?
4. Is there any significant difference between the posttest mean scores of the pretested students exposed to the technology module WileyPLUS and those exposed to lecture-discussion method?
5. Is there any significant difference on the posttest mean scores of the students when grouped according to:
5.1 Teaching Method (the use of technology module WileyPLUS and the lecture-discussion method) 5.2 Testing (pretested and unpretested)
6. Is there any significant interaction between method of teaching and testing on the posttest scores of the students?
III. CONCEPTUAL FRAMEWORK
Learning is a complex process. To facilitate learning process, it is vital for teachers to understand the ways students learn and the components of critical and creative thinking.
Behavioral theories see learning in terms of changing what we do emphasizing behavioral modification through conditioning by means of reinforcement. Skinner is a well-known advocate of this principle which focuses on achieving desired changes (learning) by structuring the environment. The theories of Gestalt – Field consider how the individual perceives the learning environment or situation emphasizing observational learning, imitation and modeling. Cognitive theories consider how the learner thinks, reasons and transfers information to new learning situation.
The above mentioned theories bear their influences on the current study in terms of the principles they espouse and their implications to learning. The researchers believe that though there have been numerous researches and studies done to guide developers of instructional materials, the best guarantee that a learning managements system tool (LMS) will be effective is to try it out on the end users followed up by a series of evaluations, revisions and try outs until it reaches its best form. The model fits in with the incorporation of evaluation at intermediate steps and final thorough evaluation.
.
IV. RESEARCH DESIGN
The study utilized a descriptive and experimental method with the Solomon four-group design to establish the effectivity of the technology module WileyPLUS over the lecture-discussion method of teaching. The paradigm below shows the conduct of the study.
R O1 X O2 Experimental Group 1 (A) R O3 O4 Control Group 1 (B) R X O5 Experimental Group 2 (C) R O6 Control Group 2 (D) In this design:
1. Subjects are randomly assigned to four groups (R).
2. Two groups receive the experimental treatment – use of WileyPLUS (X).
3. One experimental group and one control group receive a pretest (O1 and O3 respectively).
4. Two groups (control) do not receive treatment 5. All four groups receive posttests (O2 , O4 , O5 ,
O6).
V. RESULTS
A. Evaluation of WileyPLUS (Teachers and Computer Experts as respondents)
The responses of the five teacher-evaluators and five computer experts were tallied by sections. Teachers with at least five years of teaching mathematics and are currently handling Differential Equations in the tertiary level, with very satisfactory proficiency rating and are computer literate were taken as evaluators. The computer experts are those with good computer background particularly in programming languages and with experiences in designing and developing software programs using various programming languages and authoring tools.
For purposes of evaluation, the researcher considered the overall ratings in each item. The researcher used the following scale to describe the over-all results.
4.50 – 5.00 Strongly Agree 3.50 – 4.49 Agree
2.50 – 3.49 Undecided 1.50 – 2.49 Disagree
1.00 – 1.49 Strongly Disagree
A follow-up interview was conducted to affirm or negate some results of the quantitative evaluation. This gave the respondents an opportunity to elaborate on their responses to the evaluation guide. The interview questionnaire is composed of five questions which are reflective of the students’ general assessment of the technology module. The questions centered on the effectivity of the WileyPLUS as a supplementary tool for learning.
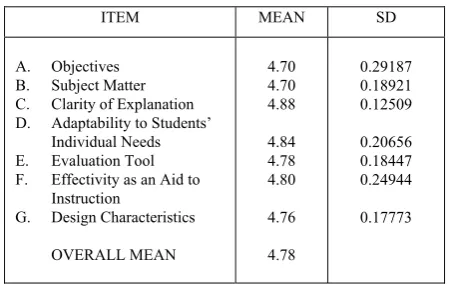
[image:2.595.315.540.500.643.2]Table 1 gives a summary of the evaluation of the teachers and computer experts on the teaching module WileyPLUS. The table reveals a unanimous evaluation that WileyPLUS is an effective aid for teaching Differential Equations as indicated by the overall mean of 4.78 (Strongly Agree). The clarity of explanation was considered as the best feature (4.88) and its adaptability to students’ individual needs (4.84) making WileyPLUS an effective aid to instruction (4.80). Equally adding to its effectivity as an aid were its evaluation scheme (4.78), design (4.76) and its
Table 1
Summary Table of the Responses of Teacher-Evaluators and Computer Experts.
ITEM MEAN SD A. Objectives
B. Subject Matter C. Clarity of Explanation D. Adaptability to Students’
Individual Needs E. Evaluation Tool F. Effectivity as an Aid to
Instruction
G. Design Characteristics OVERALL MEAN
4.70 4.70 4.88 4.84 4.78 4.80 4.76 4.78
objective (4.70). All these lead to better understanding of the concepts and principles in Differential Equations.
B. Evaluation of WileyPLUS as LMS (Students as respondents)
The students in the experimental groups were asked to evaluate WileyPLUS as technology module. A likert scale questionnaire was used by the students to evaluate. This questionnaire was formulated utilizing several theories and principles of learning. This is to ensure that it will be an effective tool for learning. These principles included perception and attention, memory, comprehension, manipulation, motivation, control, transfer of learning and individual differences.
The responses of 20 students were tallied by sections. These students were chosen at random from the experimental groups. A follow up interview with students was also conducted to affirm or negate some results of the evaluation. This gave the respondents an opportunity to elaborate on their responses to the evaluation guide.
The table reveals that the student-evaluators agreed strongly that WileyPLUS can be used as an effective tool for learning Differential Equations. This is indicated by the overall mean score of 4.838 which is even higher than the teachers and experts evaluators’ rating for the LMS.
Further analysis of the table shows that the student evaluators placed higher rating on the LMS evaluation tool (4.89) and clarity of explanation (4.88). This will probably explain their assessment of the LMS as an effective tool for learning (4.84). Equally considered very good aspects of the LMS were the objectives (4.77) and design characteristics (4.74). Worth-mentioning was the unanimous decision that they would recommend WileyPLUS to their friends.
VI. STATISTICALANALYSISOFDATA
A. Results of the Pretest and the Posttest of the Experimental Group One on Course Outcomes One and Two
A validated teacher made test was administered to the students (40) as a pretest and posttest. The first set of 20-items required knowledge on Course Outcome 1 and the second set of 20-items required knowledge on Course Outcome 2. Using the non-directional test at 0.05 level of significance, the researcher tested the first null hypothesis:
Ho1: There is no significant difference between the pretest and posttest mean scores of the students exposed to WileyPLUS.
A t-test for dependent or correlated samples was utilized to test for the significance of difference between the pretest and posttest mean scores of the experimental group one. Table 3 below presents the means, standard deviations, skewness and the kurtosis of the pretest and posttest scores of the experimental group one. It also presents the results for t-test between the means of the pretest and posttest scores of the experimental group one.
Table 3
Means, Standard Deviations, and Computed t-Values of the Pretest and Posttest Scores of the Experimental Group One
Table 3 shows that the posttest means (16.1 and 16.225) are significantly higher than the pretest means (7.475 and 7.65). These results showed an improvement in the performance of the students after their exposure to WileyPLUS as learning management system tool.
For lesson one, the pretest standard deviation (3.601) is higher than the posttest standard deviation of 2.82. In the same manner, the pretest standard deviation of lesson two (3.697) is also higher than its posttest standard deviation of 2.895. In both course outcomes, pretest scores are heterogeneous while the posttest scores are more homogenous after the treatment.
The results reflected in Table 3 indicate that there is a significant difference between the pretest and the posttest mean scores of the students in experimental group one for course outcome one (t-value of 24.754, P
0.001). The same findings applied to course outcome two (t-value of 24.33, P
0.001).Hence, Ho1 is rejected at 0.01 level of significance. This implies that learning took place after the students were exposed to WileyPLUS for both course outcomes.
B. Results of the Pretest and the Posttest of the Control Group One on Course Outcomes One (CO1) and Course Outcome Two (CO2)
Using the non-directional test at 0.05 level of significance, the researchers tested the second null hypothesis:
Ho2: There is no significant difference between the pretest and posttest mean scores of the students exposed to lecture-discussion method of teaching.
For the control group one with 40 students, the scores were subjected to the same statistical treatment used in treating the scores of the experimental group one. The means of the pretest and the posttest were computed and t-test for correlated data was utilized to determine if there exists any significant difference between their means. The summary of the results is presented in Table 4.
Course Outco
me
Testing Mean SD Diff Comp t Prob Remarks
One
Pretest 7.475 3.601
8.625 24.754 0.001 RejectHo
1
Posttest 16.1 2.82
Two Pretest 7.65 3.697 8.575 24.33 0.001 RejectHo
1
[image:3.595.50.277.325.459.2]Posttest 16.225 2.895 Table 2
Summary Table of the Responses of Student-Evaluators.
ITEM MEAN SD
A. Objectives B. Subject Matter C. Clarity of Explanation D. Effectivity as an Aid to Instruction
E. Evaluation Tools F. Design Characteristics
OVERALL MEAN
4.77 4.87 4.88
4.84 4.89 4.74
4.838
0.28817 0.13416 0.12565
Table 4
Means, Standard Deviations, and Computed t-Values of the Pretest and Posttest Scores of the Control Group One
Course
Outcome Testing Mean SD Diff Comp t Prob Remarks One Pretest 7.625 2.984 3.650 17.5992 0.001 Reject Ho
2
Posttest 11.275 3.170 Two
Pretest 7.700 3.428
3.720 18.6882 0.001 Reject Ho
2
Posttest 11.425 3.643
The table shows that for both course outcomes, the posttest means of 11.275 (CO1) and 11.425 (CO2) are significantly higher than the pretest means of 7.625 (CO1) and 7.7 (CO2). It appears that the students showed improvement in their performance after the lessons were presented using the lecture-discussion method.
Course Outcome One’s standard deviation for pretest and posttest are 2.984 and 3.170 respectively, while Course Outcome Two has the standard deviation of 3.428 for pretest and 3.643 for the posttest. These results reveal that the posttest scores are more varied than the pretest scores. The results reflected in Table 4 indicate that there is a significant difference between the pretest and posttest mean scores of the students in control group one for CO1 (t-value of 17.59924, P
0.001). The same findings applied to CO2 (t-value of 18.6882, P
0.001).Hence, Ho2 is rejected at 0.01 level of significance. This implies that learning took place after the students were exposed to lecture-discussion method of teaching on both Course Outcomes.
C. Comparison of Posttest Mean Scores of Experimental Group One and Control Group One on Both Course Outcomes (CO1 and CO2)
[image:4.595.304.551.145.372.2]Using the non-directional test at 0.05 level of significance, the researcher tested the third null hypothesis: Ho3: There is no significant difference between the posttest mean scores of the pretested students exposed to LMS and those exposed to lecture-discussion method. Table 5 below shows the pretest and posttest mean scores and the adjusted posttest mean score after the pretest was held constant. Table 19 shows the summary of the ANCOVA.
Table 5
Pretest, Posttest and Adjusted Posttest of Experimental Group One and Control Group One for Lessons One and Two
Course
Outcome Groupings Pretest Posttest Adj. Posttest One
Experimental Group one
7.475 16.100 16.157 Control
Group One
7.625 11.275 11.218
Two
Experimental Group One
7.650 16.225 16.245 Control
Group One
7.700 11.425 11.405
Table 5 shows that the posttest mean scores of the experimental group one for both Course Outcomes (16.1 and 16.225 respectively) are significantly higher than those of the control group one (11.275 and 11.425 respectively).
After the effect of the pretest was neutralized, the adjusted mean scores increased to 16.157 (CO1) and 16.425 (CO2) for the experimental group one while for the control group one, the mean scores became 11.218 (CO1) and 11.405 (CO2).
Table 6
Analysis of Covariance (ANCOVA) Summary table Cours
e Outco
me
Source of Variati
on
Adj. Sum of Squar
es
df Adj. MS uted F Comp Pro babi lity
Re mar
ks
One Treat ment (Betw een)
487.6
756 1 487.6756 180.4
26 0.00
1 Rej
ect Ho3
Within (Error)
208.1
245 77 2.702916 Total 695.8001 78
Two Treat ment (Betw een)
468.4
589 1 468.4589 167.8
51 0.00
1 Rej
ect Ho3
Within (Error)
214.9
013 77 2.790925 Total 683.3602 78
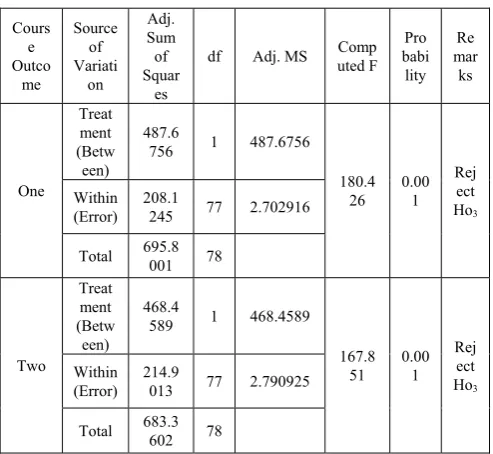
It is gleaned from Table 6 that there is a significant difference between the posttest mean scores of experimental group one and the control group one as revealed by F = 180.426, DF= 1,77, P
0.001 for CO1 and F = 167.851, DF= 1,77, P
0.001 for CO2.Hence, Ho3 is rejected at 0.01 level of significance. This implies that the use of WileyPLUS is more effective than the lecture-discussion method of presenting the lessons for both course outcomes after the pretest scores of the students was forced to be homogenous.
For both course outcomes, the variance in the posttest scores (approximately 82.19% for CO1 and 83.54% for CO2) is attributed to the factors covered by the study with its covariate (pretest) contributing 40.489% for course outcome one and 47.657% for course outcome two. However, about 17.80% of the variance in the posttest scores for lesson one and 16.46% for lesson two are due to factors not covered by the study.
D. Comparison of the Posttest Mean Scores of the Students when Grouped according to Teaching Method (the use of LMS and the lecture-discussion method) and Testing (pretested and unpretested)
Using the non-directional test at 0.05 level of significance, the researchers tested the fourth and the fifth null hypotheses:
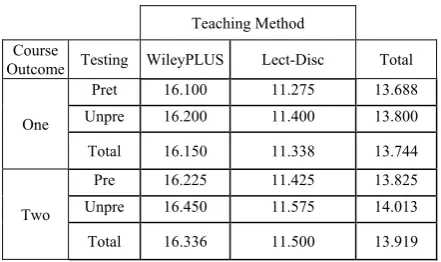
Table 7 presents the posttest mean scores of the students exposed to WileyPLUS and those who were exposed to lecture-discussion method of teaching.
Table 7
Posttest Mean Scores of the Students when Grouped According to Teaching Method and Testing
Teaching Method Course
Outcome Testing WileyPLUS Lect-Disc Total One
Pret 16.100 11.275 13.688 Unpre 16.200 11.400 13.800 Total 16.150 11.338 13.744
Two
Pre 16.225 11.425 13.825 Unpre 16.450 11.575 14.013 Total 16.336 11.500 13.919
For both course outcomes, independent of testing, the posttest means of the students exposed to WileyPLUS (16.15 and 16.336) are significantly higher than the posttest mean of those who were exposed to the lecture-discussion method (11.338 and 11.5).
On the other hand, independent of teaching method, the means of the pretested students (13.688 and 13.825 for CO1 and CO2 respectively) do not show significant difference from means of the unpretested students (13.8 and 14.013 for lessons one and two respectively).
Table 8 presents the summary of the two-way analysis of variance (ANOVA) on the posttest mean scores.
Data for both course outcomes show that a significant difference exists in the posttest mean scores of students when classified according to teaching method; F = 102.965, DF = 1,156, P
0.001 (CO1) and F = 81.106, DF = 1,156, P
0.001 (CO2).Hence, Ho4.1 is rejected at 0.01 level of significance. This implies that independent of testing, the students who were exposed to WileyPLUS achieved better than those students who were exposed to the lecture-discussion method approach.
On the other hand, no significant difference exists in the posttest mean scores of the students when classified according to testing; F = 0.056, DF = 1,156, P
0.799 (CO1) and F = 0.122, DF = 1,156, P
0.726 (CO2). Hence, Ho4.2 is accepted at 0.05 level of significance. This implies that independent of teaching method, students’ achievement did not differ when grouped according to testing.The interaction between the teaching method and testing does not show significant effect on the students’ posttest as indicated by the probability of 0.928 with F = 0.001 and DF = 1,156 (CO1) and 0.902 with F = 0.005 and DF = 1,156 (CO2).
[image:5.595.59.280.130.261.2]Hence, Ho5 is accepted at 0.05 level of significance. This implies that teaching method (the use of LMS and the lecture-discussion method) and testing (pretested and unpretested) taken together may be expected not to have any significant effect on the students’ achievement.
Table 8
Analysis of Variance (ANOVA) for the two-way Classifications with Interactions.
CO SV Squares Sum of df Square Mean Computed F Prob abilit y
Remar ks
1
Method
A 926.4082 1 926.40 102.96 0.001 Reject
Ho4.1
Testing B
0.505859
4 1 0.5058 0.056 0.798 Accept
Ho4.2
Interacti on
A x B 0.005859 1 0.0058 0.001 0.928 Accept
Ho5
Error
Within 1403.574 156 8.9972 Total
Varianc
e 2330.494 159
2
Method
A 936.0566 1 936.05 81.110 0.001 Reject
Ho4.1
Testing
B 1.40625 1 1.4062 0.122 0.725 Accept
Ho4.2
Interacti on A x B
0.054687
5 1 0.0546 0.005 0.902 Accept
Ho5
Error
Within 1800.426 156 11.541 Total
Varianc e
27377.94
3 159
VII. CONCLUSION
Based on the findings, the following conclusions were drawn within the limitation and scope defined in the study. The ratings given by the two sets of evaluators showed no significant difference. Both agreed that the use of WileyPLUS is an effective learning method and that the WileyPLUS reflects the characteristics of an effective learning management system tool. The following are based from the viewpoint of the evaluators as reflected in their ratings of the courseware.
1. Objectives - The objectives which accompanied each course outcomes are stated in specific and clear manner. Aside from being attainable, they are also geared towards the development of higher level thinking skills.
2. Subject Matter - The lessons are approximately presented in book format. They have been sequenced from easy to difficult to lead the students to a gradual mastery of the theories and skills. In addition, they are accurately discussed.
3. Clarity of Explanation - The concepts and principles are accurately explained with the use of examples and sample problems. Comprehension of the lessons is made possible by reducing the vocabulary load (modifying terms and concepts) and the sequential arrangement of the instructional materials.
5. Evaluation Tool -The mastery test posted by teachers is reflective of the lesson’s objectives. The items have been formulated clearly and they are sufficient enough to evaluate the extent to which the objectives are attained. 6. Effectivity as an Aid to Instruction - WileyPLUS shows its effectivity as an aid to instructions through its provision for individualized learning in which the learners work at mastery of concepts, principles and skills at their own rate. The learners are motivated to perform at their best because they are able to interact meaningfully with the varied activities.
7. Design Characteristics - The interactive LMS is presented in well-organized frames with clear illustrations and figures. They are so designed such that each lesson becomes a block in which the succeeding lessons are built upon. This accounts for sustained interest in the work. The style is simple with readable and grammatically correct texts. Verbal and perceptual skills complementing each other enable each learner to work on the LMS with ease. 8. There is a significant difference between the pretest and posttest mean scores of the students exposed to WileyPLUS. Furthermore, the posttest mean is significantly higher than the pretest mean which can be attributed to the use of the WileyPLUS. This implies that learning took place after the students were exposed to the technology module WileyPLUS.
9. There is a significant difference between the pretest and posttest mean scores of the students exposed to the lecture-discussion method of teaching. Furthermore, the posttest mean is significantly higher than the pretest mean which can be attributed to the use of lecture-discussion method of instruction. This indicates that learning took place after the students were exposed to the lecture-discussion method of instruction.
10. There is a significant difference between the posttest mean scores of the pretested students in favor of the experimental group. This shows that the use of WileyPLUS is significantly more effective than the lecture-discussion method of presenting the lessons after controlling for the effect of the pretest scores on students achievement.
11. There is a significant difference on the posttest mean scores of the students when grouped according to teaching method (the use of WileyPLUS and the lecture-discussion method) in favor of the experimental groups. This suggests that independent of testing, the students who were exposed to WileyPLUS achieved significantly better than those students who were exposed to the lecture-discussion method approach.
12. There is no significant difference on the posttest mean scores of the students when grouped according to testing (pretested and unpretested). This means that independent of teaching method, students’ achievement did not differ when grouped according to testing, and classifying the students based on testing is not needed to achieve better results. 13. There is no significant interaction between method of teaching and testing on the posttest mean scores of the students. This supports that teaching method (the use of WileyPLUS and the lecture-discussion method) and testing (pretested and unpretested) taken together may be expected not to have any significant effect on the students’ achievement.
ACKNOWLEDGMENT
Above all we thank God for the guidance He gave us during the hard times putting work in this research, those moments He gave us strength in pushing through so we can
be able to share our ideas to students like us, it was quite an experience, one which we will never forget. Most of all, we are grateful how He paved the way for us to have this opportunity. We thank our dearest family who never doubted that we can achieve, who believed in our talents and supported us all the way. Furthermore, we want to express our deepest gratitude to our mentors. The way they kept challenging us and pushing us to go our limits served uswell as we have accomplished what we wanted to do.
REFERENCES
[1] Agarwal, R. & Prasad, J. (1997). The Role of Innovation Characteristics and Perceived Voluntariness in the Acceptance of Information Technologies. Decision Science, 28(3), 557-582.
[2] Anderson, P., & Tushman, M. L. (1990). Technological discontinuities and dominant designs: A cyclical model of technological change. Administrative Science Quarterly, 35(4),
604-633.
[3] Bhattacherjee, A. & Premkumar, G. (2004). Understanding Changes in Belief and Attitude Toward Information Technology Usage: A Theoretical Model and Longitudinal Test. MIS Quarterly, 28(2), 229-254.
[4] Coburn, C. E. (2004). Beyond decoupling: Rethinking the relationship between the institutional environment and the classroom. Sociology of Education, 77, 211-244.
[5] Cooper, R. (1990). Information Technology Implementation Research: A Technology Diffusion Approach. Management Science,
36(2), 123-139.
[6] Davis, F., (1989). Perceived Usefulness, Perceived Ease of Use, and User Acceptance of Information Technology. MIS Quarterly, 13(3),
319-340.
[7] Igbaria, M., Parasuraman, S., & Baroudi, J. (1996). A Motivational Model of Microcomputer Usage. Journal of Management Information Systems, 13(1), 127-143.
[8] Lonn, S., & Teasley, S. D. (2009). Saving time or innovating practice: Investigating perceptions and uses of learning management systems.
Computers and Education,53, 686-694.
[9] Moore, G. & Benbasat, I., (1991). Development of an Instrument to Measure the Perceived Characteristics of Adopting an Information Technology Innovation. Information Systems Research, 1, 192-220.
[10] Moore, M. G. (1989). Three types of interaction. American Journal of Distance Education, 3(2), 1-6.
[11] Morgan, G. (2003). Faculty use of course management systems. Boulder, CO: EDUCAUSE Center for Applied Research.
[12] Reyes, Flordeliza C. Applied Basic Statistics. Phoenix Publishing House, Inc. 1996.
[13] Rogers, E. M. (2003). Diffusion of innovations (5 ed.). New York: Free Press.
[14] Shields, M. A. (Ed.). (1995). Work and technology in higher education: The social construction of academic computing. Hillsdale,
NJ: Lawrence Erlbaum.
[15] Smith, S. D., Salaway, G., & Caruso, J. B. (2009). The ECAR study of undergraduate students and information technology, 2009. Boulder, CO: EDUCAUSE.
[16] Surry, D. W. & Ensminger, D. C. (2003, April). Perceived importance of conditions that facilitate implementation. e-Journal of Instructional Science and Technology,6(1). [On-line] Available WWW:
http://www. usq. edu. au/electpub/e-jist/docs/Vol6_No1/pdf/Surry_Final. pdf.
[17] Surry, D., & Farquhar, J. (1997). Diffusion Theory and Instructional Technology. Journal of Instructional Science and Technology, 2(1). [18] Taylor, S. & Todd, R. (1995a) Assessing IT Usage: The Role of Prior