ORIGINAL RESEARCH
ADULT BRAIN
Improved Visualization of Cortical Lesions in Multiple Sclerosis
Using 7T MP2RAGE
XE.S. Beck,XP. Sati,XV. Sethi,XT. Kober,X B. Dewey,XP. Bhargava,XG. Nair,XI.C. Cortese, andXD.S. Reich
ABSTRACT
BACKGROUND AND PURPOSE: Cortical lesions are common and often extensive in multiple sclerosis but are difficult to visualize by MRI, leaving important questions about their clinical implications and response to therapy unanswered. Our aim was to determine whether cortical lesions are better visualized using magnetization prepared 2 rapid acquisition gradient echoes (MP2RAGE) than T2*-weighted imaging on 7T MR imaging.
MATERIALS AND METHODS: Brain MR imaging using T1-weighted MP2RAGE at 500-m isotropic resolution, T2*-weighted gradient-echo, and T2*-weighted segmented echo-planar imaging sequences were collected for 13 patients with MS and 5 age-matched neurolog-ically healthy controls on a 7T research system. One MS case underwent postmortem MR imaging including gradient-echo and MP2RAGE sequences, after which cortical lesions seen on MR imaging were assessed with immunohistochemistry.
RESULTS: MP2RAGE detected 203 cortical lesions (median, 16 lesions/case; interquartile range, 15), compared to 92 with T2*gradient-echo (median, 7; interquartile range, 8;P⬍.001) and 81 with T2*EPI (median, 7; interquartile range, 5;P⬍.001). This increase in lesion number detected on MP2RAGE versus T2* was observed for juxtacortical, leukocortical, and intracortical lesions. Forty-three percent of all cortical lesions were identified only on MP2RAGE. White matter lesion volume correlated with total juxtacortical (r⫽0.86,P⬍.001) and leukocortical lesion volume (r⫽0.70,P⬍.01) but not intracortical lesion volume, suggesting that pathophysiology may differ by lesion type. Of 4 suspected lesions seen on postmortem imaging, 3 were found to be true cortical lesions while 1 represented postmortem tissue damage.
CONCLUSIONS: A combination of MP2RAGE and T2*-weighted imaging at 7T improved detection of cortical lesions and should enable longitudinal studies to elucidate their spatiotemporal dynamics and clinical implications.
ABBREVIATIONS:GRE⫽gradient recalled-echo; IQR⫽interquartile range; MP2RAGE⫽magnetization prepared 2 rapid acquisition gradient echoes
M
S is a demyelinating disorder affecting both white and gray matter.1-3In some individuals, cortical demyelination ex-ceeds white matter demyelination,2and cortical lesions may be more strongly associated with disability and disability progression than white matter lesions.4-8Cortical and white matter lesionshave potentially distinct origins and levels of inflammation,3,9-13 suggesting that they may have different clinical significance and response to treatment. Finally, the clinical course of MS is often not fully explained by volume and accumulation of white matter lesions,14making better understanding of other types of MS pa-thology, including cortical lesions, imperative.
Although MR imaging is essential for MS diagnosis and dis-ease monitoring, our limited understanding of cortical lesions stems from difficulties in imaging these lesions due to their size, myelin content, level of inflammation, and partial volume
aver-Received August 10, 2017; accepted after revision November 15.
From the Translational Neuroradiology Section (E.S.B., P.S., V.S., B.D., G.N., D.S.R.) and Neuroimmunology Clinic (I.C.C.), National Institute of Neurological Disorders and Stroke, National Institutes of Health, Bethesda, Maryland; Advanced Clinical Imaging Technology Group (T.K.), Siemens Healthcare Switzerland, Lausanne, Swit-zerland; Department of Radiology (T.K.), Centre Hospitalier Universitaire Vaudois, Lausanne, Switzerland; LTS5, Ecole Polytechnique Fe´de´rale de Lausanne (T.K.), Laus-anne, Switzerland; and Department of Neurology (P.B.), Johns Hopkins University, Baltimore, Maryland.
This work was supported by the Intramural Research Program of the National In-stitute of Neurological Disorders and Stroke, National InIn-stitutes of Health. E.S.B. is further supported by a Clinician Scientist Development Award from the National Multiple Sclerosis Society. P.B. is supported by a career transition award from the National Multiple Sclerosis Society, a Young Investigator Award from Race to Erase MS, and a John F. Kurtzke Clinician Scientist Development Award from the American Academy of Neurology.
Please address correspondence to Daniel S. Reich, MD, PhD, Translational Neurora-diology Section, National Institute of Neurological Disorders and Stroke, National Institutes of Health, Building 10, Room 5C103, 10 Center Drive, Bethesda, MD 20892; e-mail: [email protected]
Indicates open access to non-subscribers at www.ajnr.org
Indicates article with supplemental on-line appendix and tables.
Indicates article with supplemental on-line photos.
aging with CSF. Double inversion recovery and phase-sensitive inversion recovery sequences at 1.5T and 3T and T2*-weighted sequences at 7T have been used to visualize cortical lesions.15-18 7T MR imaging allows much higher spatial resolution, which is particularly important for the visualization of small cortical le-sions, and T2*-weighted sequences at 7T have been shown to more sensitively and reliably detect cortical lesions than double inversion recovery at 3T.19However, small intracortical lesions remain difficult to visualize using all 3 of these techniques, and overall sensitivity remains low.20-22
Here, we aimed to develop an approach that could be used to investigate the natural history of cortical lesions in future studies, rather than develop an imaging sequence for routine clinical use. Recent studies in humans and nonhuman primates have demon-strated the value of T1-based MR imaging for visualizing the my-eloarchitecture of the cortex.23-25Among the different T1 MR imaging techniques, magnetization prepared 2 rapid acquisition gradient echoes (MP2RAGE) provides the best tissue contrast at high spatial resolution while minimizing field inhomogeneities that affect other techniques at 7T.26,27We achieved high resolu-tion while preserving image quality by combining multiple repe-titions of the same 3D MP2RAGE acquisition. We also compared visualization of cortical lesions on MP2RAGE with 2 different T2*-weighted acquisitions.
MATERIALS AND METHODS
In Vivo MR ImagingThirteen participants in our MS natural history study and 5 neu-rologically healthy, age-matched controls (On-line Table 1) underwent brain MR imaging on a 7T whole-body research sys-tem (Siemens, Erlangen, Germany) equipped with a single-chan-nel transmit, 32-chansingle-chan-nel phased array receive head coil. To max-imize cortical lesion count, we included patients with MS with prior high-quality 7T scans and longstanding disease. The MP2RAGE sequence used previously optimized parameters ( Ta-ble 1),28covered the entire cerebrum, was acquired at 500-m isotropic resolution, and was repeated 4 times to improve image quality (total scan time:⬃40 minutes; On-line Fig 1). A 2D T2* gradient recalled-echo (GRE) sequence (215⫻215⫻1000m), like one previously demonstrated to visualize cortical lesions,18 was acquired in 3 partially overlapping volumes to cover most of the cerebrum (total scan time,⬃25 minutes). A novel 3D seg-mented T2*EPI prototype sequence29,30was acquired in 2 par-tially overlapping volumes at the same resolution as MP2RAGE
(total scan time,⬃7 minutes) (Table 1). In 2 patients with MS, the T2* sequences were acquired during the same session as MP2RAGE; in the other 11, one or both T2* sequences were ac-quired on a separate day. The interval between MP2RAGE and GRE or EPI ranged from⫺8 to⫹18 months; in 10 of the patients with MS, MP2RAGE was acquired first. All patients with MS were also scanned on a 3T Magnetom Skyra scanner (Siemens) equipped with a 32-channel head coil (On-line Table 2).
Image Processing
Initial MP2RAGE processing to generate uniform images and T1 maps was performed on the scanner as part of the Siemens re-search sequence package (Work-in-Progress Package #900B).26 The 4 repetitions were coregistered, and the voxelwise median was used for all analyses. T2*GRE and T2*EPI were aligned to the MP2RAGE using linear coregistration. See the On-line Appendix for further details.
Lesion Identification and Characterization
Image analysis was conducted using a freely available image anal-ysis software (Medical Image Processing, Analanal-ysis, and Visualiza-tion; National Institutes of Health; https://mipav.cit.nih.gov/). Images were magnified using bilinear interpolation as needed, and raters could manipulate window and level settings. Lesions were identified in the axial plane, with the option to confirm them on sagittal and coronal images. Lesions had to be hypointense on MP2RAGE images and/or hyperintense on T2* images and visible on at least 2 contiguous axial slices. Lesions were classified as intracortical (no white matter involvement; includes subpial le-sions), leukocortical (involving both white matter and cortex), or juxtacortical (white matter lesions abutting but not clearly involv-ing the cortex). Data were then compared across sequences. Com-parison revealed that some cortical lesions were artifacts or white matter lesions that did not directly contact the cortex; these were excluded from further analyses.
[image:2.594.54.534.55.181.2]E.S.B. (neurologist with 5 years’ experience) marked cortical lesions on each sequence independently for all patients and con-trols, with at least 1 day between analyses of different sequences for the same individual. D.S.R. (neurologist/neuroradiologist with 14 years’ experience) verified all lesions. Locations corre-sponding to lesions identified on only 1 or 2 sequences were ex-amined on the remaining sequences to determine whether these lesions could be identified retrospectively. All lesions identified by E.S.B. and verified by D.S.R. (total 309)were included in lesion
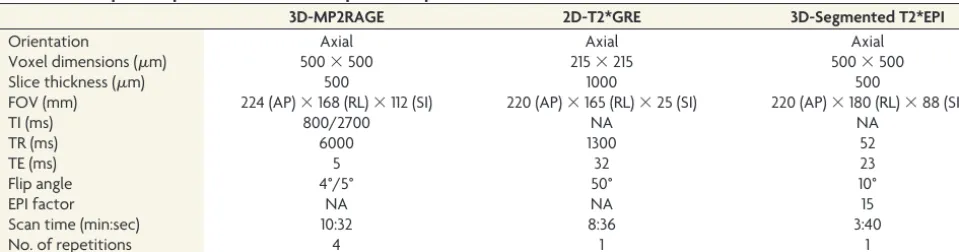
Table 1: MRI acquisition parameters for the 3 sequences acquired at 7T
3D-MP2RAGE 2D-T2*GRE 3D-Segmented T2*EPI
Orientation Axial Axial Axial
Voxel dimensions (m) 500⫻500 215⫻215 500⫻500
Slice thickness (m) 500 1000 500
FOV (mm) 224 (AP)⫻168 (RL)⫻112 (SI) 220 (AP)⫻165 (RL)⫻25 (SI) 220 (AP)⫻180 (RL)⫻88 (SI)
TI (ms) 800/2700 NA NA
TR (ms) 6000 1300 52
TE (ms) 5 32 23
Flip angle 4°/5° 50° 10°
EPI factor NA NA 15
Scan time (min:sec) 10:32 8:36 3:40
No. of repetitions 4 1 1
volume, count, and T1 relaxation time analyses. Lesions within the FOV for all 3 sequences (total 220) were used for sequence-comparison analyses. In 1 patient, T2*GRE images were too mo-tion-degraded to analyze, and lesions identified on MP2RAGE and T2*EPI for this patient were included in all analyses except for sequence comparisons.
To determine interrater agreement, P.B. (neurologist with 7 years’ experience) marked cortical lesions on each sequence inde-pendently for 5 of the 13 patients with MS and all controls, with verification of all lesions by D.S.R. These ratings were then com-pared with those of E.S.B. for the same patients and controls. To determine intrarater agreement, E.S.B. re-analyzed the same 5 patients with MS several months after the first set of ratings.
To compute lesion volume, a single rater (E.S.B.) delineated ROIs manually, along the border of each lesion on all slices in which the lesion appeared on MP2RAGE. Total white matter le-sion volume was also estimated using 3T FLAIR and MP2RAGE images. Images were registered to a brain atlas,31and lesions were then segmented with LesionTOADS software (https://www. nitrc.org/projects/toads-cruise).32 Segmentation results were manually reviewed and corrected as necessary.
T1 relaxation times were obtained for each lesion using the median MP2RAGE T1 map. To obtain T1 values for normal-appearing tissue and control tissue, we randomly chose 1 intra-cortical, 1 leukointra-cortical, and 1 juxtacortical lesion for each case. For normal-appearing cortex and white matter, a contralateral ROI on a single slice was selected for each lesion. For control cortex and white matter, an ROI on a single slice matching each of the chosen lesions was selected in a control brain; ROIs were dis-tributed evenly among the 5 control brains.
Statistics
The Kruskal-Wallis test with correction for multiple comparisons allowed cross-sequence comparison of lesion counts as well as lesion subtype count and volume analyses. One-way analysis of variance with correction for multiple comparisons allowed com-parison of T1 relaxation times. Spearman correlation coefficients linked the volume of the cortical lesion subtypes with that of white matter lesions.
Standard Protocol Approvals, Registrations, and Consents
The study received approval from the NIH institutional review board, where the study was performed. All participants provided written informed consent. The next of kin for the person whose brain was evaluated postmortem provided written informed con-sent for the brain postmortem examination and use of material and clinical information for research purposes.
RESULTS
More Cortical Lesions were Identified on MP2RAGE than on T2*-Weighted Images In Vivo at 7T
7T images from 13 patients with MS and 5 neurologically healthy controls were analyzed (demographics in On-line Table 1). Three hundred nine cortical lesions were identified in the patients with MS (median, 24; range, 3– 62; interquartile range [IQR], 15), in-cluding 85 juxtacortical (median, 5; range, 0 –29; IQR, 5), 164
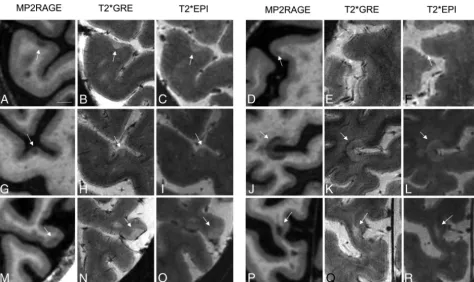
leukocortical (median, 14; range, 1–30; IQR, 12), and 60 intracor-tical (median, 3; range, 0 –13; IQR, 3) lesions.Figure 1shows representative examples of lesion appearance across sequences. Small intracortical lesions identified on MP2RAGE were often visible in retrospect on T2*GRE and/or T2*EPI (Fig 1G–I); the same was true on MP2RAGE for several lesions initially identified only on T2* (see below). Some lesions initially classified as white matter or juxtacortical on T2* were reclassified after comparison with MP2RAGE (Fig 1P–R), where the gray-white junction was better defined. Cortical involvement of some leukocortical le-sions, in particular U-shaped lesions at the depths of the sulci, was more obvious on T2* than on MP2RAGE, where cortical (partic-ularly subpial) involvement was sometimes subtler (Fig 1J–L).
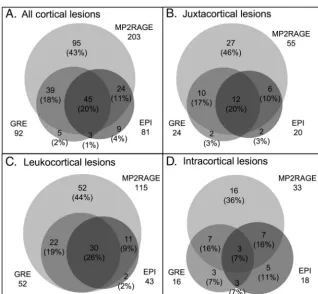
Almost twice as many cortical lesions were detected on MP2RAGE as on T2* (Fig 2andTable 2), independent of lesion subtype. A single cortical lesion was identified in 1 of the 5 healthy controls; this lesion was leukocortical and seen only on MP2RAGE (On-line Fig 2).
Forty-nine percent (108/220) of cortical lesions were identi-fied on both MP2RAGE and at least 1 of the T2* sequences, and 43% (95/220) were identified only on MP2RAGE. Only 8% (17/ 220) were identified on at least 1 of the T2* sequences but not on MP2RAGE. These numbers were similar for juxtacortical and leu-kocortical lesions (Fig 2). For intracortical lesions, 39% (17/44) were identified on both MP2RAGE and at least 1 T2* sequence, whereas 36% (16/44) were identified on MP2RAGE only and 25% (11/44) were identified only on T2*.
The number of total cortical lesions identified on the 2 T2* sequences did not differ, nor did the number of any of the 3 cortical lesion subtypes (Fig 2andTable 2). Lesion subtype and size did not differ between lesions identified on T2*EPI but not GRE and lesions identified on T2*GRE but not EPI (On-line Ta-ble 4).
Lesions initially identified only on 1 or 2 sequences were eval-uated retrospectively on the remaining sequences. Eighty-eight percent (84/95) of lesions identified prospectively on MP2RAGE only were seen in retrospect on at least 1 of the T2* sequences. Forty-six of the 84 lesions were small or had only subtle signal change on T2* images, likely explaining the lack of prospective identification, while 36 of the 84 lesions were visible but did not have clear cortical involvement on the T2* images; only 2 of the 84 lesions had obvious cortical involvement on T2* images, which had been missed in the initial analysis. All 17 lesions prospectively identified on T2* sequences but not on MP2RAGE were seen retrospectively on MP2RAGE images. Eleven of the 17 lesions were small or had only subtle signal changes on MP2RAGE, 2 lesions did not appear to involve the cortex on MP2RAGE, and 4 lesions had obvious cortical involvement on MP2RAGE but had been missed in the initial analysis. Ninety-eight percent (43/44) of the lesions identified on T2*GRE but not T2*EPI were visible in retrospect on T2*EPI, and 94% (31/33) of the lesions identified on T2*EPI but not T2*GRE were visible in retrospect on T2*GRE.
Inter- and Intrarater Variability is Higher for T2* than for MP2RAGE
identified on at least 1 sequence by both raters, whereas 56% of lesions were identified by only 1 rater. This discrepancy was great-est for intracortical lesions, of which only 26% were identified by both raters, compared with 51% for leukocortical and 52% for juxtacortical lesions. On MP2RAGE, 48% of lesions were identi-fied by both raters; more than twice as many as were identiidenti-fied by both raters on T2*GRE (23%) or T2*EPI (22%).
Intrarater variability for the same 5 cases was similar to inter-rater variability, with 47% of lesions identified on at least 1 se-quence by both raters and 53% of lesions identified only once. Fifty-two percent of lesions identified on MP2RAGE were identified both times, compared with 40% on T2*GRE and 24% on T2*EPI.
Number and Volume of Cortical Lesion Subtypes Vary Widely across Patients
Across the 13 patients with MS, there were more leukocortical (164) than intracortical (60) or juxtacortical (85) lesions. For each individual, however, the relative number of lesions of each type was highly variable, as was cortical lesion volume (On-line Fig 3 and On-line Table 5). Total white matter lesion volume did not correlate with intracortical lesion volume (P⫽.44), but leuko-cortical lesion volume (r⫽0.71,P⫽.009) and juxtacortical lesion volume (r⫽ 0.86,P⬍ .001) each correlated with total white matter lesion volume (Fig 3A–C).
When stratified by volume, 72% of the largest third of lesions (range, 55–2854L; mean, 200L) were identified on MP2RAGE
and at least 1 T2* sequence, whereas 26% were identified only on MP2RAGE and 3% were identified only on T2*. In contrast, for le-sions with volumes in the middle third (range, 26 –55L; mean, 40 L), 46% were identified on both sequence types, whereas 41% were identified on MP2RAGE only and 14% on T2* only. For the smallest third of lesions (range, 5–26L; mean, 15L), 30% were identified on both sequence types; 63%, on MP2RAGE only; and 7%, on T2* only. Thus, larger lesions are more likely to be identified on both MP2RAGE and T2* sequences, whereas smaller lesions are more likely to be identified on only MP2RAGE.
T1 Relaxation Times Differ across Cortical Lesion Types
The mean T1 relaxation times were calculated for each cortical lesion, for normal-appearing gray and white matter in patients with MS, and for control cortex and white matter (Fig 3D). The mean T1 was higher in juxtacortical (2062⫾230 ms) than in leukocortical (1961⫾182 ms,P⬍.001) or intracortical (1871⫾ 96 ms,P⬍.001) lesions. Leukocortical lesions also had higher T1 than intracortical lesions (P⬍.001). The mean T1 relaxation time for each lesion type was higher (P⬍.001) than for the corre-sponding normal-appearing and control tissue. There was no dif-ference between normal-appearing (1703⫾90 ms) and control (1685 ⫾ 88 ms) gray matter or between normal-appearing (1261⫾92 ms) and control (1207⫾86 ms) white matter. T1 of lesions identified on both MP2RAGE and at least 1 T2* sequence
[image:4.594.57.532.45.327.2](2012⫾213 ms) was higher than that of lesions identified only on MP2RAGE (1923⫾182 ms,P⬍.01) and those identified only on T2* sequences (1893⫾87 ms,P⬍.05). The T1 of lesions identi-fied on MP2RAGE only was not significantly different from that of lesions identified on T2* only.
Most Cortical Lesions Visualized by MP2RAGE on Postmortem 7T MR Imaging Can Be Verified Pathologically
One postmortem MS brain was imaged at 7T with MP2RAGE and T2*GRE (On-line Appendix). The areas of tissue corresponding to 4 suspected leukocortical lesions, all with predominantly cor-tical involvement, were isolated and stained for myelin proteo-lipid protein. Three of the suspected lesions, all of which were identified prospectively on MP2RAGE and T2*GRE, were clearly demyelinated lesions (On-line Fig 4). The fourth, which was iden-tified on T2*GRE prospectively and only seen in retrospect on MP2RAGE, was a small tear in the cortex that likely occurred during postmortem handling.
DISCUSSION
In this study, we show that acquisition of high-resolution MP2RAGE at 7T dramatically increases the detection of cortical lesions compared with state-of-the-art T2*GRE or our prototype T2*EPI sequence. Reasons for the superior sensitivity of MP2RAGE over T2* include more homogeneous signal intensity, better gray-white junction delineation, and decreased image arti-facts. Importantly, we found that MP2RAGE allowed identifica-tion of smaller and more subtle lesions while generally preserving visualization of lesions identifiable on T2*.
Our comparison of MP2RAGE images acquired in patients with MS and controls, our postmortem verification of several cortical lesions seen on MP2RAGE, and our retrospective identi-fication of most lesions seen on MP2RAGE on T2* images to-gether suggest that most identified cortical lesions are true demy-elinated lesions. Although we cannot rule out that some cortical lesions identified in MS are due to other types of tissue damage or artifacts (also the case for white matter lesions), the number of such lesions is likely low.
Despite the advantages of MP2RAGE, some cortical lesions were seen better on T2* images, whereas others appeared to have different degrees of cortical in-volvement on MP2RAGE versus T2*. Some cortical lesions appeared subpial on T2* but not on MP2RAGE (eg,Fig 1M–O). One potential explanation is that there are pathologic differences in lesions close to the pial surface versus deeper in the cortex, leading to differ-ences in visualization on MR imaging. T2* sequences may also be particularly sensitive to cortical pathology due to dif-ferences in magnetic susceptibility be-tween cortical layers. A more definitive answer to this question will require de-tailed postmortem MR imaging– histo-pathologic correlation.
Although we hypothesize that the ability of MP2RAGE and T2* to detect cortical lesions differs in part due to spe-cific pathologic features of different le-sions, most lesions identified on 1 or 2 sequences were visible on the remainder of the sequences in retrospect. When evaluated retrospectively, many lesions missed initially on T2* were small or had
[image:5.594.55.374.281.575.2]FIG 2. Increased cortical lesion detection with MP2RAGE. Venn diagrams show comparison of prospective lesion identification with MP2RAGE, T2*GRE, and T2*EPI for all cortical lesions and for each cortical lesion subtype.
Table 2. Comparison of lesion identification on MP2RAGE, T2*GRE, and T2*EPI images
MP2RAGE T2* GRE T2* EPI Significance
Total
Per Patient
Total
Per Patient
Total
Per Patient
MP2RAGE vs GRE
MP2RAGE vs EPI
GRE vs EPI Median
Range,
IQR Median
Range,
IQR Median
Range, IQR
All 203 16 3–35, 15 92 8 0–21, 8 81 7 0–15, 5 *** *** NS
Juxtacortical 55 4 0–13, 4 24 2 0–18, 2 20 2 0–6, 4 * * NS
Leukocortical 115 11 1–21, 10 52 4 0–11, 4 43 4 0–8, 5 ** *** NS
Intracortical 33 2 0–8, 3 16 1 0–5, 2 18 1 0–6, 2 * NS NS
[image:5.594.53.534.629.722.2]only a subtle signal change, which was compounded by the higher prevalence of motion artifacts on T2* images and the increased slice thickness on T2*GRE. In addition, likely due to their small size and sometimes subtle nature, many cortical lesions are missed when a single rater evaluates an image, a particular problem with T2*. Thus, going forward, multiple raters, each using MP2RAGE and T2* images, will likely allow the most sensitive and accurate detection of cortical lesions. A computational method for identi-fying potential cortical lesions on the basis of T1 values that differ from those of the surrounding cortex may also be useful in the future for more comprehensive lesion detection.
One limitation to the sequence comparison performed here is that the MP2RAGE images used were derived from averaging 4 acquisitions and had a longer total acquisition time than the T2*
sequences. Our goal was to identify as many cortical lesions as possible using sequences with optimal image quality; while this goal required averaging for MP2RAGE to achieve image qual-ity similar to that of single acquisitions for the T2* sequences, we believe that the comparison of sequences performed here is valid.
In this study, we subcategorized cortical lesions as intracorti-cal, leukocortiintracorti-cal, and juxtacortical but did not further subclassify intracortical lesions; even at high resolution, it was often difficult to distinguish intracortical lesions elsewhere categorized as types II, III, and IV.33We also chose not to distinguish between leuko-cortical lesions that mostly affect the cortex versus those that mostly affect white matter because relative cortical and white mat-ter involvement appears to be a continuum; however, it will be
[image:6.594.52.529.47.489.2]interesting to study cortical lesion evolution longitudinally to dis-tinguish lesions that originate in the cortex versus white matter. The T2*EPI sequence appeared to be as good as T2*GRE for the identification of cortical lesions, despite the larger voxel volume and substantially shorter imaging time. We therefore propose us-ing T2*EPI as a second sequence for cortical lesion identification, to confirm lesions identified on MP2RAGE and assess their sub-pial involvement.
Previous work correlating different types and severity of MS with cortical lesion number has been, for the most part, per-formed at low field strength using double and phase-sensitive inversion recovery34-38; it is likely that cortical lesions identified in those studies were heavily skewed toward juxtacortical and leu-kocortical lesions, underestimating the number of intracortical lesions.39With the increased sensitivity to small cortical lesions provided by MP2RAGE, we were able to more accurately deter-mine the correlation between cortical and white matter lesions. We found that total juxtacortical and leukocortical but not intra-cortical lesion volume correlated with white matter lesion volume and that even this correlation may be driven by high-lesion-load cases, providing evidence that the pathophysiologic processes leading to cortical and white matter lesion formation and/or growth are distinct. Thus, it seems likely to us that following white matter lesion evolution may not yield a complete picture of the disease, and treatments that are effective in stopping new white matter lesions may not stop cortical lesion formation. We did not find any correlation between cortical lesion number or volume and clinical characteristics, but this may be due to the small sam-ple size and our participant-selection method, which favored in-dividuals with long-standing MS and known cortical lesions. Larger prospective studies using the methodology described here are therefore necessary.
MP2RAGE also provides T1 maps, which could further help quantitatively characterize lesions40and tease out pathologic dif-ferences among lesion types. We show that T1 differs across cor-tical lesion subtypes. Differences between the T1 of lesions and their corresponding control tissue are smallest for intracortical lesions; these small differences make them harder to detect. Changes in cortical lesion T1 may prove useful as a marker for tissue destruction and recovery.
Although our combination of MR imaging sequences at 7T improves detection of cortical lesions, one major limitation is the long acquisition time required (approximately 70 minutes for all 3 sequences), restricting the use of this approach to the research setting. However, it may be possible to decrease the number of MP2RAGE scan repetitions for clinical use, decreasing sensitivity but still likely representing an improvement over the current stan-dard. Future advances in phased array coil designs and parallel imaging methods may also allow reduction in scan time without substantial loss in lesion identification. Another limitation of our study is that MP2RAGE and T2* sequences were sometimes ac-quired several months apart, and we cannot fully discount the possibility that differences in lesion identification were due to lesion formation or evolution between MRIs. However, in almost all cases, T2* images were acquired after MP2RAGE images, so the increased lesion identification on MP2RAGE cannot be attributed to new lesion formation between scans.
CONCLUSIONS
We demonstrate here that improved cortical lesion detection can be achieved in vivo by using a unique combination of MR imaging sequences at 7T. This advance may allow assessment of whether cortical lesions account for some of the clinical heterogeneity in MS that is not explained by white matter lesion load and could help better predict the course of disease and guide treatment.
ACKNOWLEDGMENTS
We thank Martina Absinta, Matthew Schindler, Souheil Inati, and the staff of the National Institutes of Health functional MRI Fa-cility for help with MR imaging acquisitions. We also thank Joan Ohayon, Frances Andrada, and the staff of the National Institute of Neurological Disorders and Stroke Neuroimmunology Clinic for care of and collection of clinical data from the study partici-pants. The National Cancer Institute Laboratory of Pathology and Seung Kown Ha assisted in acquiring and processing the patho-logic material. Gina Norato of the National Institute of Neurolog-ical Disorders and Stroke ClinNeurolog-ical Trials Unit helped with statis-tical analyses.
Disclosures: Erin S. Beck—RELATED:Grant: National Multiple Sclerosis Society, Comments: I am the recipient of a Clinician Scientist Development Award from the National Multiple Sclerosis Society*. Tobias Kober—RELATED:Employment: Sie-mens, Switzerland. Daniel S. Reich—RELATED:Grant: National Multiple Sclerosis Society,Comments: Fellowship Grant to Erin S. Beck*;UNRELATED:Other: Vertex Pharmaceuticals, Myelin Repair Foundation,Comments: Funds for research were transferred to my institution as part of Cooperative Research and Development Agreements*. *Money paid to the institution.
REFERENCES
1. Brownell B, Hughes JT.The distribution of plaques in the cerebrum in multiple sclerosis.J Neurol Neurosurg Psychiatry1962;25:315–20
CrossRef Medline
2. Bø L, Vedeler CA, Nyland HI, et al.Subpial demyelination in the cerebral cortex of multiple sclerosis patients.J Neuropathol Exp Neurol2003;62:723–32CrossRef Medline
3. Lucchinetti CF, Popescu BF, Bunyan RF, et al.Inflammatory cortical demyelination in early multiple sclerosis.N Engl J Med2011;365: 2188 –97CrossRef Medline
4. Calabrese M, Agosta F, Rinaldi F, et al.Cortical lesions and atrophy associated with cognitive impairment in relapsing-remitting mul-tiple sclerosis.Arch Neurol2009;66:1144 –50Medline
5. Calabrese M, Poretto V, Favaretto A, et al.Cortical lesion load asso-ciates with progression of disability in multiple sclerosis.Brain
2012;135:2952– 61CrossRef Medline
6. Harrison DM, Roy S, Oh J, et al.Association of cortical lesion bur-den on 7-T magnetic resonance imaging with cognition and disabil-ity in multiple sclerosis.JAMA Neurol2015;72:1004 –12CrossRef Medline
7. Kutzelnigg A, Lucchinetti CF, Stadelmann C, et al.Cortical demyeli-nation and diffuse white matter injury in multiple sclerosis.Brain
2005;128:2705–12CrossRef Medline
8. Calabrese M, Romualdi C, Poretto V, et al.The changing clinical course of multiple sclerosis: a matter of gray matter.Ann Neurol
2013;74:76 – 83CrossRef Medline
9. Magliozzi R, Howell O, Vora A, et al.Meningeal B-cell follicles in secondary progressive multiple sclerosis associate with early onset of disease and severe cortical pathology.Brain2007;130:1089 –104
Medline
10. Magliozzi R, Howell OW, Reeves C, et al.A gradient of neuronal loss and meningeal inflammation in multiple sclerosis.Ann Neurol
2010;68:477–93CrossRef Medline
is widespread and linked to cortical pathology in multiple sclerosis. Brain2011;134:2755–71CrossRef Medline
12. Choi SR, Howell OW, Carassiti D, et al.Meningeal inflammation plays a role in the pathology of primary progressive multiple scle-rosis.Brain2012;135:2925–37CrossRef Medline
13. Absinta M, Vuolo L, Rao A, et al.Gadolinium-based MRI character-ization of leptomeningeal inflammation in multiple sclerosis. Neu-rology2015;85:18 –28CrossRef Medline
14. Filippi M, Charil A, Rovaris M, et al.Insights from magnetic reso-nance imaging. Handb Clin Neurol 2014;122:115– 49 CrossRef Medline
15. Geurts JJ, Pouwels PJ, Uitdehaag BM, et al.Intracortical lesions in mul-tiple sclerosis: improved detection with 3D double inversion-recovery MR imaging.Radiology2005;236:254 – 60CrossRef Medline
16. Calabrese M, De Stefano N, Atzori M, et al.Detection of cortical inflammatory lesions by double inversion recovery magnetic reso-nance imaging in patients with multiple sclerosis.Arch Neurol2007; 64:1416 –22CrossRef Medline
17. Nelson F, Poonawalla AH, Hou P, et al.Improved identification of intracortical lesions in multiple sclerosis with phase-sensitive in-version recovery in combination with fast double inin-version recov-ery MR imaging.AJNR Am J Neuroradiol2007;28:1645– 49CrossRef Medline
18. Mainero C, Benner T, Radding A, et al.In vivo imaging of cortical pathology in multiple sclerosis using ultra-high field MRI. Neurol-ogy2009;73:941– 48CrossRef Medline
19. Nielsen AS, Kinkel RP, Tinelli E, et al.Focal cortical lesion detection in multiple sclerosis: 3 Tesla DIR versus 7 Tesla FLASH-T2.J Magn Reson Imaging2012;35:537– 42CrossRef Medline
20. Geurts JJ, Bo¨ L, Pouwels PJ, et al.Cortical lesions in multiple sclerosis: combined postmortem MR imaging and histopathology. AJNR Am J Neuroradiol2005;26:572–77Medline
21. Pitt D, Boster A, Pei W, et al.Imaging cortical lesions in multiple sclerosis with ultra-high-field magnetic resonance imaging.Arch Neurol2010;67:812–18CrossRef Medline
22. Jonkman LE, Klaver R, Fleysher L, et al.Ultra-high-field MRI visu-alization of cortical multiple sclerosis lesions with T2 and T2*: a postmortem MRI and histopathology study.AJNR Am J Neuroradiol
2015;36:2062– 67CrossRef Medline
23. Haast RA, Ivanov D, Formisano E, et al.Reproducibility and reliabil-ity of quantitative and weighted T1 and T2 * mapping for myelin-based cortical parcellation at 7 Tesla.Front Neuroanat2016;10:112
CrossRef Medline
24. Geyer S, Weiss M, Reimann K, et al.Microstructural parcellation of the human cerebral cortex: from Brodmann’s post-mortem map to in vivo mapping with high-field magnetic resonance imaging.Front Hum Neurosci2011;5:19CrossRef Medline
25. Bock NA, Hashim E, Kocharyan A, et al.Visualizing
myeloarchitec-ture with magnetic resonance imaging in primates.Ann N Y Acad Sci2011;1225(suppl 1):E171– 81CrossRef Medline
26. Marques JP, Kober T, Krueger G, et al.MP2RAGE, a self bias-field corrected sequence for improved segmentation and T1-mapping at high field.Neuroimage2010;49:1271– 81CrossRef Medline
27. O’Brien KR, Kober T, Hagmann P, et al.Robust T1-weighted struc-tural brain imaging and morphometry at 7T using MP2RAGE.PLoS One2014;9:e99676CrossRef Medline
28. Marques JP, Gruetter R.New developments and applications of the MP2RAGE sequence: focusing the contrast and high spatial resolu-tion R1 mapping.PLoS One2013;8:e69294CrossRef Medline
29. Sati P, Thomasson DM, Li N, et al.Rapid, high-resolution, whole-brain, susceptibility-based MRI of multiple sclerosis.Mult Scler
2014;20:1464 –70CrossRef Medline
30. Sati P, Patil S, Inati S, et al.Rapid MR susceptibility imaging of the brain using segmented 3D echo-planar imaging (3D EPI) and its clinical applications.Magnetom FLASH2017;68:26 –32
31. Fonov V, Evans AC, Botteron K, et al; Brain Development Coopera-tive Group.Unbiased average age-appropriate atlases for pediatric studies.Neuroimage2011;54:313–27CrossRef Medline
32. Shiee N, Bazin PL, Ozturk A, et al.A topology-preserving approach to the segmentation of brain images with multiple sclerosis lesions. Neuroimage2010;49:1524 –35CrossRef Medline
33. Peterson JW, Bo¨ L, Mo¨rk S, et al.Transected neurites, apoptotic neurons, and reduced inflammation in cortical multiple sclerosis lesions.Ann Neurol2001;50:389 – 400CrossRef Medline
34. Calabrese M, Filippi M, Rovaris M, et al.Evidence for relative corti-cal sparing in benign multiple sclerosis: a longitudinal magnetic resonance imaging study.Mult Scler2009;15:36 – 41Medline
35. Diker S, Has AC, Kurne A, et al.The association of cognitive impair-ment with gray matter atrophy and cortical lesion load in clinically isolated syndrome.Mult Scler Relat Disord2016;10:14 –21CrossRef Medline
36. Absinta M, Rocca MA, Moiola L, et al.Cortical lesions in children with multiple sclerosis.Neurology2011;76:910 –13CrossRef Medline
37. Papadopoulou A, Mu¨ller-Lenke N, Naegelin Y, et al.Contribution of cortical and white matter lesions to cognitive impairment in multi-ple sclerosis.Mult Scler2013;19:1290 –96CrossRef Medline
38. Nelson F, Datta S, Garcia N, et al.Intracortical lesions by 3T mag-netic resonance imaging and correlation with cognitive impair-ment in multiple sclerosis.Mult Scler2011;17:1122–29CrossRef Medline
39. Seewann A, Kooi EJ, Roosendaal SD, et al.Postmortem verification of MS cortical lesion detection with 3D DIR.Neurology2012;78: 302– 08CrossRef Medline
40. Kober T, Granziera C, Ribes D, et al.MP2RAGE multiple sclerosis magnetic resonance imaging at 3 T.Invest Radiol2012;47:346 –52