ORIGINAL RESEARCH
ADULT BRAIN
Progressing Bevacizumab-Induced Diffusion Restriction Is
Associated with Coagulative Necrosis Surrounded by Viable
Tumor and Decreased Overall Survival in Patients with
Recurrent Glioblastoma
XH.S. Nguyen,XN. Milbach,XS.L. Hurrell,XE. Cochran,XJ. Connelly,XJ.A. Bovi,XC.J. Schultz,XW.M. Mueller,XS.D. Rand, XK.M. Schmainda, andXP.S. LaViolette
ABSTRACT
BACKGROUND AND PURPOSE: Patients with recurrent glioblastoma often exhibit regions of diffusion restriction following the initiation of bevacizumab therapy. Studies suggest that these regions represent either diffusion-restricted necrosis or hypercellular tumor. This study ex-plored postmortem brain specimens and a population analysis of overall survival to determine the identity and implications of such lesions.
MATERIALS AND METHODS:Postmortem examinations were performed on 6 patients with recurrent glioblastoma on bevacizumab with progressively growing regions of diffusion restriction. ADC values were extracted from regions of both hypercellular tumor and necrosis. A receiver operating characteristic analysis was performed to define optimal ADC thresholds for differentiating tissue types. A retrospective population study was also performed comparing the overall survival of 64 patients with recurrent glioblastoma treated with bevacizumab. Patients were separated into 3 groups: no diffusion restriction, diffusion restriction that appeared and progressed within 5 months of bevaci-zumab initiation, and delayed or stable diffusion restriction. An additional analysis was performed assessing tumorO6 -methylguanine-DNA-methyltransferasemethylation.
RESULTS:The optimal ADC threshold for differentiation of hypercellularity and necrosis was 0.736⫻10⫺3mm2/s. Progressively expanding diffusion restriction was pathologically confirmed to be coagulative necrosis surrounded by viable tumor. Progressive lesions were associated with the worst overall survival, while stable lesions showed the greatest overall survival (P⬍.05). Of the 40% of patients with O6-methylguanine-DNA-methyltransferasemethylated tumors, none developed diffusion-restricted lesions.
CONCLUSIONS: Progressive diffusion-restricted lesions were pathologically confirmed to be coagulative necrosis surrounded by viable tumor and associated with decreased overall survival. Stable lesions were, however, associated with increased overall survival. All lesions were associated withO6-methylguanine-DNA-methyltransferaseunmethylated tumors.
ABBREVIATIONS:GBM⫽glioblastoma;MGMT⫽O6
-methylguanine-DNA-methyltransferase;OS⫽overall survival
G
lioblastoma (GBM) is the most common primary brain tu-mor in adults, and the standard treatment of surgery, radia-tion, and chemotherapy is associated with a median survival of 15 months.1At recurrence, patients typically survive only another 30weeks.2-4Bevacizumab is a monoclonal antibody that selectively
binds to human vascular endothelial growth factor. It is FDA-approved for recurrent GBM5and has been shown to improve
progression-free survival6but not overall survival (OS). When
given in initial treatment regimens, it has shown no benefit in OS.7,8The permeability of the blood-brain barrier is reduced by
bevacizumab; this reduction complicates the use of gadolinium contrast enhancement for the evaluation of tumor response be-cause tumor enhancement can recede without a true antitumor response.9As a result, the Response Assessment for
Neuro-On-cology group published new suggestions that include antiangio-genic therapy.10
Other multiparametric MR imaging sequences are beginning to gain momentum in detecting infiltrative tumor and determin-ing treatment response. Perfusion imagdetermin-ing methods such as DSC have been shown to be effective at measuring the response to bevacizumab.11-13Diffusion-weighted imaging and apparent
dif-Received March 29, 2016; accepted after revision June 23.
From the Departments of Neurosurgery (H.S.N., W.M.M.), Radiology (N.M., S.L.H., S.D.R., K.M.S., P.S.L.), Pathology (E.C.), Neurology (J.C.), Radiation Oncology (J.A.B., C.J.S.), and Biophysics (K.M.S., P.S.L.), Medical College of Wisconsin, Milwaukee, Wisconsin. This work was supported by Advancing a Healthier Wisconsin, Medical College of Wisconsin Research Affairs Committee, National Cancer Institute U01-CA176110, National Institutes of Health/National Cancer Institute R01 CA082500, American Brain Tumor Association Discovery Grant DG1600004, NIH UL1TR001436, and par-tial funding allotted by the Medical College of Wisconsin, Department of Neurology.
Please address correspondence to Peter S. LaViolette, PhD, Department of Radiol-ogy, Medical College of Wisconsin, 8701 Watertown Plank Rd, Milwaukee, WI 53226; e-mail: [email protected]
Indicates open access to non-subscribers at www.ajnr.org
fusion coefficient temozolomide maps measure the free diffusion of water in tissue. ADC has been shown to inversely correlate with tumor cellularity in glioma,14,15and ADC difference maps or
functional diffusion maps are predictive of response to chemo-therapy,16,17radiation therapy,18and bevacizumab.19,20
Some patients, when given bevacizumab, develop focal re-gions of diffusion restriction. These lesions, when stable, have been shown to be associated with increased survival.21Conflicting
studies have shown these regions to be either diffusion-restricted necrosis or hypercellular tumor.21-28One recent article reported
regions of both within ADC-FLAIR mismatch (ie, diffusion re-striction within fluid-attenuated inversion recovery hyperinten-sity) and found that diffusion-restricted necrosis had significantly lower ADC values compared with hypercellular tumor.29,30
Glioblastomas are typically associated with liquefactive necro-sis, characterized by its purulent appearance and liquid texture.
This generally results in high diffusion and consequent hyperintensity on ADC images. Coagulative necrosis, however, is grossly firm with microscopic “ghostly” cells, in which only the outline and cyto-plasm remain but all organelles are absent.31
This study explored regions of diffu-sion restriction following bevacizumab therapy in 2 ways: First, we analyzed tis-sue samples from patients at postmor-tem to pathologically confirm tumor cellularity or coagulative necrosis. Next, we assessed a patient population to determine the effect that these le-sions have on OS. We then performed a subanalysis on tumorO6- methylgua-nine-DNA-methyltransferase (MGMT) methylation, a predictor of overall survival.23,32
MATERIALS AND METHODS
Patient Population
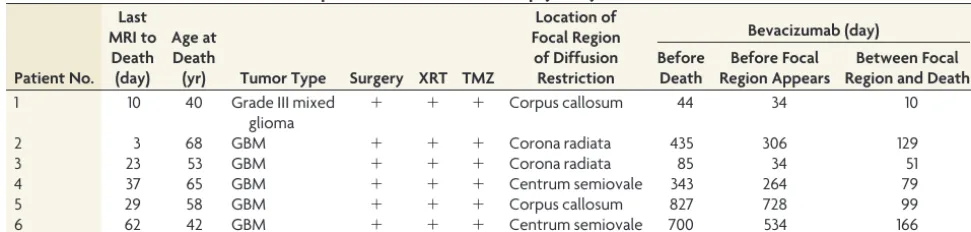
The brains from 6 patients with recur-rent GBM and regions of focal diffusion restriction (while on bevacizumab ther-apy) were assessed at postmortem as part of an internal review board– compliant study (PRO17446).Table 1provides a brief clinical history of each patient. The cohort consisted of 1 woman and 5 men, with a mean age of 54 years (range, 39.9 – 67.8 years). All patients had surgical resection, concurrent radiation, and temozolomide therapy and bevacizumab at tumor recur-rence. The mean period between the initiation of bevacizumab therapy and the appearance of focal regions of diffusion restric-tion was 316.6 days (range, 34 –728 days); the mean period be-tween initiation of bevacizumab therapy and death was 405.6 days (range, 44 – 827 days); and the mean period between the appear-ance of a focal diffusion-restricted region and death was 89 days (range, 10 –166 days).
Imaging
The patients were clinically imaged on either a 1.5T Symphony or Espree (Siemens, Erlangen, Germany) or a 1.5T Optima or 3T Discovery (GE Healthcare, Milwaukee, Wisconsin) scanner by
[image:2.594.51.537.55.171.2]FIG 1. Demonstration of the creation of a patient-specific brain mold for minimizing tissue distortion during fixation. The patient’s MR imaging is used to generate a brain mask, which is then used as a guide for generating the mold in 3D modeling software. Molds are then 3D-printed in plastic. Table 1: Patient clinical summaries for the 6 patients included in the autopsy study
Patient No. Last MRI to
Death (day)
Age at Death
(yr) Tumor Type Surgery XRT TMZ
Location of Focal Region
of Diffusion Restriction
Bevacizumab (day) Before
Death
Before Focal Region Appears
Between Focal Region and Death
1 10 40 Grade III mixed
glioma
⫹ ⫹ ⫹ Corpus callosum 44 34 10
2 3 68 GBM ⫹ ⫹ ⫹ Corona radiata 435 306 129
3 23 53 GBM ⫹ ⫹ ⫹ Corona radiata 85 34 51
4 37 65 GBM ⫹ ⫹ ⫹ Centrum semiovale 343 264 79
5 29 58 GBM ⫹ ⫹ ⫹ Corpus callosum 827 728 99
6 62 42 GBM ⫹ ⫹ ⫹ Centrum semiovale 700 534 166
[image:2.594.56.374.186.489.2]using DWI (b⫽0 and 1000), T1 pre- and postgadolinium, and T2 FLAIR. ADC maps were calculated from DWI by using Analysis of Functional Neuro Images software (AFNI; http://afni.nimh.nih. gov/afni) and the equation ADC⫽(1/1000)⫻ln(B0/B1000). Imaging, including the ADC maps, was coregistered to the T1-weighted image by using the FMRIB Linear Image Registration Tool (FLIRT; http://www.fmrib.ox.ac.uk/).
Histology Processing and ADC Correlation
The tissue was processed as previously published,29with some
modifications. To prevent tissue distortion during brain fixation, for 4 of the 6 postmortem cases, at the time of removal, we placed brains in patient-specific, MR imaging– derived, 3D-printed
molds (Fig 1).33Molds were generated by using open-source
soft-ware, including the FSL Brain Extraction Tool (http://fsl.fmrib. ox.ac.uk/fsl/fslwiki/BET) for generating a brain mask, 3D Slicer (www.slicer.org) for wrapping a surface model around the mask, and Blender (www.blender.org) for creating the final mold de-sign. Each was then printed by using a MakerBot Replicator 3D-printer (fifth-generation) (www.makerbot.com). Postmortem slicing of the brains was done by using a universal slicing jig for 2 patients and a customized 3D-printed slicing jig for 4 patients (Fig 2). Each jig was similarly designed in Blender by using the pa-tient’s imaging as described above and printed by using the same 3D printer. Tissue specimens were taken from regions of diffusion restriction as defined by radiologic criteria. Samples were paraffin-embedded, hematoxylin-eosin–stained, and digitized for inter-pretation and quantification. Each sample was graded to differen-tiate necrotic regions from viable tumor, and ROIs were manually drawn on each sample to differentiate the 2 tissue types. The dig-itized histology was then segmented to highlight individual cells29
and coregistered to the imaging by using custom software and
FIG 2.Demonstration of the use of a custom 3D-printed slicing jig for sectioning the brain in the same axial orientation as the imaging. Shown on thelower rightare examples of gyri and sulci that align well with the imaging (yellow arrows).
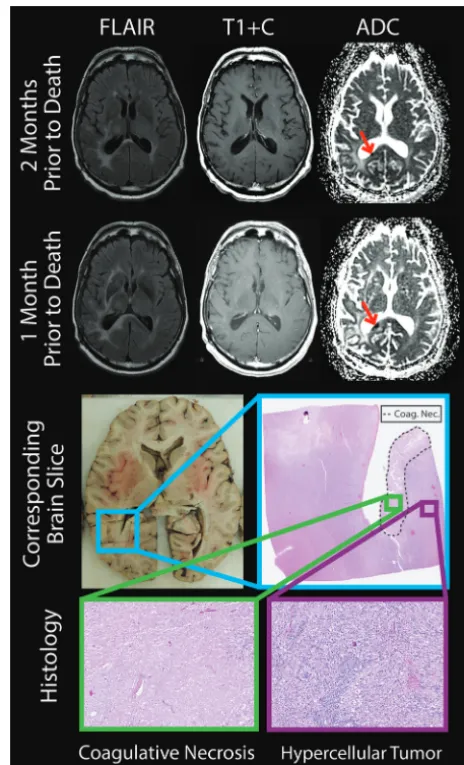
[image:3.594.300.532.46.428.2] [image:3.594.54.287.57.522.2]previously published methods.29Figure 3shows a representative
patient in whom the target region of diffusion restriction as de-fined by imaging is compared with the matching brain section and sample location. The ROIs defining necrotic areas were down-sampled to the MR imaging resolution, and ADC values were then extracted from regions of diffusion-restricted necrosis and areas clas-sified as hypercellular. We performed a receiver operating character-istic analysis, iteratively adjusting ADC cutoff values until a maximal area under the curve was obtained for differentiating diffusion-re-stricted necrosis from hypercellularity for each patient.
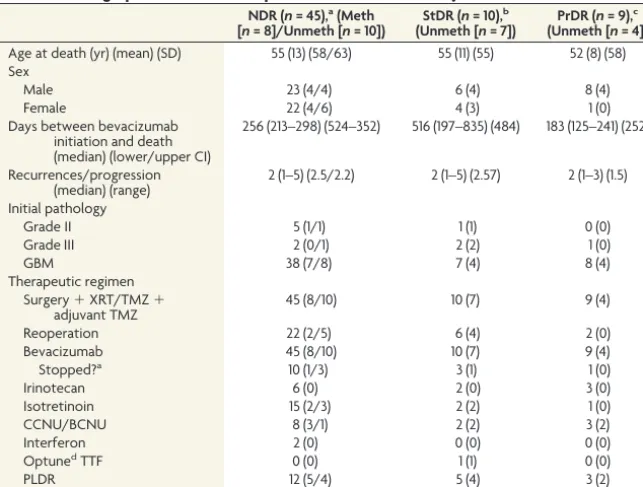
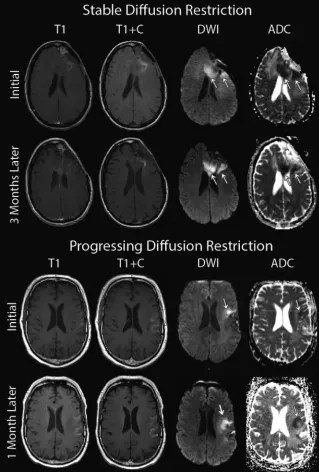
Sixty-four patients who underwent bevacizumab treatment for recurrent GBM were retrospectively assessed by using our clinical PACS system to determine whether diffusion-restricted lesions developed following treatment onset (Table 2). Two re-viewers (H.S.N. and P.S.L.) determined by consensus which pa-tients developed diffusion-restricted lesions, which were then ver-ified by a board-certver-ified neuroradiologist (S.D.R.). It is the standard practice in our neuro-oncology clinic for patients to undergo MR imaging each month following the onset of bevaci-zumab therapy for the first 6 months. Follow-up imaging inter-vals are then extended at the discretion of our neuro-oncologist. Patients were separated into 3 groups: 1) no diffusion restric-tion (n⫽45), 2) new diffusion restriction that appeared and progressively grew within 5 months of bevacizumab initiation (n⫽9), and 3) delayed onset (the lesion appeared⬎5 months after bevacizumab initiation) or new diffusion restriction (⬍3 months postbevacizumab) that remained stable for⬎3 months (onset and progression totaling⬎5 months) (n⫽10). Diffusion-restricted lesion progression or growth was assessed qualitatively
and verified by our neuroradiologist (S.D.R.). Progression was defined by any increase in lesion size beyond the initial lesion appearance (seeFig 4for exam-ples). Conditions of patients with multi-ple lesions were classified as progressive if any lesion was progressing, and condi-tions in patients with lesions decreasing in size were classified as stable. The OS after initiation of bevacizumab therapy within each group was then compared with Kaplan-Meier curves and a log-rank test via SPSS 22 (IBM, Armonk, New York). An additional survival anal-ysis was performed separating patients on the basis ofMGMTmethylation sta-tus of initial tumor samples.
RESULTS
Regions of diffusion-restricted necrosis had significantly lower ADC values than nearby hypercellularity (Table 3). The ADC threshold that best differentiated these tissue types was 0.736 ⫻ 10⫺3mm2/s, corresponding to an aver-age area under the curve of 0.816 (Table 3). The average ADC value within diffu-sion-restricted necrosis was 0.663 ⫻ 10⫺3mm2/s, while the average ADC within regions of hypercellularity was 0.925⫻10⫺3mm2/s. In 5 of the 6 patients, the diffusion-restricted necrosis was progressively growing at the time of the patient’s final scan. For these 6 patients, the necrotic regions were surrounded by viable hypercellular non-enhancing tumor. The patient without progressively growing dif-fusion restriction had recurrent tumor elsewhere, not directly ad-jacent to the diffusion-restricted lesion.
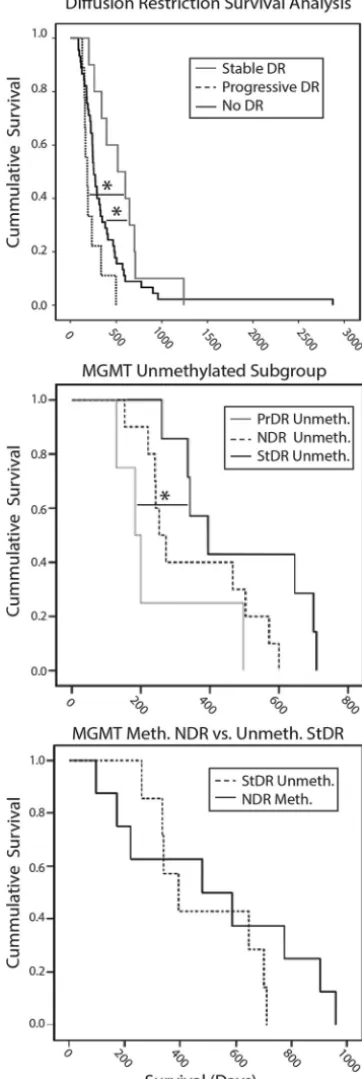
Figure 5shows the survival curves comparing no diffusion restriction, progressive diffusion restriction, and stable diffu-sion restriction, in which patients with stable diffudiffu-sion restric-tion had a significantly greater OS than the group with no diffusion restriction (P⬍.05), while the progressive diffusion restriction group had significantly lower OS than the stable diffusion restriction group (P ⬍.05) (Fig 5, upper section). Although initially stable, at the time of death all diffusion-restricted lesions were progressing in the group with stable diffusion restriction.
[image:4.594.54.376.55.299.2]Of the 64 retrospective patients, 37 were tested forMGMT methylation. Tumor samples from 8 of 18 patients in the no-diffusion-restriction group were found to beMGMTmethylated (40%). None of the patients with methylation developed diffu-sion-restricted lesions. The patients without methylation, when separated by diffusion-restriction status, showed the same sur-vival trend as that in the overall population analysis (Fig 5, mid-dle section). There was no survival difference between patients with unmethylated stable diffusion restriction compared with the patients with methylation and no diffusion restriction (Fig 5, lower section).
Table 2: Demographics for the retrospective bevacizumab study NDR (n= 45),a(Meth
[n= 8]/Unmeth [n= 10])
StDR (n= 10),b
(Unmeth [n= 7])
PrDR (n= 9),c
(Unmeth [n= 4])
Age at death (yr) (mean) (SD) 55 (13) (58/63) 55 (11) (55) 52 (8) (58) Sex
Male 23 (4/4) 6 (4) 8 (4)
Female 22 (4/6) 4 (3) 1 (0)
Days between bevacizumab initiation and death (median) (lower/upper CI)
256 (213–298) (524–352) 516 (197–835) (484) 183 (125–241) (252)
Recurrences/progression (median) (range)
2 (1–5) (2.5/2.2) 2 (1–5) (2.57) 2 (1–3) (1.5)
Initial pathology
Grade II 5 (1/1) 1 (1) 0 (0)
Grade III 2 (0/1) 2 (2) 1 (0)
GBM 38 (7/8) 7 (4) 8 (4)
Therapeutic regimen Surgery⫹XRT/TMZ⫹
adjuvant TMZ
45 (8/10) 10 (7) 9 (4)
Reoperation 22 (2/5) 6 (4) 2 (0)
Bevacizumab 45 (8/10) 10 (7) 9 (4)
Stopped?a 10 (1/3) 3 (1) 1 (0)
Irinotecan 6 (0) 2 (0) 3 (0)
Isotretinoin 15 (2/3) 2 (2) 1 (0)
CCNU/BCNU 8 (3/1) 2 (2) 3 (2)
Interferon 2 (0) 0 (0) 0 (0)
Optuned
TTF 0 (0) 1 (1) 0 (0)
PLDR 12 (5/4) 5 (4) 3 (2)
Note:—PLDR indicates pulsed low-dose rate radiation; NDR, no diffusion restriction; StDR, stable diffusion restriction; PrDR, progressive diffusion restriction; TTF, tumor treating fields; Meth, methylation; Unmeth, no methylation; CCNU/ BCNU, carmustine/lomustine; XRT, radiation therapy; TMZ, temozolomide.
a
Bevacizumab was stopped for further surgery (for resection,n⫽5; for infection,n⫽1; for shunting,n⫽1; for hemorrhage,n⫽1; buttock abscess,n⫽1; and hip fracture,n⫽1).
b
Bevacizumab was stopped for neutropenia/thrombocytopenia (n⫽1), fatigue (n⫽1), and hemorrhage (n⫽1).
cBevacizumab was stopped for further surgery (resection,n⫽1). d
DISCUSSION
This study explored focal regions of diffusion restriction follow-ing bevacizumab treatment. At postmortem, we found that
pro-gressively growing lesions were predom-inantly coagulative necrotic tissue surrounded by viable nonenhancing hy-percellular tumor. Analysis of ADC val-ues showed that a cutoff of 0.736 ⫻ 10⫺3mm2/s best separated diffusion-re-stricted necrosis and viable hypercellu-lar tumor. We also found that patients with stable diffusion-restricted lesions had significantly greater OS, while those with progressing diffusion restriction had shorter OS than those who never de-veloped lesions. We also found that all the patients who developed diffusion-restricted lesions had unmethylated MGMTand that the patients with stable diffusion restriction showed a survival benefit similar to that of those with MGMT methylation with no diffusion restriction.
Several recent studies have explored these diffusion-restricted lesions. Gupta et al24 noted that diffusion restriction
preceded the development of enhancing tumor in a subset of patients with glio-blastoma, independent of bevacizumab therapy; this finding suggested that such restriction represented hypercellular tu-mor. A case report from Gerstner et al25
showed pathologically confirmed, non-enhancing tumor colocalized with diffu-sion restriction. Pope et al34investigated
low ADC values through histogram analysis and agreed with the conclusion that low values indicated areas of hyper-cellularity. Other studies, however, have hypothesized that these regions could not correspond to tumor because not all conditions of patients progressed.35,36
They instead hypothesized that these re-gions would most likely be chronic hyp-oxia and necrosis.36
Population studies examining these lesions have likewise found contradic-tory results. Studies by Mong et al21and
Ba¨hr et al37 found that patients who
demonstrated stable diffusion restric-tion following bevacizumab treatment had increased overall survival, again suggesting that the lesions were not via-ble tumor. The study of Mong et al21
confirmed gelatinous necrosis in 1 tient through biopsy. In addition, 5 pa-tients from the literature with sampled biopsies and 2 brain donations demon-strated necrosis within these focal re-gions.21,26,28,37,38Zhang et al,23however, found that survival was
dependent on the size of the focal lesion.
[image:5.594.56.376.49.522.2]FIG 4. Examples of stable and progressive diffusion-restricted lesions occurring following the onset of bevacizumab treatment.
Table 3: Summary of the ADC values within regions of DRN and hypercellularity
Patient No.
ADC DRN
DRN Nvox
ADC HypCel
HypCel
Nvox Scanner
Field Strength
1 0.578 142 0.694 256 Optimaa 1.5T
2 0.552 122 1.000 143 Symphonyb 1.5T
3 0.622 88 1.076 72 Optimaa 1.5T
4 0.786 237 1.170 950 Discoverya 3T
5 0.699 96 0.775 584 Symphonyb 1.5T
6 0.743 121 0.838 129 Espreeb 1.5T
Average 0.663 134 0.926 356
Note:—DRN indicates diffusion restricted necrosis; Nvox, number of voxels; HypCel, hypercellular.
a
GE Healthcare, Milwaukee, Wisconsin.
[image:5.594.53.376.570.664.2]Our postmortem findings suggest that regions of diffusion re-striction themselves are diffusion-restricted coagulative necrosis. Most important, in 5 of 6 patients, the lesions were progressing at the time of death and were surrounded by viable nonenhancing hypercellular tumor. These tumorous regions are deceptively invisi-ble on contrast-enhanced T1-weighted imaging. This finding may clarify previous reports; if viable tumor was found it would have been reported preferentially to necrosis and given the nature of biopsies, samples could be associated with the incorrect location just adjacent to the actual dark spot.
Diffusion restriction has gained traction as an alternative marker to assess treatment response and tumor progression. Prior glioma studies have found an inverse correlation between ADC and cellularity, tumor grade, and Ki-67 proliferation indices.24,34
Increasing ADC values have been associated with a reduction in cellularity attributed to effective treatment, edema, and/or radia-tion necrosis.15,34Our study finds, however, that coagulative
ne-crosis, which is rare in the brain, is associated with extremely low diffusion values. Two other studies found similar ADC values within diffusion-restricted necrosis of 0.7129 and 0.63 ⫻
10⫺3mm2/s.35One study examined the change in ADC values with
the onset of bevacizumab treatment for predictive power in survival rates.19The authors found that smaller negative changes were more
indicative of OS than larger negative changes. We suggest that this finding is because a small drop in ADC value indicates hypercellular-ity, whereas a large change indicates diffusion-restricted necrosis.
Our results showed that diffusion-restricted lesions could in-dicate either decreased or increased OS, depending on lesion pro-gression. In our population study, we determined that patients with stable diffusion restriction had a significantly greater OS than those with no diffusion restriction, while patients with pro-gressive diffusion restriction had significantly lower OS than those with both stable diffusion restriction and no diffusion re-striction. Patients with stable diffusion restriction may predomi-nantly exhibit necrosis in diffusion-restricted regions, leading to greater OS, while patients with progressive diffusion restriction may exhibit less necrosis surrounded by greater expanding tumor, leading to shortened survival.
Diffusion restriction is typically seen along the ventricles and corpus callosum in qualitative analyses of patients with GBM.21,31
This finding was true in most of our patients, with diffusion re-striction occurring along the lateral ventricles or corpus callosum. Methylation has been shown to be a strong indicator of survival in patients with GBM.39We found that patients with
unmethylated stable diffusion restriction on bevacizumab had similar survival compared with those withMGMTmethylation with no diffusion restriction. Further investigation is needed to understand the inverse correlation between diffusion restriction andMGMTmethylation.
The mechanism behind diffusion-restricted necrosis has been postulated in prior literature. In a case report, Jeyaretna et al38
hypothesized that bevacizumab exacerbated radiation necrosis, which may lead to the development of focal regions of coagulative necrosis. Others hypothesized that such regions result from bev-acizumab-induced chronic hypoxia.26These regions were
detect-able as early as 4 weeks after the initiation of bevacizumab and were maintained for up to 80 weeks.26In addition, they have been
predominantly observed along white matter tracts, particularly the corpus callosum and corona radiata.24Similarly, our cohort of FIG 5. Survival analyses comparing groups.Upper Section, Overall
[image:6.594.79.260.51.591.2]patients also exhibited a wide time range between the initiation of bevacizumab therapy and the appearance of a focal region of diffu-sion restriction. Moreover, all regions, except 1, were within white matter.
There are several sources of potential error in this study. First, our patients were not scanned in the same machine, which could produce differences in our ADC threshold calculation. Although ADC is quantitative, magnet strength and other factors contribute to heterogeneity in ADC values. Coregistration of the histology and imaging is also a source of potential error. We minimized tissue distortion and sectioned the brains according to imaging; however, small errors could have occurred during the slicing. Fur-ther research is necessary to determine the accuracy of our brain-slicing technology. In addition, because the CSF drains following brain removal, this phenomenon causes the ventricles to shrink, with irreversible distortion compared with in vivo imaging.
Future studies should look at using our calculated ADC threshold for mapping necrotic-versus-hypercellular tumor. This would then allow quantitative monitoring of tumor growth on a voxelwise basis. Future studies should also look at including ad-ditional multiparametric MR images that may potentially help differentiate tumor, such as blood-volume maps.
CONCLUSIONS
We pathologically confirmed that progressively expanding diffu-sion restriction in patients undergoing bevacizumab treatment indicates coagulative necrosis surrounded by viable hypercellular tumor. We also determined an optimal ADC cutoff for differen-tiating diffusion-restricted necrosis from hypercellular tumor. In the population analysis, patients with progressively growing re-gions of diffusion restriction have decreased overall survival, sug-gesting that the lesions themselves, when expanding, are necrosis surrounded by viable tumor. Patients with stable lesions, how-ever, showed increased OS over the group with no diffusion re-striction. Further research is necessary to establish the biologic basis for bevacizumab causing these lesions.
ACKNOWLEDGMENTS
We thank the patients and their families who graciously chose to participate in this study.
Disclosures: Jennifer Connelly—UNRELATED:Board Membership: Novocure,* Com-ments: Advisory Board. Christopher Schultz—UNRELATED:Board Membership: Prism Imaging (Scientific Advisory Board, unpaid);Grants/Grants Pending: Elekta AB,*Comments: MR Linac Consortium research support;Travel/Accommodations/ Meeting Expenses Unrelated to Activities Listed: Elekta AB.* Kathleen M. Sch-mainda—RELATED:Grant: National Institutes of Health*;UNRELATED:Grants/ Grants Pending: National Institutes of Health*; Other: Imaging Biometrics,
Comments: ownership interest in a company that develops MRI postprocessing software. *Money paid to the institution.
REFERENCES
1. Stupp R, Mason WP, van den Bent MJ, et al; European Organisation for Research and Treatment of Cancer Brain Tumor and Radiother-apy Groups, National Cancer Institute of Canada Clinical Trials Group.Radiotherapy plus concomitant and adjuvant temozolo-mide for glioblastoma.N Engl J Med2005;352:987–96CrossRef Medline
2. Iwamoto FM, Abrey LE, Beal K, et al.Patterns of relapse and prog-nosis after bevacizumab failure in recurrent glioblastoma. Neurol-ogy2009;73:1200 – 06CrossRef Medline
3. Wong ET, Hess KR, Gleason MJ, et al.Outcomes and prognostic
factors in recurrent glioma patients enrolled onto phase II clinical trials.J Clin Oncol1999;17:2572–78Medline
4. Lamborn KR, Yung WK, Chang SM, et al; North American Brain Tumor Consortium.Progression-free survival: an important end point in evaluating therapy for recurrent high-grade gliomas.
Neuro Oncol2008;10:162–70CrossRef Medline
5. Cohen MH, Shen YL, Keegan P, et al.FDA drug approval summary: bevacizumab (Avastin) as treatment of recurrent glioblastoma multiforme.Oncologist2009;14:1131–38CrossRef Medline
6. Friedman HS, Prados MD, Wen PY, et al.Bevacizumab alone and in combination with irinotecan in recurrent glioblastoma.J Clin On-col2009;27:4733– 40CrossRef Medline
7. Chinot OL, Wick W, Mason W, et al.Bevacizumab plus radiothera-py-temozolomide for newly diagnosed glioblastoma.N Engl J Med
2014;370:709 –22CrossRef Medline
8. Gilbert MR, Dignam JJ, Armstrong TS, et al.A randomized trial of bevacizumab for newly diagnosed glioblastoma.N Engl J Med2014; 370:699 –708CrossRef Medline
9. de Groot JF, Fuller G, Kumar AJ, et al.Tumor invasion after treat-ment of glioblastoma with bevacizumab: radiographic and patho-logic correlation in humans and mice.Neuro Oncol2010;12:233– 42
CrossRef Medline
10. Wen PY, Macdonald DR, Reardon DA, et al.Updated response as-sessment criteria for high-grade gliomas: Response Asas-sessment in Neuro-Oncology Working Group.J Clin Oncol2010;28:1963–72
CrossRef Medline
11. LaViolette PS, Cohen AD, Prah MA, et al.Vascular change measured with independent component analysis of dynamic susceptibility contrast MRI predicts bevacizumab response in high-grade glioma.
Neuro Oncol2013;15:442–50CrossRef Medline
12. Schmainda KM, Prah M, Connelly J, et al.Dynamic-susceptibility contrast agent MRI measures of relative cerebral blood volume pre-dict response to bevacizumab in recurrent high-grade glioma.
Neuro Oncol2014;16:880 – 88CrossRef Medline
13. Sawlani RN, Raizer J, Horowitz SW, et al.Glioblastoma: a method for predicting response to antiangiogenic chemotherapy by using MR perfusion imaging–pilot study. Radiology 2010;255:622–28
CrossRef Medline
14. Sugahara T, Korogi Y, Kochi M, et al. Usefulness of diffusion-weighted MRI with echo-planar technique in the evaluation of cel-lularity in gliomas.J Magn Reson Imaging1999;9:53– 60Medline
15. Ellingson BM, Malkin MG, Rand SD, et al.Validation of functional diffusion maps (fDMs) as a biomarker for human glioma cellular-ity.J Magn Reson Imaging2010;31:538 – 48CrossRef Medline
16. Moffat BA, Chenevert TL, Lawrence TS, et al.Functional diffusion map: a noninvasive MRI biomarker for early stratification of clini-cal brain tumor response.Proc Natl Acad Sci U S A2005;102:5524 –29
CrossRef Medline
17. Hamstra DA, Galba´n CJ, Meyer CR, et al.Functional diffusion map as an early imaging biomarker for high-grade glioma: correlation with conventional radiologic response and overall survival.J Clin Oncol2008;26:3387–94CrossRef Medline
18. Ellingson BM, Cloughesy TF, Zaw T, et al.Functional diffusion maps (fDMs) evaluated before and after radiochemotherapy predict pro-gression-free and overall survival in newly diagnosed glioblastoma.
Neuro Oncol2012;14:333– 43CrossRef Medline
19. Ellingson BM, Cloughesy TF, Lai A, et al.Graded functional diffu-sion map-defined characteristics of apparent diffudiffu-sion coefficients predict overall survival in recurrent glioblastoma treated with bev-acizumab.Neuro Oncol2011;13:1151– 61CrossRef Medline
20. Ellingson BM, Kim E, Woodworth DC, et al.Diffusion MRI quality control and functional diffusion map results in ACRIN 6677/RTOG 0625: a multicenter, randomized, phase II trial of bevacizumab and chemotherapy in recurrent glioblastoma. Int J Oncol 2015;46: 1883–92CrossRef Medline
associated with improved survival compared with matched con-trols.AJNR Am J Neuroradiol2012;33:1763–70CrossRef Medline
22. Hwang EJ, Cha Y, Lee AL, et al.Early response evaluation for recur-rent high grade gliomas treated with bevacizumab: a volumetric analysis using diffusion-weighted imaging.J Neurooncol2013;112: 427–35CrossRef Medline
23. Zhang M, Gulotta B, Thomas A, et al.Large-volume low apparent diffusion coefficient lesions predict poor survival in bevacizumab-treated glioblastoma patients. Neuro Oncol 2016;18:735– 43
CrossRef Medline
24. Gupta A, Young RJ, Karimi S, et al.Isolated diffusion restriction precedes the development of enhancing tumor in a subset of pa-tients with glioblastoma.AJNR Am J Neuroradiol2011;32:1301– 06
CrossRef Medline
25. Gerstner ER, Frosch MP, Batchelor TT.Diffusion magnetic reso-nance imaging detects pathologically confirmed, nonenhancing tu-mor progression in a patient with recurrent glioblastoma receiving bevacizumab.J Clin Oncol2010;28:e91–93CrossRef Medline
26. Rieger J, Ba¨hr O, Mu¨ller K, et al.Bevacizumab-induced diffusion-restricted lesions in malignant glioma patients.J Neurooncol2010; 99:49 –56CrossRef Medline
27. Rieger J, Ba¨hr O, Ronellenfitsch MW, et al.Bevacizumab-induced diffusion restriction in patients with glioma: tumor progression or surrogate marker of hypoxia?J Clin Oncol2010;28:e477; author re-ply e478CrossRef Medline
28. Farid N, Almeida-Freitas DB, White NS, et al.Restriction-spectrum imaging of bevacizumab-related necrosis in a patient with GBM.
Front Oncol2013;3:258CrossRef Medline
29. LaViolette PS, Mickevicius NJ, Cochran EJ, et al.Precise ex vivo his-tological validation of heightened cellularity and diffusion-re-stricted necrosis in regions of dark apparent diffusion coefficient in 7 cases of high-grade glioma. Neuro Oncol 2014;16:1599 – 606
CrossRef Medline
30. Farid N, Almeida-Freitas DB, White NS, et al.Combining diffusion and perfusion differentiates tumor from bevacizumab-related im-aging abnormality (bria).J Neurooncol2014;120:539 – 46CrossRef Medline
31. Robbins SL, Cotran RS, Kumar V.Robbins and Cotran Pathologic Basis of Disease.Philadelphia: Saunders/Elsevier; 2010
32. Hegi ME, Diserens AC, Gorlia T, et al.MGMT gene silencing and benefit from temozolomide in glioblastoma.N Engl J Med2005;352: 997–1003CrossRef Medline
33. Pellatt B, Mickevicius NJ, Cochran EJ, et al.3D-printed MRI-based custom brain molds for minimizing tissue distortion and precisely slicing tissue for co-registration with clinically acquired MRI in gli-oma patients.Neuro-Oncology2014;16(suppl 5):v152CrossRef
34. Pope WB, Kim HJ, Huo J, et al.Recurrent glioblastoma multiforme: ADC histogram analysis predicts response to bevacizumab treat-ment.Radiology2009;252:182– 89CrossRef Medline
35. Reiger J, Ba¨hr O, Mu¨ller K, et al.Bevacizumab-induced diffusion-restricted lesions in malignant glioma patients.J Neurooncol2010; 99:49 –56CrossRef Medline
36. Rahman R, Hamdan A, Zweifler R, et al.Histogram analysis of ap-parent diffusion coefficient within enhancing and nonenhancing tumor volumes in recurrent glioblastoma patients treated with be-vacizumab.J Neurooncol2014;119:149 –58CrossRef Medline
37. Ba¨hr O, Harter P, Weise L, et al.Sustained focal antitumor activity of bevacizumab in recurrent glioblastoma.Neurology2014;83:227–34
CrossRef Medline
38. Jeyaretna DS, Curry WT Jr, Batchelor TT, et al.Exacerbation of ce-rebral radiation necrosis by bevacizumab.J Clin Oncol2011;29: e159 – 62CrossRef Medline
39. Rivera AL, Pelloski CE, Gilbert MR, et al.MGMT promoter methyl-ation is predictive of response to radiotherapy and prognostic in the absence of adjuvant alkylating chemotherapy for glioblastoma.