David Norman 1 Catherine M. Mills Michael Brant-Zawadzki Andrew Yeates Lawrence E. Crooks Leon Kaufman
This article appears in the December 1983 issue of AJR and the January/February 1984 issue of AJNR.
Received July 19, 1983; accepted after revision August 25, 1983.
Presented in part at the annual meeting of the American Roentgen Ray Society, Atlanta, April 1983.
, All authors: Department of Radiology, Univer-Sity of California School of Medicine, San Francisco, CA 94143. Address reprint requests to D. Norman.
AJNR 5:9-14, January/February 1984 0195-6108/84/0501-0009 $00.00 © American Roentgen Ray Society
Magnetic Resonance
Imaging of the Spinal Cord
and Canal:
Potentials and
Limitations
9
Preliminary experience with magnetic resonance imaging (MRI) of the spinal cord and canal in 17 patients indicates considerable promise in ~he diagnosis of neoplastic, degenerative, and congenital lesions. The ability to image the cord directly rather than indirectly as in myelography, the absence of bone artifact as in computed tomography, and the multi planar capabilities indicate that MRI will be the procedure of choice in the examination of the spinal cord. Current limitations include partial-volume effects due to slice thickness and the inability to perform contiguous sections when using multiplanar techniques. The relative increase in signal from cerebrospinal fluid with long TR and TE sequences in spin-echo imaging may result in less sensitivity than in the brain for detection of cord edema and/or infarction.
The ability of magnetic resonance imaging (MRI) to image the brain with greater sensitivity and possibly greater specificity than computed tomography (CT) [1-3] can be applied to imaging of the spinal cord and canal as well. Studies of the cord with conventional clinical techniques have achieved only limited success. The dense bony envelope limits the capabilities of x-ray CT. The cord's comparatively small size and less accessible, more variable vascular supply have limited the capabilities of angiography. Myelography has been the most successful means of imaging the cord, but provides only an indirect assessment based on visualization of the negative shadow of margins of the cord rather than the cord itself.
Our early experience with MRI in imaging the cord and its environment has been encouraging in that MRI can directly display both the normal and pathologic cord. There are, however, inherent limitations in MRI and the current equipment for this application. We discuss the possibility for resolution of these limitations in expand-ing applications of MRI to cord imagexpand-ing.
Subjects and Methods
During the past 12 months, we have examined 17 patients with disease involving the spinal cord or spine. Four patients had pathologically confirmed neoplasms: recurrent ependymoma, teratoma, astrocytoma, and locally invasive histiocytoma, and one had renal cell carcinoma metastatic to T1 0 with compression of the adjacent cord. Six patients had syringomyelia (five reported previously) [4]. Two patients had tethered cords, both with associated lipome nin-gocele. Four patients were evaluated for disk disease, three lumbar and one cervical. All patients examined for tumor, syrinx, or cervical disk had both myelography and high-resolution
computed tomography (GE CT
fT
8800). Patients studied for lumbar disk disease had onlyCT. All lesions were confirmed surgically. Additional experience with the appearance of the normal cord was extracted from over 70 thoracoabdominal examinations performed for a variety of other disease processes.
MRI examinations were performed on a 0.35 T imager developed at the UCSF Radiologic Imaging Laboratory and undergoing constant modification during the 12-month period. The unit is capable of performing inversion-recovery and spin-echo imaging sequences, with a
10 NORMAN ET AL. AJNR:5, Jan/Feb 1984
A
B
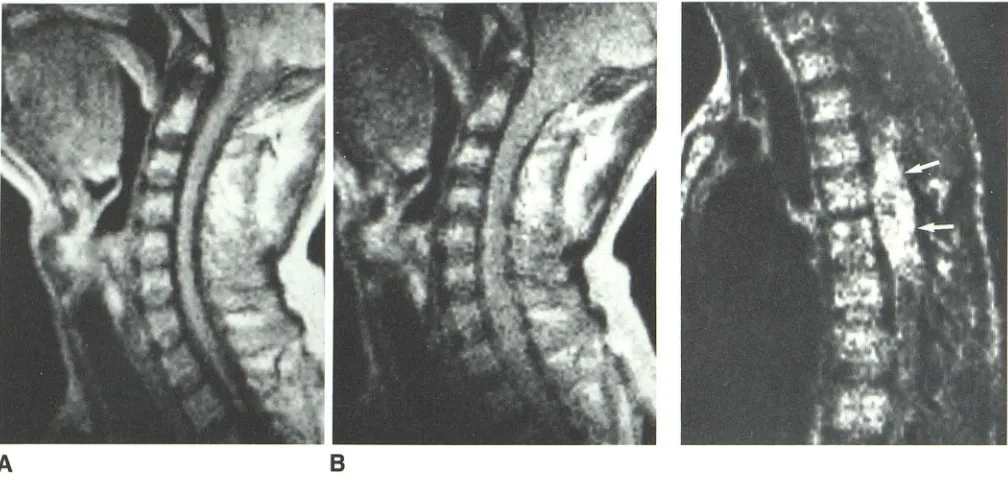
Fig. 1.-Normal cervical spine, sagittal spin-echo scans. A, 28 msec TE, 1.5 sec TR. e, 56 msec TE,
1.5 sec TR. Loss of discrimination between cord and adjacent CSF space due to increased signal from
CSF.
Fig. 2.- Teratoma of thoracic cord. Sagittal spin-echo scan. Lesion (arrows) is heterogeneous in
inten-sity.
included a repetition time (TR) of 0.5-2 sec and an echo time (TE) of
28 and 56 msec. Initial experience suggests that the spin-echo
technique is a more efficient approach to imaging and perhaps is more sensitive to the presence of pathology [5J.
Imaging times were influenced to a substantial degree by the
signal-to-noise (SjN) ratio desired and by the amount of quantitative data desired from the image. Anatomic images of good quality could be collected with five consecutive sections obtained in a single plane in 4.3 min. A more complete "fast scan" uses 1.5 sec TR and 28 and
56 msec TE. Fifteen sections are obtained in 6.5-13 min depending
on whether two or four averages are used, the latter yielding an
improved SjN ratio [6]. Since two different echoes are recorded in
one sequence, a total of 30 images, two for each section, are
displayed. Slice thickness is 7 mm with a 4 mm skipped area between
the adjacent edges due to current electronics design. Imaging a second or third plane required an additional 6.5-17 min for each
plane desired. Images are displayed with automatic scaling in which the most intense and least intense signals are used to define the upper and lower ends of the gray scale. Absolute intensity of the
signal can be obtained by placing a cursor over an area of interest. No neck radiofrequency (RF) coil was available during the study, so the quality of the neck images was somewhat limited by the geometry of the body RF coil.
Although T1 and T2 data can be generated, they were not used in this study, as the absolute value is inaccurate and the relative value(s)
can be determined by visual inspection of the multiple echo images
[7].
Observations
MRI images with short TR and TE provided good to excel-lent anatomic delineation of cord morphology (fig. 1). Axial
sections provided good cross-sectional representation of cord
diameter; however, gray and white matter were not reliably distinguished. Sagittal imaging was performed in most pa-tients as well. Partial-volume artifact, however, impaired the quality of the data on the longitudinal views, since averaging with adjacent cerebrospinal fluid (CSF) and/or bone provided false intensity values. Slice thickness of 7 mm and the skipped areas between slices account for the problem in the sagittal and coronal planes. Image quality and detail were related to a significant degree to imaging time, the signal improving with longer TR.
The two primary neoplasms appeared as areas of high signal intensity in comparison to the surrounding CSF, bone, and adjacent cord on the short-TR images. The recurrent ependymoma had a prolonged T2 as evidenced by increased signal on the second echo with longer TR [7]. It was imaged along its entire longitudinal axis in the sagittal plane and provided the radiotherapist with excellent anatomic land-marks. A thoracic teratoma had mixed high- and low-intensity signals indicating heterogeneous lesion, the high intensity on the short-TR, first-echo images reflecting a short T1 compat-ible with fat (fig. 2). At surgery, an extradural lipoma as well as the intramedullary teratoma were identified. Lipomeningo-celes also had areas of high signal intensity due to the short T1 of the fatty tissue. Infiltration of a lumbar vertebra by a fibrous histiocytoma (fig. 3) appeared as an area of intensity
similar to marrow on the first echo (28 msec TE, 1.5 sec TR) and increased intensity on the second echo (56 msec TE). It was also identified on CT. Infiltration of the T10 vertebral body by metastatic renal cell carcinoma with secondary canal compromise was easily seen. In this case, the high intensity
[image:2.612.56.560.88.327.2]AJNR:5, Jan/Feb 1984 MAGNETIC RESONANCE OF SPINAL CORD & CANAL 11
Fig. 3.-Fibrous histiocytoma infiltrating L2 verte -bral body. A, 28 msec TE. 6, 56 msec TE. In this sequence with relatively long TR (1.5 sec), lesion is
nearly isointense with marrow on first echo (A) and of increased intensity on second echo (6) (arrows).
Fig. 4.-Syringomyelia. Axial images of same level at 28 msec TE and 0.5 (A), 1.0 (6), 1.5 (C), and 2.0
(0) sec TR. Longer TR results in augmentation of
signal from CSF, resulting in decreased discrimination between cord and syrinx. If fluid in syrinx or s ubar-achnoid space had elevated protein, intensity would
be higher even with short TR.
A
A
c
signal intensity. The scan was obtained with a shorter TR (0.5
sec), which emphasized the influence of T1 on the resultant image.
The syrinxes were identified as cavities of low signal inten-sity in all six patients on the first echo (28 msec TE) with 0.
5-2.0 sec TR. The second echo (56 msec TE) and longer TR
B
B
o
parameter resulted in a relatively higher signal intensity from
CSF compared with the cord, resulting in less contrast dis-crimination between the cord and the cavity as well as the
surrounding CSF space (fig. 4).
In the three patients with herniated lumbar disk, the protr
12 NORMAN ET AL. AJNR:5, Jan/Feb 1984
A
B
greater than that available with high-resolution CT. By com-parison, the protruding cervical disk was well seen, best
identified in the sagittal plane (fig. 4). It was detected more
easily than on CT and/or myelography, despite the relatively
low SIN ratio.
Discussion
Although modest in number, these initial experiences with
MRI of the normal and pathologic cord illustrate the present
advantages of the technique as well as some problems in
methodology, information display, and accuracy.
MRI permits direct visualization of the cord and its size and
shape. There is no limitation of spatial and contrast detail
from signal scatter associated with adjacent bone, as
en-countered with x-ray CT. Thick sections and skipped areas
between adjacent bone inherent in the multisection technique,
however, cause partial-volume artifact, which can limit the
quality and accuracy of the information.
The appearance of both the normal and pathologic cord
varies with both the imaging sequence and the method of
image display. Images with short TR and TE provided
excel-lent representation of cystic cavities and of normal cord and
widening due to tumor and cystic cavities; however, because
there is no signal from cortical bone, the size of the CSF
space may be overestimated due to lack of signal from both
CSF and bone [5]. In addition, techniques using a long TR
and TE result in increased signal from CSF due to T2 effect,
which diminishes the ability to identify the true anatomic limits
of the cord (fig. 5).
Thus far in imaging the cord, reliable gray/white
differentia-tion has not been possible using any imaging sequence.
Because of this, MRI may prove to be less sensitive in the
spinal cord than in the brain in the detection of ischemic,
Fig. 5.-C5-C6 herniated disk. sagittal spin-echo scans at 1.5 sec TR. A, 28 msec TE, first echo. Disk compromises subarachnoid space and abuts cord. S, 56 msec TE, second echo. Loss of discrimination between CSF and adjacent cord due to increased signal from CSF because of its long T2.
demyelinating, or edematous lesions. Imaging sequences that
are primarily T1-weighted and have high SIN ratio, such as
partial saturation, may prove to be a very desirable sequence
for imaging the cord (fig. 6).
Our experience with intrinsic cord tumors is too limited to make any statements concerning histologic specificity. The technique does seem to be sensitive. It is certainly superior
to CT in identifying abnormal tissues or cavities; it can identify
fat as readily as CT, and because of the multiplanar
capabili-ties, it can provide superior anatomic delineation. The ability
to visualize the cord directly rather than in silhouette, as in
myelography, suggests that MRI may displace myelography for the diagnosis of cord neoplasms. Optimization of cord MRI will require attention to the fact that a very small part of
the volume being imaged is, in fact, the area of interest. Thus
target imaging techniques in which the imager is focused by
means of gradient and RF coil manipulation and design should
improve both the quality and content of information.
In syringomyelia, the fragile relation between a particular
imaging sequence and pathology is exemplified in the situation where an increase in CSF protein causes an increase in signal
and resulting decreased contrast between CSF and the
ad-jacent cord. In a cystic cavity filled with protein, the abnor-mality may alter the image such that contrast is greatly
reduced. This problem is not insurmountable. It may require
that MRI units be designed to perform multiple imaging se-quences and/or echoes at a single area of interest as well as
multiple sections. Once the "most sensitive" technique is
identified, it may then be used to obtain multiple slices and/
or multiple planes.
Partial-volume effects, especially in the coronal and sagittal
planes, also can alter the appearance of the image. Direct
imaging of these planes will require thinner sections that are
noncontig-AJNR:5, Jan/Feb 1984 MAGNETIC RESONANCE OF SPINAL CORD & CANAL 13
Fig. 6.-Normal cord at foramen magnum level. Spin-echo scans. A, 28 msec TE, 0.5 sec TR. B, 56 msec TE, 0.5 sec TR. C, 28 msec TE, 1.0 sec TR. D, 56 msec TE, 1.0 sec TR. Images with short TR and TE clearly demonstrate sharp distinction between cord and CSF space and suggest contrast between cord and gray/white matter. On second echo with 0.5 sec TR (B), gray/white matter discrimination is lost, and apparent cord diameter increases due to increase in signal from adjacent CSF. Latter phenomenon is more pronounced on C and D (longer TR). P artial-volume effects from inferior aspect of cerebellar ton -sils are more pronounced with longer TR and TE.
A
c
UoUS sections are also limiting factors in imaging the disk space.
The low signal obtained from cortical bone, due to its relatively low mobile hydrogen content, suggests the possi-bility that bony lesions may be missed (e.g., a bone fragment within the canal, a sclerotic metastasis, or spinal stenosis);
however, the low signal from bone is a component of the contrast and therefore is useful. A bone fragment in the canal will be seen as an area of very low signal silhouetted by the higher signal of CSF in images with a long TR and TE. Tumor invasion of bone will appear as displacement of the high signal
from marrow in the cancellous bone by a signal of altered,
usually diminished intensity, especially in short-TR imaging sequences. The intense signal from marrow serves to distin-guish medullary from cortical bone [9]. It presumably reflects both blood and fat within the marrow.
MRI offers a unique opportunity to view anatomic, patho
-logic, and physiologic changes in the cord. Disease processes identified only indirectly by myelography or not appreciated at all can now be imaged in vivo. It should be possible to distinguish between intra- and extramedullary lesions, de
-pending on the technique used. Localization of radiation treat-ment ports will be far more accurate than in the past.
B
o
Future applications intrinsic to MRI include taking advan-tage of its sensitivity to blood flow [10-13], which should permit identification of vascular malformations. It may identify
the degree of ischemic compromise from these malformations
and assess the result of interventional occlusive procedures.
An additional area of potential application is in imaging and
quantifying CSF dynamics, a subject of intense investigation
for which we have relatively limited tools. Although not as yet
demonstrated, the possibility of a paramagnetic agent
se-creted by the choroid plexus may permit both quantitative
and qualitative noninvasive imaging of CSF dynamics without
ionizing radiation.
REFERENCES
1. Brant-Zawadzki M, Davis PL, Crooks LE, et al. NMR
demonstra-tion of cerebral abnormalities: comparison with CT. AJNR
_1983;4: 117-124, AJR 1983;140:847-854
2. Lukes SA, Crooks LE, Aminoff MJ, et al. Nuclear magnetic
imaging in multiple sclerosis. Ann Neural 1983;13:592-601
3. Bydder GM, Steiner RE, Young IR, et al. Clinical NMR imaging
of the brain: 140 cases. AJR 1982;139:215-236, AJNR
1982;3:459-480
14 NORMAN ET AL. AJNR:5, Jan/Feb 1984
LE, Newton TH. Nuclear magnetic resonance imaging of syrin-gomyelia. AJNR 1983;4:234-237
5. Crooks LE, Mills CM, Davis PL, et al. Visualization of cerebral and vascular abnormalities by NMR imaging: the effects of
imaging parameters on contrast. Radiology 1982; 144: 843-852
6. Crooks LE, Ortendahl DA, Kaufman L, et al. Clinical efficiency of nuclear magnetic resonance imaging. Radiology 1983;146: 123-128
7. Mills CM, Crooks LE, Kaufman L, Brant-Zawadzki M. Calculated
T, and T2 images: utility in cerebral abnormalities. Radiology (in press)
8. Young IR, Bailes DR, Burl M, et al. Initial clinical evaluation of a whole body nuclear magnetic resonance (NMR) tomograph. J Cornput Assist Tornogr 1982;6:1-18
9. Moon KL Jr, Genant HK, Helms CA, Chafetz NI, Crooks LE,
Kaufman L. Musculoskeletal applications of nuclear magnetic
resonance. Radiology 1983;147:161-171
10. Mills CM, Brant-Zawadzki M, Crooks LE, et al. Nuclear magnetic resonance: principles of blood flow imaging. AJNR 1983;4:
1161-1166, AJR 1984;142 (in press)
11. Kaufman L, Crooks LE, Sheldon P, et al. The potential impact of
nuclear magnetic resonance imaging on cardiovascular
diagno-sis. Circulation 1983;67:251-257
12. Crooks LE, Sheldon P, Kaufman L, Rowan W. Quantification of obstructions in vessels by nuclear magnetic resonance (NMR).
IEEE Trans Nucl Sci 1982;NS-29: 1181-1185
13. Alfidi RJ, Haaga JR, EI Yousef SJ, et al. Preliminary experimental