Evidence of Maturational Changes during Adolescence
R. Grant Steen, Robert J. Ogg, Wilburn E. Reddick, and Peter B. Kingsley
PURPOSE: To determine whether a quantitative MR imaging method to map spin-lattice relaxation time (T1) can be used to characterize maturational changes in the normal human brain. METH-ODS: An inversion-recovery technique was used to map T1 transversely at the level of the basal ganglia in a study population of 19 healthy children (4 to 10 years old) and 31 healthy adolescents (10 to 20 years old), and in a normative population of 20 healthy adults (20 to 30 years old). RESULTS: Nonparametric analysis of variance showed that T1 decreases with age in the genu, frontal white matter, caudate, putamen, anterior thalamus, pulvinar nucleus, optic radiation, cortical gray matter (allP,.0001), and occipital white matter. There was a significant reduction in T1 between childhood (mean age, 7.161.4) and adolescence (mean age, 13.562.6) in all brain structures, but there was also a significant reduction in T1 between adolescence (mean age, 13.562.6) and adulthood (mean age, 26.563.4) in all brain structures except occipital white matter. Regression shows that T1 declines to within the range (mean62 SD) of young adult T1 values by about 2 years in the occipital white matter, by about 4 years in the genu, by 11 years in the cortical gray matter, by 11 years in the frontal white matter, and by 13 years in the thalamus. CONCLUSION: Brain structures mature at strikingly different rates, yet the ratio of gray matter T1 to white matter T1 does not change significantly with age. Thus, conventional MR imaging methods based on inherent contrast are insensitive to these changes. Age-related changes tend to reach completion sooner in white matter than in gray matter tracts. Such normative data are essential for studies of specific pediatric disorders and may be useful for assessing brain maturation in cases of developmental delay.
Index terms: Brain, growth and development; Brain, magnetic resonance
AJNR Am J Neuroradiol18:819 –828, May 1997
Maturation of the human central nervous sys-tem begins in utero and continues through ad-olescence, with dramatic changes apparent in the first few years of life (1–5). Markers of mat-uration are available in the physical examina-tion of the child, including head diameter, head
circumference, general alertness, motor re-flexes, muscle strength and tone, motor mile-stones, and structure and function of the sen-sory apparatus (3). However, it has been difficult to characterize maturational changes in the normal human brain or to assess objectively the degree of maturation in an individual child. Magnetic resonance (MR) imaging has pro-vided a window into the intact brain for more than a decade. There has been great interest in characterizing patterns of change seen in pedi-atric patients by means of various T1- and T2-weighted imaging sequences, which form the repertoire of conventional MR imaging (6 –12). Yet the complex changes in the pediatric brain have not been fully characterized because of the relative subjectivity of evaluation possible with conventional MR imaging. MR spectroscopy has also been used to characterize age-related changes in the pediatric brain (13, 14), but this Received July 18, 1996; accepted after revision December 4.
Supported by grant P30-CA21765 from the National Cancer Institute, by the David A. Karnofsky Memorial Fellowship (to Dr Steen), and by the American Lebanese Syrian Associated Charities.
From the Department of Diagnostic Imaging, St Jude Children’s Re-search Hospital (all authors), the Departments of Radiology (R.G.S.) and Biomedical Engineering (R.G.S., R.J.O.), University of Tennessee School of Medicine, and the Department of Electrical Engineering, University of Memphis (W.E.R.), Memphis, Tenn.
Address reprint requests to R. Grant Steen, PhD, Department of Diag-nostic Imaging, St Jude Children’s Research Hospital, 332 N Lauderdale, Memphis, TN 38105-2794.
AJNR 18:819–828, May 1997 0195-6108/97/1805–0819 ©American Society of Neuroradiology
technique has less spatial resolution than con-ventional MR imaging, is more difficult to imple-ment, and is available at fewer medical centers. Newer techniques of quantitative MR imaging are more objective and potentially more sensi-tive to subtle brain changes than are conven-tional MR imaging techniques (15). Recently, quantitative MR imaging techniques have led to striking success in identifying brain abnormali-ties associated with fragile-X syndrome (16), schizophrenia (17), multiple sclerosis (18), phenylketonuria (19), epilepsy (20), and hu-man immunodeficiency virus (HIV)-associated dementia (21, 22). These findings suggest that quantitative MR imaging may offer the clinician sufficient sensitivity and accuracy to character-ize the schedule of brain maturation in healthy children more objectively, or perhaps to identify with greater surety those children who are de-velopmentally delayed.
Subjects and Methods
We used T1 mapping to assess the changes occurring in a healthy population of children and adolescents, and we compared our findings with a normative population of healthy young adults 20 to 30 years old.
Subjects were either hospital personnel or the children of hospital personnel, all of whom reported good health. The protocol to image subjects was reviewed and ap-proved by our Institutional Review Board. Subjects in-cluded 19 children 4 to 10 years old (mean, 7.1 years6 1.4), 31 adolescents 10 to 20 years old (mean, 13.5 years62.6), and 20 adults 20 to 30 years old (mean, 26.5 years6 3.4). Parents or guardians of subjects signed an informed consent form after a brief description of the MR protocol or, in the case of volunteers older than 18, the informed consent was signed by the subject. None of the volunteers was sedated. Of the 50 subjects less than age 20, about 54% were female, 46% male, and 56% were white, 44% black; the distribution of adult subjects was roughly comparable.
Quantitative MR Imaging
All MR imaging was performed on a 1.5-T Magnetom SP63 (Siemens Medical Systems, Iselin, NJ) using a stan-dard Siemens head coil. A conventional T1- or T2-weighted image set of the brain was acquired in the trans-verse plane to enable selection of a section through the brain most comparable to the section level selected in the other volunteers. Conventional T1-weighted images were acquired with parameters as follows: 266/6/1 (repetition time/echo time/excitations), 23-cm field of view, 90° flip angle, 1923256 matrix, 19 sections with a thickness of 5 mm, and a total imaging time of 54 seconds. In some cases, conventional T2-weighted images were acquired
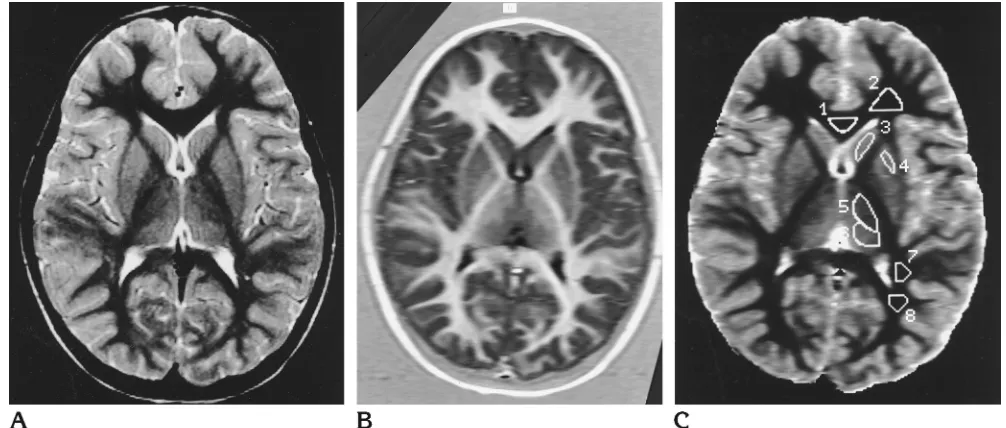
with parameters as follows: 3500/19,93/1 (three echoes per repetition time for each effective echo time), 23-cm field of view, 1923256 matrix, 19 sections with a thick-ness of 5 mm, and a total imaging time of 3 minutes 57 seconds. A representative T2-weighted image is shown (Fig 1A) at the section level selected for the parametric T1-weighted image.
Quantitative imaging of T1 was done with a precise and accurate inversion-recovery (PAIR) sequence optimized and validated previously (15, 23–25). A 5-mm tissue sec-tion was selected and imaged with a phase-sensitive in-version recovery sequence of 2500/20 with four different inversion times: 100, 500, 900, and 2460. To minimize imaging time, a 20-cm field of view was used, with a 723 256 matrix, for an effective in-plane resolution of 2.130.8 mm; total imaging time was 13 minutes 40 seconds. An inversion recovery image is shown (Fig 1B) to indicate the quality of the raw data used to calculate the parametric image.
Measurement of T1
After acquisition, PAIR images were transferred to an off-line Silicon Graphics workstation for calculation of a T1 map. An empirically determined signal intensity (SI) dif-ference threshold of 100 was applied to the difdif-ference between the 100 and 2460 T1 images in order to identify pixels within the phase-encoded region that were either noise or tissue with signal indistinguishable from noise (25). Each pixel identified as noise was excluded and the remaining pixels were submitted to a curve-fitting proce-dure as an array containing SI values derived from each of the four inversion recovery images. Calculations were per-formed using a Levenberg-Marquardt algorithm to fit SI values to the following equation, modified from the original (26) to include a parameter for effective flip angle of the inversion pulse:
SI5 a@122ke2(TR2TE/2)/T1
1) 1ke2TR/T12~12k!e2TI/T1]
whereais the spin-density factor corrected for T2 losses, k is the cosine of the effective flip angle of the inversion pulse, TR is the repetition time between successive exci-tations, TE is the echo time, TI is the inversion time, and T1 is the spin-lattice relaxation time. The fitting procedure returned values fora, k, and T1 in each pixel, and the T1 value was used to produce a parametric T1 map in which each pixel gray-scale value was equivalent to the T1 re-laxation time in milliseconds. A parametric T1 map is shown (Fig 1C), with several regions of interest (ROIs) indicated on the image. The T1 of various structures was measured by identifying ROIs on the 500-TI image, using criteria described in detail previously (15), then applying those ROIs to the parametric T1 map. Error of the T1 fit was determined on a pixel-by-pixel basis (25), and further analysis excluded pixels identified as having an error above a statistical threshold. Output from the computer
included the number of pixels counted within each ROI, mean T1, and the standard deviation (SD) of T1.
Regression of T1 Against Age
Mean T1 was measured in each of nine brain regions in all subjects (Table 1). Mean T1 was regressed against the subject’s age for each brain region separately, using a standard least-squares algorithm in a statistical software package (SPSS 6.1, SPSS Inc, Chicago, Ill) running on a Macintosh Quadra 650. Young adult subjects were also analyzed separately to determine the range of T1 values expected in fully mature subjects (23). The mean T1 (62 SD) of the 20 young adults was accepted as the normal range of adult T1 for each brain structure.
Proportion of Pixels with T1 Values Characteristic of Gray and White Matter
Parametric T1 maps were imported to a Macintosh IIvx with a Raster Ops display, and images were analyzed using Adobe Photoshop 2.5 (Adobe Systems Inc, Mountain View, Calif). Pixels from bone and tissue external to the brain were erased using standard Photoshop tools, and a histogram analysis was performed on the remaining pix-els. Pixels were classified as pure white matter, pure gray matter, or neither, according to criteria established previ-ously, which were derived from T1 data averaged from a group of 24 healthy children (24). The range of pixel
values defined as pure white matter was 568 milliseconds (mean genu, T12 2 SD) to 712 milliseconds (mean oc-cipital white matter, T112 SD). The range of pixel values accepted as pure gray matter was 1160 milliseconds (mean cortical gray matter, T121 SD) to 1440 millisec-onds (mean cortical gray matter, T11about 5 SD). Pixels falling outside these ranges of T1 were assumed to repre-sent volumes containing both white and gray matter, or gray matter contaminated with cerebrospinal fluid partial volume, and were not counted.
Statistical Tests
Nonparametric tests were used exclusively for data analysis because of potential abnormal distribution of age-related T1 values. The Kruskal-Wallis analysis of variance (ANOVA) tested for trends across all subject groups (group 1, healthy children 4 to 10 years old; group 2, healthy adolescents 10 to 20 years old; group 3, healthy adults 20 to 30 years old). The Mann-Whitney U test was used for pairwise comparisons between these groups.
Results
Quantitative MR Imaging
[image:3.587.45.548.84.298.2]A parametric T1 map is shown (Fig 1C) for the youngest volunteer, with ROIs indicated. Measurements of T1 made in nine regions of the brain are summarized for all subjects by age Fig 1. Image set from the youngest volunteer analyzed, a 4-year-old unsedated girl.
A, T2-weighted image acquired to facilitate section selection for parametric imaging (3500/19,93; three echoes per repetition time for each effective echo time).
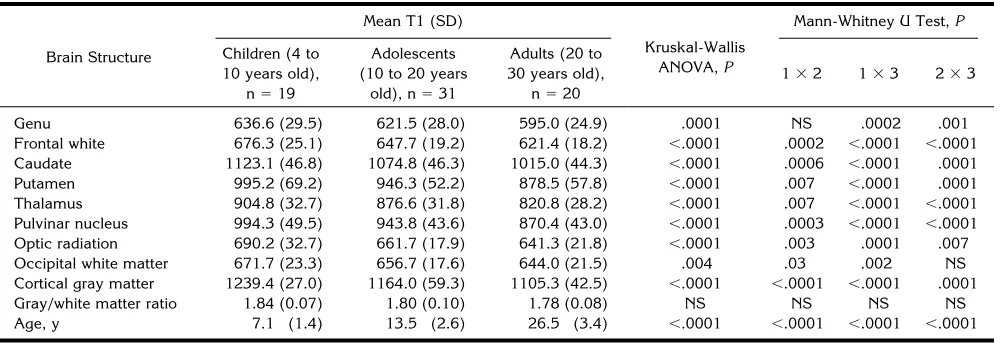
group (Table 1). Nonparametric analysis of variance (Kruskal-Wallis ANOVA) showed a significant trend of decreasing T1 with increas-ing age in every brain structure examined. The least significant T1 finding reported was found in occipital white matter (P ,.004); the signif-icance of all other age regressions was at least P5.0001. However, the ratio of gray matter T1 to white matter T1 (gray/white ratio) did not change significantly with age. Pairwise compar-ison between different age groups showed a significant difference in T1, even between ado-lescents and adults, in every brain structure ex-amined (Table 1).
Simple factorial ANOVA, with age as a factor and with race and sex as covariates, showed that age was a significant source of T1 variation in every brain structure except occipital white matter. Neither sex nor race was a significant covariate in any brain structure except frontal white matter. In frontal white matter, the covari-ates of sex and race were slightly correlated with T1 (P5 .019 andP 5.022, respectively), although our sample size is too small for this result to be convincing.
Regression of T1 Against Age
Regressions of T1 with age are shown for frontal white matter (Fig 2A), caudate (Fig 2B), anterior thalamus (Fig 2C), and cortical gray matter (Fig 2D). A fitted regression line is shown for all data points (n570), together with an indication of the range of T1 values (mean T1 6 2 SD) found in adults less than 30 years
old. Goodness-of-fit data for each regression of T1 with age are summarized (Table 2). Mean T1 of every brain structure decreases significantly with increasing age, and theR2(multiple corre-lation coefficient) for this correcorre-lation averages .64 (6.14). The highest correlation coefficients were found in the pulvinar nucleus (r5.81), the anterior thalamus (r 5 .80), and the cortical gray matter (r 5 .76). Correlation coefficients averaged .73 (6 .11) for all gray matter struc-tures, but only .55 (6 .13) for all white matter structures. The approximate age at which the fitted regression line crosses the upper bound of the normal T1 range for adults is expressed as the age at which the regression “normalizes” (Table 2).
Pixels with T1 Values Characteristic of Gray and White Matter
There were significant changes with age in the raw count of gray matter and white matter pixels. Regression analysis shows that the raw number of gray matter pixels declines with age (r5.79), while the raw number of white matter pixels increases with age (r 5 .84) (Fig 3A). Both these relationships are significant (P , .0001). Furthermore, there is a significant in-verse relationship between raw pixel counts of gray matter and white matter in subjects (n 5 64;R25 .62; F test 541.31; P , .0001) (Fig 3B).
[image:4.587.50.550.96.268.2]Pixel count data are summarized in Table 3. Kruskal-Wallis ANOVA shows a significant trend toward an increase in the proportion of
TABLE 1: Quantitative MR data from healthy control subjects
Brain Structure
Mean T1 (SD)
Kruskal-Wallis ANOVA,P
Mann-Whitney U Test,P
Children (4 to 10 years old),
n519
Adolescents (10 to 20 years
old), n531
Adults (20 to 30 years old),
n520
132 133 233
Genu 636.6 (29.5) 621.5 (28.0) 595.0 (24.9) .0001 NS .0002 .001 Frontal white 676.3 (25.1) 647.7 (19.2) 621.4 (18.2) ,.0001 .0002 ,.0001 ,.0001 Caudate 1123.1 (46.8) 1074.8 (46.3) 1015.0 (44.3) ,.0001 .0006 ,.0001 .0001 Putamen 995.2 (69.2) 946.3 (52.2) 878.5 (57.8) ,.0001 .007 ,.0001 .0001 Thalamus 904.8 (32.7) 876.6 (31.8) 820.8 (28.2) ,.0001 .007 ,.0001 ,.0001 Pulvinar nucleus 994.3 (49.5) 943.8 (43.6) 870.4 (43.0) ,.0001 .0003 ,.0001 ,.0001 Optic radiation 690.2 (32.7) 661.7 (17.9) 641.3 (21.8) ,.0001 .003 .0001 .007 Occipital white matter 671.7 (23.3) 656.7 (17.6) 644.0 (21.5) .004 .03 .002 NS Cortical gray matter 1239.4 (27.0) 1164.0 (59.3) 1105.3 (42.5) ,.0001 ,.0001 ,.0001 .0001 Gray/white matter ratio 1.84 (0.07) 1.80 (0.10) 1.78 (0.08) NS NS NS NS Age, y 7.1 (1.4) 13.5 (2.6) 26.5 (3.4) ,.0001 ,.0001 ,.0001 ,.0001
Note.—Nonparametric statistical tests were used for all comparisons because data are not assumed to have a normal distribution. The Kruskal-Wallis analysis of variance (ANOVA) tested for trends across all age groups (70 subjects total). The Mann-Whitney U test was used for pairwise comparisons between groups; NS indicates no significant difference.
pixels with T1 characteristic of white matter (P,.0001) and a decrease in the proportion of pixels with T1 characteristic of gray matter (P, .0001).
Discussion
Data presented here show unequivocally that T1 decreases with age throughout the brain and that these changes can continue through
[image:5.587.48.546.80.530.2]ado-lescence. For example, T1 of cortical gray mat-ter continues to change through adolescence, and the mean T1 of cortical gray matter in ad-olescents is significantly greater than in young adults (Table 1). Regression analysis shows that cortical gray matter T1 does not normalize to within the normal adult range until about 11 years old, and the regression curve does not approximate the mean adult value until about 20 years of age. Conversely, white matter T1 Fig 2. Plots of T1 against age in various brain structures. A regression (solid line) is shown for T1 against age in all 70 subjects (50 children and 20 adults in the normative population). The range of normal adult T1 values (mean62 SD) is indicated bydotted lines; the point at which thesolid linecrosses the upperdotted lineis defined as the age at which T1 normalizes to the adult value. Nonlinear regressions are shown for frontal white matter T1 (R25.73,P,.0001) (A); caudate T1 (R25.73,P,.00017) (B); anterior thalamus
tends to normalize before 8 years of age, except in the frontal region (Table 2). Therefore, our data suggest that age-related changes tend to reach completion sooner in white matter than in gray matter. Previously, it has been difficult to determine the age at which maturation of corti-cal gray matter occurs, either by histology or conventional MR imaging, because gray matter
[image:6.587.53.545.97.251.2]does not show as obvious a sign of maturation as does white matter. Our data also show clearly that the ratio of gray matter T1 to white matter T1 does not change significantly with age. Therefore, conventional MR imaging meth-ods based on the inherent gray/white matter contrast would be insensitive to the age-related changes we describe.
Fig 3. Parametric image pixel counts as a function of age in 50 children and 20 adults; all pixels counted were exclusively in brain (excluding bone, scalp, and subcutaneous fat).
A, Raw count of pixels defined as gray matter (solid diamonds) and white matter (open diamonds), uncorrected for any differences in head size. Nonlinear regressions are shown for gray matter (r5.84;R2512.60;P,.0001) and for white matter (r5.79;R2510.51; P,.0001).
[image:6.587.49.549.321.532.2]B, The relationship between gray matter pixels and white matter pixels in 70 subjects shows an inverse relationship between the two pixel categories (r5.64;R256.86;P,.0001).
TABLE 2: Age regression data from a quadratic fit of quantitative MR data from healthy control subjects
Brain Structure R2 ANOVA F Test P Y-Intercept
Age, y, at Which Regression Normalizes*
Age, y, at Which Structure Matures†
Genu .56 11.6 .0001 645.6 ;4 2
Splenium .41 5.2 .009 697.1 6.4 2
Frontal white .73 29.5 ,.0001 695.9 11.2 5
Caudate .73 29.1 ,.0001 1175.4 9.5 3
Putamen .55 11.1 .0001 1017.7 5.7 . . .
Thalamus .80 44.9 ,.0001 942.0 12.6 . . .
Pulvinar nucleus .81 47.0 ,.0001 1083.5 11.4 . . . Optic radation .62 16.3 ,.0001 716.0 7.9 . . . Occipital white matter .45 6.5 .004 670.0 ;2 3 Cortical gray matter .76 34.4 ,.0001 1333.5 11.0 1.5 Gray/white matter ratio .30 2.5 NS 1.93 Before birth . . .
* The age at which regression normalizes is the approximate age at which the fitted regression line (for all 70 subjects) crosses the upper boundary of the normal range of adult T1 (defined as mean T1 for a particular structure12 SDs).
† The age at which structures were thought to mature on the basis of conventional MR appearance is abstracted from Holland et al (8) and shown for comparison.
We also report that there is a reduction of mean white matter T1 with increasing age (Ta-ble 1), which may correlate with the process of myelination in white matter tracts. Frontal white matter T1 does not normalize to within the nor-mal adult range until about 11 years old, and the regression curve does not approximate the mean adult value until about 25 years of age. Evidence of continued myelination of white matter tracts is shown by the increase in the raw number of white matter pixels with age and the decrease in the raw number of gray matter pix-els with age (Fig 3A). Furthermore, there is a significant inverse relationship between the number of gray matter pixels and the number of white matter pixels (Fig 3B). Our findings thus suggest that some brain areas, initially catego-rized as gray matter in children, can undergo maturational changes that eventually result in pixel categorization as white matter.
We believe these results are important be-cause they give a more detailed picture of mat-urational changes than was possible in the past. Our results could potentially be extended to young children in order to characterize the full sequence of normal brain development. Current methods of characterizing brain maturation de-pend on clinical history, physical examination, and individual developmental observations (3). These methods are usually sufficient to identify severe problems in development, but mild de-velopmental abnormalities often cannot be reli-ably identified on the basis of clinical findings alone. Developmental delay is diagnosed when a child fails to reach developmental milestones at the expected age, with an adequate leeway given to account for the broad range of normal variation. Because developmental delay has a population prevalence estimated to be as high
as 10% (3), an objective method for character-izing brain maturation would be very useful. Conventional MR imaging of the brain has therefore been recommended for children with asymmetric findings on the neurologic exami-nation, abnormal head growth, extremity weak-ness, changes in motor status, blindweak-ness, deaf-ness, seizures, or other substantial impairments (3).
Yet current conventional MR imaging meth-ods of assessing structural maturity of the brain during childhood or adolescence have limited accuracy and sensitivity. Conventional T1- and T2-weighted sequences show that brain matu-ration proceeds sequentially, from central to pe-ripheral, from inferior to superior, and from pos-terior to anpos-terior areas (10). However, the relative gray/white matter contrast normalizes to an adult appearance by only 3 years of age, and the brain of a young child is thus largely indistinguishable from that of an adult on con-ventional MR images (10). Part of the problem is that automated algorithms for adjusting im-age contrast (window and center), which are routinely available at the imaging console, make image contrast somewhat arbitrary. How-ever, it is also possible that conventional MR imaging is simply too insensitive to detect sub-tle age-related changes in the brain. It would therefore be advantageous to have another method available to the clinician to identify de-velopmental delay, particularly if such a method could be combined with a standard conventional MR imaging examination for sus-pected developmental delay.
[image:7.587.50.546.108.207.2]Previous quantitative MR imaging techniques to study brain maturation have been of limited utility in that they appear to be completely in-sensitive to changes in the adolescent brain.
TABLE 3: Proportion (mean percentage6SD) of white and gray pixel types, calculated by dividing the number of pixels within a range of T1s by the total number of pixels in the image plane within the brain (excluding bone, scalp, and subcutaneous fat)
Comparison
Age Group
Kruskal-Wallis
Mann-Whitney U Test,P
Children (10 Years Old and Younger),
n519
Adolescents (10 to 20 Years Old), n528
Adults (20 to 30 Years Old), n519
132 133 233
White matter pixels, % (SD)
(T1, 568–712) 12.1 (2.7) 16.4 (3.6) 22.6 (3.4) ,.0001 .0001 ,.0001 ,.0001 Gray pixels, % (SD)
(T1, 1160–1440) 29.5 (3.1) 26.0 (3.1) 19.8 (3.0) ,.0001 .0007 ,.0001 ,.0001
Prior efforts to measure brain T1 suggested that the mean T1 of white matter of 2 year olds was within 1 SD of the mean adolescent or adult white matter T1 (data summarized in Table 2) (8). Similarly, the mean T1 of gray matter ap-proximated the adult value by only 1 year of age, and the T1 of the caudate was indistin-guishable from the adult value by 3 years of age. However, prior techniques for measuring T1 were not rigorously quantitative, were gen-erally not well validated, and were not used to examine an adequate normative sample of sub-jects. A well-validated, precise, and accurate method will be required if quantitative MR im-aging is to prove useful in characterizing brain maturation, and this method must be applied to a large sample of healthy subjects.
Careful measurement of T1 by a PAIR tech-nique has already demonstrated significant age-related changes in a healthy population of 55 adults between 18 and 72 years old (23). This PAIR method has now been improved, us-ing a three-parameter fit to correct for a 2% to 3% underestimation of T1 due to flip angle im-perfection in the inverting pulse (P. Kingsley, unpublished data). Application of the new tech-nique of T1 mapping to a population of 50 healthy children demonstrates that T1 can be measured with sufficient precision to show age-related changes in T1 through adolescence (Ta-bles 1 and 2) and that various brain tissues mature at a strikingly different rate (Table 2). However, caution must be exercised because there are not yet enough data to determine whether T1 mapping values can be measured with sufficient accuracy to assess maturation of the individual child.
The age range from birth to about 3 years is of greatest interest to neurologists, because this is the time during which developmental delay is usually first noted (3). A quantitative MR imag-ing method that could corroborate neurologic findings suggestive of developmental delay within this age range would be extremely useful. As yet, we have little data from children under 4 years of age, because our current protocol pre-cludes sedation of healthy children. However, we recently performed a T1 mapping examina-tion on a 10-month-old boy with neuroblas-toma, who was imaged to evaluate cord com-pression. This child’s conventional MR imaging examination of the brain was interpreted as nor-mal, without evidence of metastatic disease. In this case, we found that frontal white matter T1
was 1047 milliseconds, occipital white matter T1 was 989 milliseconds, and cortical gray mat-ter T1 was 1331 milliseconds. While these find-ings are anecdotal, they suggest that T1 is very high at birth and further suggest that the T1 decline we describe during childhood and ado-lescence is perhaps even more striking during infancy. We will continue to accrue control data from infants who are imaged for possible dis-ease but whose findings are normal.
Our data showing age-related changes in the pediatric brain are largely consistent with data obtained by histologic analysis of brain tissue samples. Brain myelination is a dynamic pro-cess that proceeds at different rates in different neuronal systems; it can be asynchronous within a given neuronal system (1, 2) and has been reported to be nearly complete in infants as young as 10 months old (27). It is possible that the reduction in T1 we report in myelinating nerve tracts is related to an increase in the num-ber of protons associated with myelin and to a decrease in the number of free-water protons (28), so that our T1 measurement is actually an approximation to a biexponential decay. How-ever, we have no evidence of biexponentiality of the T1 decay curve in white matter, even in
young children. To determine objectively
whether T1 reduction is caused by an increase in the number of protons associated with mye-lin, it might be possible to image myelin selec-tively, using a technique that discriminates be-tween the very short T1 of bound water and the longer T1 of free water (29).
It is also possible that the reduction in brain T1 with increasing age we report is simply re-lated to a reduction in brain tissue water con-tent. Brain water content decreases from 88% at birth to 82% at 6 months of age, as a result of a nearly 50% increase in dry weight of the brain (30). Brain water content continues to de-crease, albeit at a slower rate, for several more years. Myelin, which is about 30% protein and 40% water, eventually constitutes one half the dry weight of white matter. The degree of my-elination is closely correlated with the choles-terol content of brain, which doubles within the first 6 months of life and continues to increase through at least 4 years of age (30). Our data do not yet permit us to discern among water con-tent, degree of myelination, or some other fac-tor as dominant in affecting brain tissue T1.
The greatest limitation of the PAIR method described here is that it is a single-section
nique, making it less useful for examining pa-tients who may have a diffuse pathologic pro-cess. However, we believe it is important to maintain a high degree of precision and accu-racy when measuring T1; the mean T1 differ-ence between children and adults averaged only 6.9% in white matter and 12.1% in gray matter. Any loss in precision or accuracy may make it impossible to detect such a small difference. Therefore, we are reluctant to use a multisection technique until it has been well validated; none of the techniques that could potentially speed up T1 measurement has been validated as ex-tensively as the PAIR technique, and it is not clear that any would be as accurate and precise. It may soon be possible to obtain four-section coverage of the brain by implementing an inter-leaved PAIR technique, but this technique has not yet been validated.
The T1 mapping method presented here pro-vides essential normative data for studies of patients with specific brain abnormalities, but it may also be useful for assessing maturation in suspected cases of developmental delay. An advantage of using this method to characterize brain maturation is that it might help to focus clinical attention if a particular neuronal system is delayed. This could be important because careful neurologic assessment of developmen-tally delayed children was unable to provide an etiologic diagnosis in 37% (22 of 60) of patients with severe delay (31).
Acknowledgments
We gratefully acknowledge the help of Carol Green-wald, who helped to recruit subjects, and of the families of St Jude Children’s Research Hospital who so generously contributed their time and effort.
References
1. Brody BA, Kinney HC, Kloman AS, Gilles FH. Sequence of central nervous system myelination in human infancy, I: an autopsy study of myelination.J Neuropathol Exp Neurol1987;46:283–301 2. Yakovlev PI, Lecours A-R. The myelogenetic cycles of regional
maturation in the brain. In: Minkowsky A, ed.Regional Develop-ment of the Brain in Early Life.Philadelphia, Pa: Davis; 1967;3–70 3. First LR, Palfrey JS. The infant or young child with developmental
delay.N Engl J Med1994;330:478 – 483
4. Kinney HC, Brody BA, Kloman AS, Gilles FH. Sequence of central nervous system myelination in human infancy, II: patterns of myelination in autopsied infants.J Neuropathol Exp Neurol1988; 47:217–234
5. Bodhireddy S, Lyman WD, Rashbaum WK, Weidenheim KM. Im-munohistochemical detection of myelin basic protein is a sensitive marker of myelination in second trimester human fetal spinal cord.J Neuropathol Exp Neurol1994;53:144 –149
6. Johnson MA, Pennock JM, Bydder GM, et al. Clinical NMR imag-ing of the brain in children: normal and neurologic disease.AJR Am J Roentgenol1983;141:1005–1018
7. Johnson MA, Bydder GM. NMR imaging of the brain in children.Br Med Bull1984;40:175–178
8. Holland BA, Haas DK, Norman D, Brant-Zawadski M, Newton TH. MRI of normal brain maturation.AJNR Am J Neuroradiol1986;7: 201–208
9. McArdle CB, Richardson CJ, Nicholas DA, Mirfakhraee M, Hayden CK, Amparo EG. Developmental features of the neonatal brain: MR imaging, 1: gray-white matter differentiation and myelination. Radiology1987;162:223–229
10. Barkovich AJ, Kjos BO, Jackson DE, Norman D. Normal matu-ration of the neonatal and infant brain: MR imaging at 1.5T. Radiology1988;166:173–180
11. Bird CR, Hedburg M, Drayer BP, Keller PJ, Flom RA, Hodak JA. MR assessment of myelination in infants and children: usefulness of marker sites.AJNR Am J Neuroradiol1989;10:731–740 12. Sakuma H, Nomura Y, Takeda K, et al. Adult and neonatal human
brain: diffusional anisotropy and myelination with diffusion-weighted MR imaging.Radiology1991;180:229 –233
13. Kreis R, Ernst T, Ross BD. Development of the human brain: in vivo quantification of metabolite and water content with proton magnetic resonance spectroscopy.Magn Reson Med1993;30: 424 – 437
14. Kreis R, Ernst T, Ross BD. Absolute quantitation of water and metabolites in the human brain, II: metabolite concentrations.J Magn Reson1993;102:9 –19
15. Steen RG, Gronemeyer SA, Kingsley PB, Reddick WE, Langston JS, Taylor JS. Precise and accurate measurement of proton T1 in human brain in vivo: validation and preliminary clinical applica-tion.J Magn Reson Imaging1994;4:681– 691
16. Reiss AL, Abrams MT, Greenlaw R, Freund L, Denckla MB. Neu-rodevelopmental effects of the FMR-1 full mutation in humans. Nature Med1995;1:159 –167
17. Andreasen NC, Arndt S, Swayze V, et al. Thalamic abnormalities in schizophrenia visualized through magnetic resonance image averaging.Science1994;266:294 –298
18. Barbosa S, Blumhardt LD, Roberts N, Lock T, Edwards RHT. Magnetic resonance relaxation time mapping in multiple sclero-sis: normal appearing white matter and the “invisible” lesion load. Magn Reson Imaging1994;12:33– 42
19. Cleary MA, Walter JH, Wraith JE, et al. Magnetic resonance imaging of the brain in phenylketonuria.Lancet1994;344:87–90 20. Grunewald RA, Jackson GD, Connelly A, Duncan JS. MR detec-tion of hippocampal disease in epilepsy: factors influencing T2 relaxation time.AJNR Am J Neuroradiol1994;15:1149 –1156 21. Aylward EH, Henderer JD, McArthur JC, et al. Reduced basal
ganglia volume in HIV-1-associated dementia: results from quan-titative neuroimaging.Neurology1993;43:2099 –2104
22. Aylward EH, Brettschneider PD, McArthur JC, et al. Magnetic resonance imaging measurement of gray matter volume reduc-tions in HIV dementia.Am J Psychiatry1995;52:987–994 23. Steen RG, Gronemeyer SA, Taylor JS. Age-related changes in
proton T1 values of normal human brain.J Magn Reson Imaging 1995;5:43– 48
25. Reddick WE, Ogg RJ, Steen RG, Taylor JS. Statistical error map-ping for reliable quantitative T1 imaging.J Magn Reson Imaging 1996;6:244 –249
26. Hendrick RE, Raff U. Image contrast and noise. In: Stark D, Bradley WG, eds.Magnetic Resonance Imaging.2nd ed. St Louis, Mo: Mosby-Year Book; 1992;1:109 –144
27. Dietrich RB, Bradley WG, Zaragoza EJ, et al. MR evaluation of early myelination patterns in normal and developmentally de-layed infants.AJNR Am J Neuroradiol1988;9:69 –76
28. Koenig SH, Brown RD. The raw and the cooked, or the importance
of the motion of water for MRI revisited.Invest Radiol1988;23: 495– 497
29. MacKay A, Whittall K, Adler J, Li D, Paty D, Graeb D. In vivo visualization of myelin water in brain by magnetic resonance. Magn Reson Med1994;31:673– 677
30. Dobbing J, Sands J. Quantitative growth and development of human brain.Arch Dis Child1970;48:757–767
31. Majnemer A, Shevell MI. Diagnostic yield of the neurologic as-sessment of the developmentally delayed child.J Pediatr1995; 127:193–199