This paper is made available online in accordance with
publisher policies. Please scroll down to view the document
itself. Please refer to the repository record for this item and our
policy information available from the repository home page for
further information.
To see the final version of this paper please visit the publisher’s website.
Access to the published version may require a subscription.
Author(s): Benjamin Chain , Helen Bowen , John Hammond , Wilfried
Posch , Jane Rasaiyaah , Jhen Tsang and Mahdad Noursadeghi
Article Title: Error, reproducibility and sensitivity: a pipeline for data
processing of Agilent oligonucleotide expression arrays
Year of publication: 2010
Open Access
R E S E A R C H A R T I C L E
© 2010 Chain et al; licensee BioMed Central Ltd. This is an Open Access article distributed under the terms of the Creative Commons Attribution License (http://creativecommons.org/licenses/by/2.0), which permits unrestricted use, distribution, and reproduction in any medium, provided the original work is properly cited.
Research article
Error, reproducibility and sensitivity: a pipeline for
data processing of Agilent oligonucleotide
expression arrays
Benjamin Chain*
1,3, Helen Bowen
2, John Hammond
2, Wilfried Posch
1, Jane Rasaiyaah
1, Jhen Tsang
1and
Mahdad Noursadeghi
1Abstract
Background: Expression microarrays are increasingly used to obtain large scale transcriptomic information on a wide range of biological samples. Nevertheless, there is still much debate on the best ways to process data, to design experiments and analyse the output. Furthermore, many of the more sophisticated mathematical approaches to data analysis in the literature remain inaccessible to much of the biological research community. In this study we examine ways of extracting and analysing a large data set obtained using the Agilent long oligonucleotide transcriptomics platform, applied to a set of human macrophage and dendritic cell samples.
Results: We describe and validate a series of data extraction, transformation and normalisation steps which are implemented via a new R function. Analysis of replicate normalised reference data demonstrate that intrarray variability is small (only around 2% of the mean log signal), while interarray variability from replicate array measurements has a standard deviation (SD) of around 0.5 log2 units ( 6% of mean). The common practise of working with ratios of Cy5/Cy3 signal offers little further improvement in terms of reducing error. Comparison to expression data obtained using Arabidopsis samples demonstrates that the large number of genes in each sample showing a low level of transcription reflect the real complexity of the cellular transcriptome. Multidimensional scaling is used to show that the processed data identifies an underlying structure which reflect some of the key biological variables which define the data set. This structure is robust, allowing reliable comparison of samples collected over a number of years and collected by a variety of operators.
Conclusions: This study outlines a robust and easily implemented pipeline for extracting, transforming normalising and visualising transcriptomic array data from Agilent expression platform. The analysis is used to obtain quantitative estimates of the SD arising from experimental (non biological) intra- and interarray variability, and for a lower threshold for determining whether an individual gene is expressed. The study provides a reliable basis for further more extensive studies of the systems biology of eukaryotic cells.
Background
The application of microarray technology to study the expression of thousands of genes in biological samples has become commonplace. The diversity of technologies initially explored has been replaced by a landscape domi-nated by a small number of proprietary platforms, which differ principally in the type of probe used for hybridisa-tion. Each platform has advantages and disadvantages,
and knowledge of technical reproducibility and sources of data variability is crucial to optimising experimental design and data analysis. The reproducibility and compa-rability of several different platforms has been rigorously examined in the MAQC project, and overall the different platforms give reassuringly similar results, with similar accuracy and sensitivities [1].
We have collected a large number of array data sets from Agilent human genome arrays [2]. The latest releases of these arrays have approximately 44300 fea-tures, which include various control oligonucleotides,
* Correspondence: [email protected]
1 Division of infection and Immunity, UCL, London, UK
and a set of 41001 different oligonucleotide 60 mers com-plimentary to unique human mRNA sequences. Of these 41001, the latest Agilent annotation lists 29,806 as corre-sponding to known genes and/or ORFs, of which 19392 are unique. Around 12000 probes correspond to as yet unannotated stretches of human genome. The Agilent platform is designed to be used as a two colour system, probing and then detecting hybridisation of two different cDNA samples labelled with different fluorescent dyes on the same array (typically Cy3 in the green channel and Cy5 in the red channel).
Although there are now many published studies using the Agilent arrays, there is a paucity of studies systemati-cally investigating the reproducibility and sources of vari-ation in this microarray platform. There is also relatively little software for implementation of data preprocessing for this platform. Using a set of data generated from this array platform, we dissect the major contributors to experimental variability within the data. We develop a new R package (agilp) to extract data from Agilent raw data files, and implement a robust Loess normalisation to a mean of multiple experiments. This reduces variability to a level which allows accurate and informative compari-sons between array data sets collected at different times and by different operators. We also demonstrate that the low level expression detected by the Agilent arrays for the majority of genes in any one cell type likely corresponds to a genuine high degree of transcriptomic complexity, and is unlikely to arise from weak non specific cross-hybridisation. The results of the study thus give confi-dence to studies which use this technology and quantify important performance parameters which can be used to optimise the design and interpretation of future tran-scriptomic experiments.
Results
Impact of logarithimic transformation
We initially examined a set of 77 data sets ( arrays 1-77 in Additional File 1, Table S1) collected in our laboratory over a period of about three years. In each experiment the Agilent human whole genome expression arrays were probed with a mixture of two cDNA preparations labelled with Cy3 and Cy5 respectively. The Cy3 sample in every experiment was a sample of "reference" cDNA prepared from the Stratagene Universal Human Reference reagent. The same batch of reference RNA was used in all cases, although several different batches of labelled cDNA were made. The Cy5-labelled cDNA was prepared from RNA extracted from monocyte derived macrophages or den-dritic cells, or the Mutz-3 leukaemic cell line cultured and/or stimulated in a variety of different ways. A sum-mary of the cell type/experimental stimulus for each array is provided in Additional file 1 Table S1. The Cy5 channel for this first set of arrays therefore always
pro-vided data for the experimental sample, while the Cy3 provided data for the reference.
The raw output from the scanner shows a large dynamic range from around 60 to 200000 arbitrary units. These data are commonly log transformed prior to manipulation, in order to make the standard deviation (SD) independent of magnitude, and improve the fit to a Gaussian normal distribution. Both these assumptions were therefore tested on the set of reference arrays.
The relationship between SD and mean magnitude of signal across the arrays for each array feature, using raw and log2 transformed data is shown in fig 1a. Using a sim-ple linear model, the SD of the raw data can be seen to be magnitude dependent (slope = 0.37, R2 = 0.87). Log
2
transformation substantially stabilises the SD (slope 0.16, R2 = 0.55)(fig 1b). Further Loess normalisation as
described in detail below stabilises the SD even further (slope = 0.06, R2 = 0.22).
The normality of the distribution of the signal across the arrays was tested using the Shapiro Wilk test for each probe individually. The fit varied widely for different probes. However, the proportion of probes whose distri-bution did not differ significantly from normality (p > 0.05) increased from 55% to 78% when Log2 transformed data were analysed. Log2 transformed data were therefore
used for all further analysis.
Variation attributable to intra array "experimental error."
Variation in signal between features with the same probe sequence (i.e. probe replicates) provides a good measure of intra-array variation. This variation can be evaluated using 263 oligonucleotides which are replicated 10 times in different positions of the 4 × 4 Human genome Agilent arrays, and a "negative control" oligonucleotide (3 × SLv1) which is present 153 times. The average SD for each set of 10 replicates for each of these 263 probes (including the negative control) was calculated. The calculation was repeated for data from five randomly chosen arrays. The average SD was 0.20 log2 units for the Cy5 signal, and 0.16 log2 units for the Cy3 signal (Table 1). The Cy3 and Cy5 signal within each set of replicates within a single array was highly correlated, suggesting the variation was due to local differences (e.g. the efficiency of oligonucleotide synthesis, or the position of the oligonucleotide within the array). However, the SD represented only 2% of the mean log signal for all these replicate probes, highlighting the reproducibility and homogeneity of array construc-tion. Further analysis used the within array average of replicate probes.
Variation attributable to inter array experimental "error."
hybridisa-tion condihybridisa-tions, inter array variahybridisa-tion etc.) from variahybridisa-tion arising from differences in the biological samples being tested, we first analysed variation in the Cy3 signal, which represents hybridisation of an identical biological sample 77 times (Table 1, second column). The average SD for each probe across the arrays for the Cy3 signal was 0.56, representing 6.6% of the mean signal. By comparison, the SD for the Cy5 channel, which includes additional varia-tion from biological variables (e.g. different cell type,
dif-ferent stimuli etc.), as well as unknown intrinsic biological variability was 0.91 (Table 1).
Reduction in variability by normalisation via linear regression
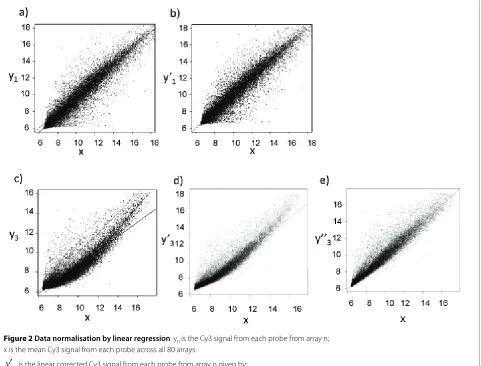
[image:4.595.60.540.97.362.2]In order to reduce variability by correcting for systematic differences between arrays we normalised the data by simple linear or LOESS local linear regression against the
Figure 1 The relationship between SD and magnitude of signal. The signal SD calculated for each probe from Cy3 data from 77 reference arrays was plotted against the mean signal. The calculation of mean and SD was done either using raw median signal intensity (left plot) or log2 (median signal intensity).
Table 1: Intra and inter array variation, before and after normalisation
Within Array1 Log transformed without
normalisation2
Log transformed with linear regression normalisation2,3
Log transformed with LOESS linear regression normalisation2,3
SD Cy5 0.20 0.91 0.56 0.52
SD Cy3 0.16 0.56 0.31 0.24
Correl Cy5:Cy3 0.84 0.53 0.45 0.40
CoVar Cy5:Cy3 0.02 0.34 0.11 0.09
SD Cy5/Cy34 0.13 0.64 0.43 0.38
1. The SD for Cy3 and Cy5, and the correlation and covariance between Cy3 and Cy5 signals, was calculated across all replicates for each probe which is represented by multiple within array replicates. The Table shows the average of these SDs for all this subset of replicated probes, from a random sample of five arrays.
2. The SD for Cy3 and Cy5, and the correlation and covariance between Cy3 and Cy5 signals, was calculated for each probe across all 77 arrays, and then averaged across all probes.
[image:4.595.56.541.554.662.2]mean signal of all the samples (i.e. a model in which the mean and the slope is held constant).
To illustrate the effect of the normalisation, the Cy3 probe signal intensities from two sample arrays are plot-ted against the average probe signal calculaplot-ted from all the arrays (Fig. 2). It is evident that for the first array, the linear fit is relatively good across the whole range of data, but there is a systematic decrease in signal intensity across the whole range relative to the mean (Fig.2a; R2 =
0.93). The normalisation of this array by subtraction of the regression model provided appropriate correction of the signal values (Fig.2b). In the second example, the lin-ear fit is less good (R2 = 0.857), and a local linear
regres-sion model (LOESS ) gives a better overall fit (Fig. 2c). The normalisation of this array by subtraction of the
regression model provided appropriate correction of the signal values (Fig.2d,e).
[image:5.595.59.540.290.656.2]We applied both simple linear and LOESS local linear regression (dividing up the range into 10 local data sets) across the whole set of arrays. Using the normalised data, we calculated the average SD for each probe (the gene-wise SD) across the set of arrays (Table 1). Linear regres-sion normalisation decreased the average SD of the Cy3 reference array data set to 0.31. LOESS normalisation decreased the SD further to 0.24 (3% of the mean log intensity for the whole array) . 95% of genes had a SD < 0.46 log2 units. The equivalent SD values for the experi-mental (Cy5) data were also correspondingly decreased (Table 1). We also evaluated quantile normalisation, the preprocessing normalisation implemented in the widely
Figure 2 Data normalisation by linear regression. yn is the Cy3 signal from each probe from array n; x is the mean Cy3 signal from each probe across all 80 arrays.
is the linear corrected Cy3 signal from each probe from array n given by:
= Yn-((α + βx)- x) where α and β are the intercept and slope of the linear regression of yn on x.
is the Loess corrected Cy3 signal from each probe from array n given by:
where α and β are the set of intercepts and slopes of the Loess linear regression of yn on x, dividing the range of x into 10 equal segments.
Panels a) and b) show data for n = 1. c), d) and e) show data for n = 3. The dashed line shows x = y; the solid line shows the fitted linear regression. The thick solid line shows the fitted LOESS regression.
′
yn
′
yn
′′
yn
′′
used Affymetrix RMA [3,4] method, which reduced the average SD for the Cy3 channel to 0.29.
Further reduction of variation by normalisation via ratio to the reference sample
We next examined whether using the ratio of experimen-tal to reference signal for each probe introduces signifi-cant further benefit, as reflected in a further reduction in variation of the data. The SD of the difference between the two data sets "reference" and "experimental" is given by:
The covariance between experimental and reference signal was therefore calculated for each probe across the set of arrays (Table 1). The average covariance for all probes was then used to calculate the corrected SD of the difference (ratio) between experimental and reference data sets. Using the ratio for each probe slightly decreased the overall SD of the normalised data (Table 1). The "probe specific" normalisation therefore provides an additional small benefit (in terms of reduction in variabil-ity) over and above the global normalisation introduced above.
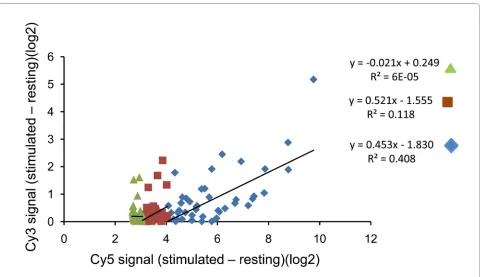
Unexpectedly, for probes showing the biggest stimula-tion indices (i.e. the greatest response to interferon), the stimulation index in the green channel is positively corre-lated to the stimulation index observed in the red chan-nel. This effect is only seen at high stimulation indices, and the correlation is lost once the difference in signal is less than 3 log2 units.
The phenomenon is illustrated in fig 3. LOESS norma-lised data was obtained from two sets of arrays of human macrophages, one from a sample of unstimulated mac-rophages and one from macmac-rophages stimulated for four hours with interferon beta. The signal obtained in the presence of interferon was then subtracted from that in the absence of interferon (i.e. thus deriving the stimula-tion index) for each gene. The top 50 stimulastimula-tion indices obtained in this way (i.e. those probes showing the big-gest differences between samples) were plotted against the ratios observed for the corresponding green reference channel for the same probe (which should show no "stim-ulation index", since they come from identical samples) (fig 3). A similar apparent interference (enhancement) of the green signal by a large change in red signal was observed in several other independent experiments. In order to test that the enhancement was not a result of optical crossover (unlikely given the non-overlapping flu-orescence spectra of Cy3 and Cy5), an array was
hybri-dised with Cy5 labelled DNA only. The maximum signal observed in the green channel was less than 1% of the equivalent red signal, even at the highest levels of red flu-orescence. The molecular basis for the interference between binding of the two differentially labelled samples remains unknown, but the phenomenon has implications both for using red/green ratio measurements, and for experimental design which are discussed further below.
Low intensity signals in Agilent array hybridisation
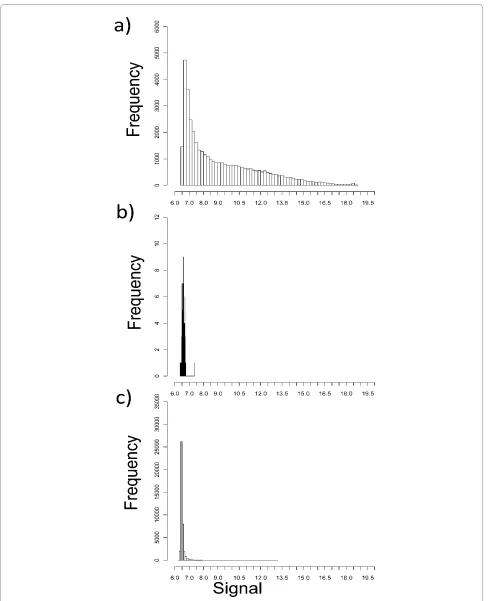
One feature of Agilent arrays is a very large number of probes have a low signal value, close to, but significantly above background. This is illustrated by a comparison between the signal distribution obtained from one repre-sentative sample compared to the distribution of the sig-nal from the "negative control" probe provided by Agilent (fig 4a,b).
These data might support a hypothesis that a large number of genes are being transcribed in any one cell type. However, the conclusion is reliant on the the nega-tive control supplied by Agilent. We therefore tested the hypothesis independently. In view of the very large evolu-tionary distance between Arabidopsis and humans, and the process of Agilent selection of probe sequences so as to avoid repetitive elements or highly conserved common sequences, we predicted that the plant RNA samples should show very little true hybridisation to the arrays. In contrast, if the low level signals were as a result of ran-dom low stringency interactions, this should occur to a similar extent using the plant as the human samples. The log signal frequency distribution for the average of three Arabidopsis samples (the data could not be normalised in the same way, since the assumptions that the mean signal is the same is obviously false) was compared to the signal distribution for human samples (fig 4c). The majority of the probes from the arrays hybridised to the Arabidopsis samples gave signals close to or just above the back-ground probe.
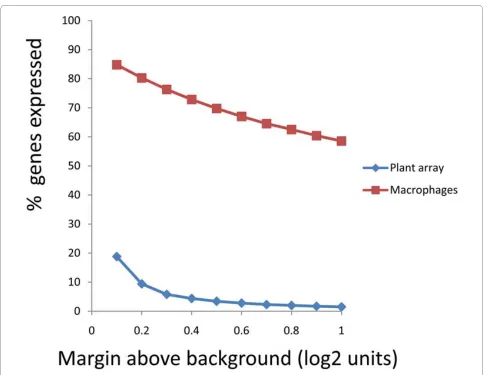
The data from the Arabidospis samples could be used to calculate an upper limit for "false positive" detection, and hence estimate the proportion of probes showing real positive signals with the human samples (fig 5). In order to analyse the data, we calculated the% of probes showing a positive signal at a range of arbitrary cut-offs above the background probe signal. As discussed above, the % probes showing a positive signal falls off slowly as the cut-off is increased, remaining above 60% up to 0.6 log units above background. In contrast, the % probes showing a positive signal with the plant array samples fell off sharply with cut-off. For example, at a cutoff of 0.5 log units above background, less than 5% probes gave a positive signal, in contrast with 65% when using the human sam-ple.
SD Difference SD experimental SD reference 2 Covaria
2
(
)
= 2(
)
+ 2(
)
Array reproducibility viewed through multidimensional scaling
Having established the basic parameters of error/variabil-ity, we examined whether global patterns of gene expres-sion were reproducible and robust when comparing data collected over a time period of several years, and by dif-ferent operators. The same data set of arrays log2 trans-formed and Loess normalised as detailed above were analysed using classical multidimensional scaling (MDS), a powerful unsupervised approach to identify relation-ships between sets of arrays. Since the distance matrices are based on Euclidean distance metrics this analysis is mathematically equivalent to Principal Component Anal-ysis.
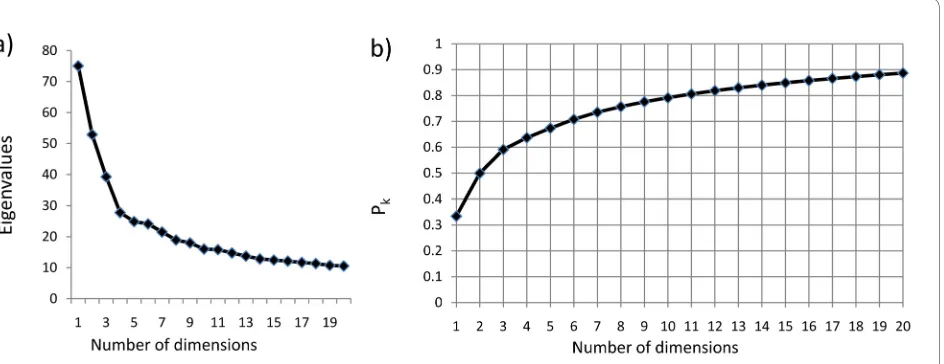
A first step in MDS is to establish the number of dimensions which provides a reasonable compromise between preserving the main features of the data, and minimising complexity. One common approach is to plot the principal eigenvalues (or SDs) to look for an obvious "step" in the slope (fig 6a). There appear to be discontinu-ities at dimension 4 and again at 10/11. We therefore cal-culated the goodness of fit parameter Pk for different
numbers of dimensions (fig 6b):
K is the number of dimensions, n is the number of arrays, and λi is the ith eigenvalue. A value of around 0.8 (at which around 80% of the SD has been accounted for) has been proposed as a good cut-off for adequately repre-senting the original data (e.g.[5] ). Ten dimensions were therefore analysed. The justification for including this unusually large number of dimensions is discussed fur-ther below.
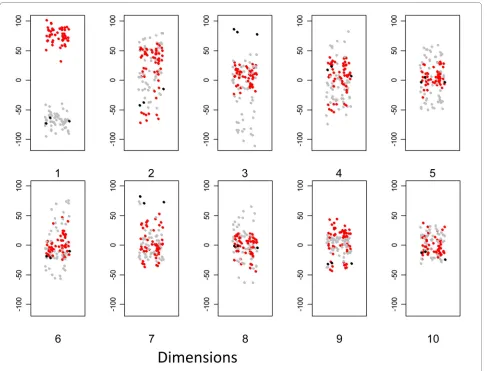
We first examined the distribution of arrays from the point of view of cell type (fig 7). The range of y values decreases with increasing dimension, illustrating the expected decrease in overall variance. The major cell types are clearly segregated within the first few dimen-sions. Dendritic cells and macrophages are well separated in the first dimension, irrespective of stimulus, or other experimental variable. The dendritic cells derived from the Mutz3 myeloid leukaemic cell line [6] map with den-dritic cells in the first dimension but segregate away in dimension 3. The variance in dimension 2, in contrast, seems to reflect differences largely unrelated to cell type.
Pk = = =
= = −
∑
∑
( li) / ( li)
i i k
i i n
1 1
1
[image:7.595.59.545.93.370.2](2)
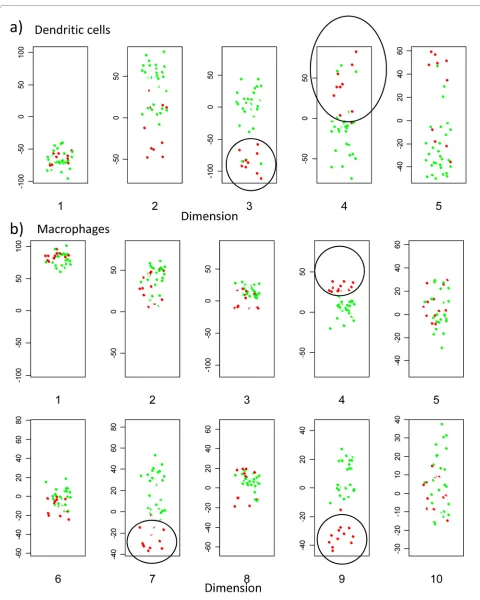
We next examined the distribution in relation to stimu-lus (fig 8). The dendritic cell response to LPS is clearly identified in dimension 3 and 4. Interestingly, a set of 3 non-stimulated dendritic cell cultures also co-cluster with the lipopolysaccahride (LPS) activated cells. Further inspection revealed that these three cultures were derived from monocytes all from the same individual, suggesting that these dendritic cells may have been already "vated" prior to addition of LPS. Such "spontaneously acti-vated" dendritic cells are a common observation in our experience. A second interesting observation is that the impact of LPS on macrophages (fig 8b) is seen in dimen-sions different to that for dendritic cells (fig 8a) (i.e. not in dimension 3, but clearly in dimensions 7 and 9 ). These results suggest that the transcriptional response of mac-rophages and dendritic cells to the same stimulus is made up predominantly of different sets of genes.
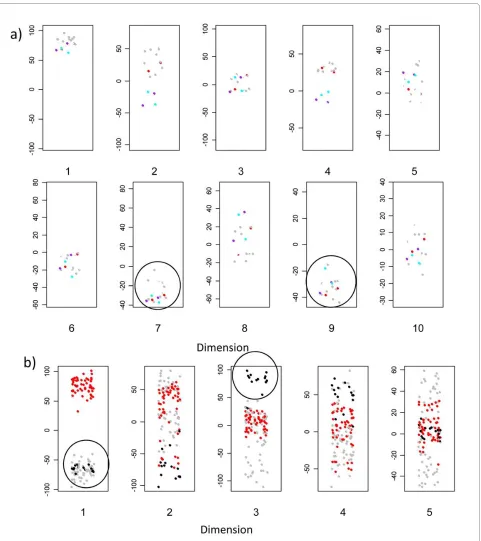
We carried out two additional sets of hybridisations to test the reproducibility of the arrays over time. Two old samples of macrophage RNA (LPS stimulated ) were rela-belled in Cy3, and hybridised to new arrays together with old stored Cy5 labelled samples . The old and new arrays cocluster, irrespective of dye labelling or long term stor-age (fig 9a). In particular, all three sets clearly cocluster with the LPS response group within the key "macrophage LPS response " dimensions 7 and 9. Interestingly, the dif-ferent repeats do segregate away from each other in other dimensions (e.g. 4), suggesting that differences due to experimental protocol can be distinguished from true biologically interesting changes using this multidimen-sional approach to data analysis.
In addition, we analysed a set of 12 newly prepared Mutz-3 derived dendritic cell arrays (fig 9b) including a set of three additional unstimulated cultures (i.e.
[image:9.595.56.540.91.466.2]cal replicates). All twelve sets cocluster with the old Mutz-3 dendritic cells in dimensions 1 and 3 (i.e. away from monocyte derived DC in dimension 3). Experimen-tal variation which may reflect batch differences between the first and second set of experiments is also detectable in higher dimensions (not shown).
Discussion
In this study, we have developed a pipeline for processing and analysis of data obtained using the Agilent human 44 K expression array platform. We have assessed commonly adopted preprocessing computational procedures, tested reproducibility of the method and the determinants of variability. Interestingly, investigation of the true back-ground signal intensity, suggested that there is low-level transcriptional activity across most of the genome even in highly differentiated macrophages and dendritic cells. Finally, we have illustrated the application of multidimen-sional scaling to interrogate complex relationships between individual expression profiles in a large data set.
We confirmed that logarithmic transformation of the raw data facilitates downstream data processing by signif-icantly reducing the dependence of the SD on the signal intensity, and by improving approximation to a normal distribution for many probe signals. Log2 transformation did not completely standardise variance vis a vis intensity, and in situations where this becomes critical, additional more complex alternative transformations can easily be incorporated e.g. [7].
A large number of different approaches to data normal-isation have been explored in order to improve the repro-ducibility of array data, particularly with the objective of comparing data generated from different experiments
[8-12] . Many of these were designed for the Affymetrix platform (e.g. RMA, dCHIP, GCOS) and are not readily implemented for the Agilent platform . Nevertheless, we compared the Loess normalisation used in this study to the quantile normalisation which is the basis for data pre-processing in RMA and RMA based packages [3,4]. Quantile normalisation and LOESS normalisation reduced the average standard error of the data similarly. However, as discussed in the original implementation of the RMA normalisation algorithm [3], quantile normali-sation may "overnormalise" giving identical or very simi-lar values at the extremes of the quantile range. This problem is less serious in dealing with data from the Affymetrix platform, which uses multiple probe sets per gene, and has inter probe variances often greater than the inter array variance. One of the most detailed published comparisons of alternative normalisation approaches did also include a baseline Loess normalisation procedure similar to the one used here [3]. The study found rela-tively subtle differences between normalisation tech-niques, but did not report absolute levels of error, rendering comparison difficult.
[image:10.595.69.541.97.279.2]The use of two colour ratio normalisation, which is possible with the Agilent platform but not Affymetrix, is in fact implemented in the proprietary normalisation supplied by Agilent. The advantage of this normalisation, over global array normalisations, is that it can theoreti-cally correct for probe specific systematic errors. How-ever, as shown in equation 1, ratios decrease variance only when correlation between channels is high, and noise in the "reference" channel is small. Previous studies have in fact suggested that the Agilent normalisation pro-tocol is sub-optimal. In fact, as illustrated in Table 1, the
actual decrease in variance observed by introducing ratio normalisation with the two colour array signals is very modest. This modest gain needs to be weighed against disadvantages of the ratio measure. Firstly, ratios behave counter intuitively in terms of biological processes at both extremes of the signal range, adopting increasingly large negative values which tend to infinity as the experi-mental signal approaches zero. Secondly, we detected an unexpected interaction between independent Cy3 and Cy5 signals at high signal intensities, although the mecha-nisms remains unclear. Although the effect is only seen for a small number of genes, it may nevertheless prejudice the outcome of experiments which use a reference sample in one channel. Overall, the use of the two colour format to run a reference array for each experimental sample is not supported by our study, a conclusion in line with pre-vious studies [13].
In summary, the preprocessing steps implemented in this study significantly reduce the variation due to
experi-mental, rather than biological variation. This value pro-vides a good estimate of the overall SD of the signal attributable to the various sources of intrinsic "experi-mental error". Given the Gaussian nature of log signal variation for most probes, differences between experi-ments of one log2 unit should be detectable even with
rather low sample sizes. However, future studies using spike-in controls, and including comparisons to q-PCR data will be required to validate the analysis given here, and to determine the true discriminatory power of the data. More precise modelling, using probe specific vari-ances computed from the large set of reference arrays, or more sophisticated Bayesian inference [14]may further improve the quality of the data.
[image:11.595.57.544.94.465.2]The presence of a very large number of probes showing low level hybridisation prompted us to try and distin-guish background from low level gene transcription. Hybridisation of the Arabidopsis samples established a realistic background cut-off to determine the boundary at
which genes may be considered to be ON or OFF, and showed transcriptional activity for approximately 70% within human macrophage samples. This degree of tran-scriptional diversity suggests transcription is going on across the majority of the genome even in a single cell type, and is in accord with recent estimates of cell tran-scriptional complexity obtained from deep sequencing [15,16], and also with the recent upward revision of esti-mates of the frequencies of transcriptional start sites within the human genome [17]. This data cannot how-ever address the question of whether the mRNA message are translated or even complete.
In general, the power of genome-wide arrays lies in its ability to define a global transcriptomic response, made up of complex patterns of interacting genes. In order to analyse the extent to which these patterns remained reproducible and robust in the face of experimental error and variation, we used MDS which is equivalent to prin-cipal component analysis for continuous Euclidean
dis-tance measurements and retains more of the information than conventional hierarchical clustering.
[image:14.595.59.541.89.474.2]MDS analysis of the macrophage/dendritic cell data set (after Loess normalisation) confirmed that the key under-lying structure of the data set is robust, and that sample relationships are conserved even when samples are col-lected at different times, and by different operators. For example, the distinction between macrophages and den-dritic cells, between normal and leukaemic denden-dritic cells, and between resting and LPS stimulation were all very robust to underlying experimental variation. Of interest, the biologically meaningful variables such as those described above, usually segregated from the "arti-factual" variables (such as when the experiments was car-ried out, or the array format) into a different dimension. Since the MDS axes are orthogonal this suggests that the biological and artifactual variables are often determined by non-overlapping sets of gene probes, and the identifi-cation of these genes is the subject of on-going analysis.
Conclusion
Agilent long oligonucleotide expression arrays represent a robust and increasingly affordable tool for mapping transcriptional activity within the majority of human open reading frames. With correct data processing and normalisation, the genewise variability can be reduced to a few % of the average signal intensity. The pipeline of protocols for data collection, processing and subsequent analysis developed in this study (fig 10) allows robust, and reproducible identification of small gene differences, and reliably preserves the complex transcriptomic relation-ships associated with important biological variables. Importantly, the common custom of using ratios of sig-nals in the two channels is shown to be redundant, and indeed in certain situations, to reduce the sensitivity of the analysis. Furthermore, the sensitivity of the system allows detection of a large number of low abundance transcripts and confirms the widespread transcriptional activity even within a single cell type.
Methods
Sample collection. The methods for human cell sample collection, array hybridisation and sample collection have all been described previously [18,19]. A summary of all the samples used is given in Additional File 1 Table S1.
The reference sample is the Stratagene Universal Human Reference reagent, which consists of a mixture of RNA from ten different human cell lines (#740000, Strat-agene, Agilent Technologies, Stockport, UK).
Seeds of Arabidopsis thaliana (L.) Heynh. were obtained from the Nottingham Arabidopsis Stock Centre. Plants were grown on 0.8% agar with 0.25 × MS salts, adjusted to pH 5.6 with NaOH, under conditions described previously [20]. At 19 days after sowing, non-senescent, fully-expanded rosette leaves were pooled from 8-22 plants and snap-frozen at -70°C. The experi-ment was triplicated in three sequential blocks. RNA was initially extracted from tissue samples using a modified TRIzol extraction method [21]. Extracted total RNA was then purified using the 'RNA Cleanup' protocol for RNeasy columns with on-column DNase digestion to remove residual chromosomal DNA (Qiagen, Crawley, West Sussex, UK).
Labelled cRNA samples were generated from RNA samples using the Low RNA Input Fluorescent Linear Amplification Kit according to the manufacturer's instructions (Agilent Technologies, Santa Clara, CA, USA). cRNA was synthesised from the double-stranded cDNA using T7 RNA polymerase, incorporating Cyanine 5-labelled CTP fluorescent dyes (PerkinElemer Life and Analytical Sciences, Boston, MA, USA). Labelled cRNA samples were cleaned using the 'RNA Cleanup' protocol for RNeasy columns (Qiagen) performed at 4°C and
eluted using two 30 μL volumes of nuclease-free H2O. Mean dye incorporation for labelled cRNA was 19.53 (± 1.99 SEM, n = 3) pmol dye μg-1 cRNA.
Hybridisation of the Agilent 4 × 44 K whole human genome cDNA microarrays according to manufacturer's instructions http://www.agilent.com. Array images were acquired with Agilent's dual-laser microarray scanner G2565BA (5 μ resolution) and signal data were collected with dedicated Agilent Feature Extraction software (v9.5.1).
The original scanner output files and the normalized microarray data (see below) have been submitted to the ArrayExpress database http://www.ebi.ac.uk/arrayex-press, accession number E-TABM-942). A summary of the samples is given in supplementary Table S1.
The R code for the extraction of raw data from scanner files, removal of duplicates, and Loess normalisation, is available (as function "AAProcess" in package agilp) from the R CRAN repository. http://cran.r-project.org/web/ packages/.
The statistical analysis was mostly carried out in R. The functions Shapiro.test and ks.test were used to test for normality. Multidimensional scaling was carried out using the functions distanceMatrix (using Euclidean dis-tance) from the package ClassDiscovery, part of the OOMPA suite of libraries http://bioinformat-ics.mdanderson.org/Software/OOMPA/, and the func-tion cmdscale from the stats package.
Additional material
Authors' contributions
HB and JH provided the Arabidopsis labelled RNA samples, and contributed to revision of the manuscript. JR, JT and WP prepared all the other RNA samples, and carried out all the hybridisations. MN supervised the RNA preparation, labelling and hybridisation. BC carried out the data analysis, wrote the R scripts, and prepared the first draft of the manuscript. The study was carried out under the joint direction of BC and MN. All authors read and approved the final ver-sion of the manuscript.
Acknowledgements
This study was supported in part by a BBSRC/Unilever CASE Studentship awarded to JR. This work is part of Unilever's on-going effort to develop novel ways of delivering consumer safety. JT and MN were supported by a Wellcome Trust fellowship to MN. The project was also supported by a grant to BC from the NIHR UCLH/UCL Comprehensive Biomedical Research Centre. We are very grateful to Jane Galbraith (Dept. Statistics, UCL) for extensive help and advice on aspects of the statistical analysis.
Author Details
1Division of infection and Immunity, UCL, London, UK, 2Warwick HRI, University of Warwick, Warwick, UK and 3Windeyer Building, 46 Cleveland St., UCL,W1F 4JT, London, UK
Additional file 1 Table S1: The details of all the arrays analysed in this study. An Excel file containing the basic experimental annotation for each array analysed, together with a data base identifier.
Received: 4 November 2009 Accepted: 24 June 2010 Published: 24 June 2010
This article is available from: http://www.biomedcentral.com/1471-2105/11/344 © 2010 Chain et al; licensee BioMed Central Ltd.
This is an Open Access article distributed under the terms of the Creative Commons Attribution License (http://creativecommons.org/licenses/by/2.0), which permits unrestricted use, distribution, and reproduction in any medium, provided the original work is properly cited.
References
1. Shi L, et al.: The MicroArray Quality Control (MAQC) project shows inter- and intraplatform reproducibility of gene expression measurements.
Nat Biotechnol 2006, 24:1151-1161.
2. Agilent Whole Human Genome Expression Arrays 2010 [http:// www.chem.agilent.com/en-us/products/instruments/dnamicroarrays/ wholehumangenomeoligomicroarraykit/pages/default.aspx]. 3. Bolstad BM, Irizarry RA, Astrand M, Speed TP: A comparison of
normalization methods for high density oligonucleotide array data based on variance and bias. Bioinformatics 2003, 19:185-193. 4. McCall MN, Bolstad BM, Irizarry RA: Frozen robust multiarray analysis
(fRMA). Biostatistics 2010, 11:242-253.
5. Everitt BS, Dunn J: Multidimensional scaling. In Applied multivariate data
analysis 2nd edition. Hodder Arnold, London, UK; 2001:93-122.
6. Rasaiyaah J, Noursadeghi M, Kellam P, Chain B: Transcriptional and functional defects of dendritic cells derived from the MUTZ-3 leukaemia line. Immunology 2009, 127:429-441.
7. Durbin BP, Hardin JS, Hawkins DM, Rocke DM: A variance-stabilizing transformation for gene-expression microarray data. Bioinformatics
2002, 18(Suppl 1):S105-S110.
8. Kroll TC, Wolfl S: Ranking: a closer look on globalisation methods for normalisation of gene expression arrays. Nucleic Acids Res 2002, 30:e50. 9. Dabney AR, Storey JD: Normalization of two-channel microarrays
accounting for experimental design and intensity-dependent relationships. Genome Biol 2007, 8:R44.
10. Dabney AR, Storey JD: A new approach to intensity-dependent normalization of two-channel microarrays. Biostatistics 2007, 8:128-139. 11. Fan J, Niu Y: Selection and validation of normalization methods for
c-DNA microarrays using within-array replications. Bioinformatics 2007, 23:2391-2398.
12. Wang D, Zhang CH, Soares MB, Huang J: Systematic approaches for incorporating control spots and data quality information to improve normalization of cDNA microarray data. J Biopharm Stat 2007, 17:415-431.
13. Patterson TA, Lobenhofer EK, Fulmer-Smentek SB, Collins PJ, Chu TM, Bao W, Fang H, Kawasaki ES, Hager J, Tikhonova IR, Walker SJ, Zhang L, Hurban P, de Longueville F, Fuscoe JC, Tong W, Shi L, Wolfinger RD: Performance comparison of one-color and two-color platforms within the MicroArray Quality Control (MAQC) project. Nat Biotechnol 2006, 24:1140-1150.
14. Johnson WE, Li C, Rabinovic A: Adjusting batch effects in microarray expression data using empirical Bayes methods. Biostatistics 2007, 8:118-127.
15. Sultan M, Schulz MH, Richard H, Magen A, Klingenhoff A, Scherf M, Seifert M, Borodina T, Soldatov A, Parkhomchuk D, Schmidt D, O'Keeffe S, Haas S, Vingron M, Lehrach H, Yaspo ML: A global view of gene activity and alternative splicing by deep sequencing of the human transcriptome.
Science 2008, 321:956-960.
16. 't Hoen PA, Ariyurek Y, Thygesen HH, Vreugdenhil E, Vossen RH, de Menezes RX, Boer JM, van Ommen GJ, den Dunnen JT: Deep sequencing-based expression analysis shows major advances in robustness, resolution and inter-lab portability over five microarray platforms.
Nucleic Acids Res 2008, 36:e141.
17. Birney E, et al.: Identification and analysis of functional elements in 1% of the human genome by the ENCODE pilot project. Nature 2007, 447:799-816.
18. Noursadeghi M, Tsang J, Miller RF, Straschewski S, Kellam P, Chain BM, Katz DR: Genome-wide innate immune responses in HIV-1-infected macrophages are preserved despite attenuation of the NF-kappa B activation pathway. J Immunol 2009, 182:319-328.
19. Rasaiyaah J, Noursadeghi M, Kellam P, Chain B: Transcriptional and functional defects of dendritic cells derived from the MUTZ-3 leukaemia line. Immunology 2009, 127:429-441.
20. Hampton CR, Bowen HC, Broadley MR, Hammond JP, Mead A, Payne KA, Pritchard J, White PJ: Cesium toxicity in Arabidopsis. Plant Physiol 2004, 136:3824-3837.
21. Hammond JP, Bowen HC, White PJ, Mills V, Pyke KA, Baker AJ, Whiting SN, May ST, Broadley MR: A comparison of the Thlaspi caerulescens and Thlaspi arvense shoot transcriptomes. New Phytol 2006, 170:239-260.
doi: 10.1186/1471-2105-11-344