26 JANUARY 2015
OPTIMIZATION OF
TEMPERATURES IN A
CONDENSING CO
2
TO
METHANOL REACTOR
JORRIT KROES
FACULTY OF SCIENCE AND TECHNOLOGY
CHEMICAL ENGINEERING
SUSTAINABLE PROCESS TECHNOLOGY
EXAMINATION COMMITTEE
PROF. DR. A.J.A. WINNUBST
DR. IR. D.W.F. BRILMAN
2
Abstract
In this study, the effect of the catalyst temperature on the productivity, as well as the energy effi-ciency under natural and low forced convection, in a condensing CO2 to methanol reactor, is
3
Table of contents
Abstract ...2
1. Introduction ...4
2. Literature review ...5
2.1. Industrial methanol production ...5
2.2. Catalytic hydrogenation of carbon dioxide ...6
2.3. Reactor design ...7
2.4. Catalyst degradation ...7
2.5. Comparison of CO and CO2 based reaction kinetics ... 11
3. Reactor model... 16
3.1. Catalyst bed... 16
3.2. Condenser ... 18
3.3. Addition feed gas to recycle gas stream ... 18
3.4. Sensitivity studies ... 19
4. Experimental ... 22
4.1. Experimental setup ... 22
4.2. Catalyst activation ... 23
4.3. Operation ... 23
4.4. Measurements ... 24
5. Results and discussion ... 25
5.1. Productivity ... 25
5.1.1. Temperature of the cooling water... 26
5.1.2. Fan speed ... 27
5.1.3. Condenser temperature ... 28
5.1.4. Startup effect of the catalyst ... 29
5.2. Energy efficiency ... 30
5.3. Comparison model with experimental results ... 32
6. Recommendation ... 35
7. Conclusion ... 36
8. References ... 37
9. Appendix ... 39
4
1.
Introduction
The fossil fuel reserves on earth are finite and strongly decreasing due to intensive consumption [1, 2]. In addition to that, the remaining reserves become harder to exploit and thereby increasing the costs of fossil fuel. However, most of the electricity today is still generated by burning fossil fuels. The combustion of fossil fuel releases carbon dioxide (CO2) [2]. CO2 is a major greenhouse gas and is a
harmful contamination of the atmosphere that causes global warming. This is why more and more electricity is produced in a sustainable way, for example by solar, wind and geothermal energy [1]. An occurring problem of electricity is that the transportation and storage is difficult. Next to this, the ratio of supply and demand of electricity is not in balance at certain times on a day and during the seasons in a year [2]. Therefore, a suitable storage medium is needed in which electricity can be stored. One of the potential storage media is methanol (CH3OH) [1].
Methanol is a liquid and can easily be stored in tanks and transported by trucks, ships and pipelines [3]. Moreover, methanol can be entirely produced in a sustainable way. The electricity from renewa-ble sources [4] which is not consumed in the electricity grid can be used for the electrolyses of water to produce hydrogen (H2). The hydrogen can be converted with CO2 in a catalyzed direct
hydrogena-tion reachydrogena-tion to methanol [2]. The advantage of methanol is its versatility. It can be easily converted back to electricity by a direct methanol fuel cell (DMFC) or combustion, used as a replacement for gasoline and upgraded into a diesel substituent (DME). It is also an important feedstock for other chemical products as formaldehyde, methyl tert-butyl ether (MTBE), acetic acid, methyl methacrylate (MMA) and dimethyl terephthalate (DMT) [3, 5].Light olefins such as ethylene and propylene, which are used for the manufacturing of polymers and hydrocarbon fuels, are produced using the metha-nol-to-olefins (MTO) process[6].
A new reactor setup has been developed for the catalytic direct hydrogenation reaction. The reactor consists of two temperature zones: one zone with high temperature for production of methanol from the gaseous reactants and another zone with a lower temperature for condensation of the vapor products. The reactor operates in a so called Gas-In, Liquid-Out mode of operation because only liq-uid phase products are removed from the reactor [7]. Current research on this new rector concept focuses on understanding the system and finding the operational limitations and the optimal reac-tion condireac-tions. This is why addireac-tional experimental research is needed on the optimum temperature levels inside the reactor in order to find the optimal reaction temperature.
To find the optimal reaction temperature, the temperature effect on the reactor productivity is stud-ied at constant low condenser temperature and constant low fan speed. In order to investigate to what extent the outcome of the temperature effect holds for gas circulation under natural convec-tion condiconvec-tions, the fan is turned off and the study is repeated under the same condiconvec-tions. The exper-imental results are then compared with an equilibrium based reactor model. Due to the fact that renewable electricity is stored in methanol the energy efficiency of this reactor plays also an im-portant role. The research question for this bachelor assignment is therefore:
5
2.
Literature review
In this chapter an overview of the literature for the production of methanol is given. First, the current industrial methanol production from syngas is introduced, followed by an alternative production route, the catalytic hydrogenation of carbon dioxide with hydrogen. Then, occurring problems with respect to thermodynamic equilibrium and catalyst degradation are discussed. In that regard, a new reactor set up is introduced as a solution to shift the thermodynamic equilibrium. This chapter ends with a comparison of CO2 and CO based reaction kinetics for the methanol production.
2.1.
Industrial methanol production
Currently, methanol is industrially produced from fossil fuel based syngas. Syngas is a mixture of hy-drogen and carbon monoxide (CO), as well as CO2 produced from partial combustion of coal or steam
reforming of natural gas over a heterogeneous catalyst [1, 3, 5]. Especially the production of syngas from coal generates large amounts of CO2 as a byproduct which causes environmental problems
be-cause CO2 is a significant greenhouse gas and is considered as a harmful pollutant of our atmosphere
and a major source for human caused global warming. Because of this problem, the major source for syngas production became natural gas which is more convenient, economic, and environmentally friendly to use [1]. Today, steam reforming is the technology most widely used to produce syngas from natural gas (equation 1). The combination of methane steam reforming with partial oxidation (equation 2) is called autothermal reforming and is also widely used in processes [1, 3, 5]. A third process called dry reforming (equation 3) is also used to produce syngas however in a lesser extent than the first two options [1].
(1)
(2)
(3)
Alternatively, syngas can be produced from CO2 and water (H2O). Since the amount of oxygen in
methanol is lower than in the sum of the amount of oxygen in H2O and CO2, oxygen has to be
re-moved somewhere in the process. This can be achieved in three ways: by deoxygenation of CO2
(equation 4), by deoxygenation of H2O (equation 5) and by deoxygenation of both components [7].
H298K = 283 kJ/mole (4)
H298K = 286 kJ/mole (5)
The minimum required energy to remove oxygen from either CO2 or water is the enthalpy of the
re-action. This energy is equal for both reactions, as can be seen in equations 4 and 5. However, it is experimentally proven that the conversion of CO2 to CO has a low efficiency with the current state of
technology, whereas the required hydrogen can be produced with high efficiency via electrolysis [4].
By adjusting the CO:H2 ratio close to 1:2 the syngas can be converted into methanol (equation 6).
Present processes use copper (Cu)/zinc oxide (ZnO) based catalysts which are extremely active and selective in heterogeneous gas phase processes [1, 3, 5].
6 By current industrial technology a one pass a carbon conversion of only 50% to 80% can be achieved, depending on the synthesis gas composition and the selected process. Therefore, after methanol and water are condensed and removed, the remaining gas must be recycled to the reactor. The exother-mic formation of methanol takes place in the reactor at 473 – 573K and pressures of 100 – 250bar [3, 5]. The chemical equilibrium yield at different pressures is shown in Figure 1.
Figure 1: Chemical equilibria in methanol synthesis from syngas at different pressures. Syngas feed: H2/CO/CO2 75.9/16.9/7.2 [7].
2.2.
Catalytic hydrogenation of carbon dioxide
A simple, alternative way to produce methanol is the direct catalytic hydrogenation of CO2 with
hy-drogen (equation 7). This reaction has been recognized as one of the most promising process to sta-bilize the atmospheric content of carbon dioxide because of a large demand for methanol as fuel and basic chemical [1]. Both homogeneous and heterogeneous catalysts have been studied for the hy-drogenation of CO2. With respect to cost, stability, separation, handling and reuse of the catalyst, as
well as reactor design, a heterogeneous catalyst is favored [2]. The main products of the hydrogena-tion reachydrogena-tion are methanol, CO and water, as can be seen in the equahydrogena-tions 7 and 8 below [7].
H298K = -49.2 kJ/mole (7)
H298K = 41.6 kJ/mole (8)
Efficient catalysts based on metals and their oxides have been developed for this reaction. It has been shown that Cu/ZnO based catalysts are the most useful systems for the catalytic hydrogenation of CO2 to methanol [8]. In order to increase the stability and the activity of the catalyst aluminum
oxide (Al2O3) is used as the promoter to disperse the Cu and ZnO [8]. Because the catalyst is similar as
7 Figure 2: Chemical equilibria in methanol synthesis from CO2 at different pressures. CO2 feed: H2/CO/CO2 75.0/0/25.0 [7].
2.3.
Reactor design
The direct hydrogenation reaction introduced in the previous chapter discloses one problem: The equilibrium conversion of the CO2 /H2 mixture is low, as can be seen in Figure 2. To solve this
prob-lem, a new reactor set up has been developed. This reactor has two temperature zones: a high and a low temperature zone, to shift the chemical equilibrium to the product side by product vapor con-densation. In the high temperature zone, the catalyst operates and the reactants are converted in the gas phase. In the low temperature zone, the temperature is lowered below the dew point tem-perature of the products to condensate them in-situ. In this setup, the cold temtem-perature zone (con-denser) is placed on top of the hot temperature zone (catalyst) to benefit from natural convection flow. However, a fan is installed in order to ensure optimal reactor performance.
The reactor operates in a Gas-In, Liquid-Out mode because only products in the liquid phase are re-moved from the reactor. This secures that, full conversion of the gas phase reactants, H2 and CO2, to
the liquid phase products, methanol and water can be achieved. Due to this full gas conversion there is no need for an external recycle of reactants. Furthermore, this concept eliminates possible carbon selectivity loss to CO in the reaction zone because CO will not leave the reactor as long as it is in the gas phase [7].
The condenser performance improves when the condenser temperature is lowered. Calculations have shown that a low condenser temperature increases the single-pass conversion [7]. The optimal reaction temperature is a balance between, on the one hand, the more optimal thermodynamic equilibrium at low temperature, since the reaction is exothermic, and on the other hand, faster ki-netics at high temperature because the reaction rate constant is high this way [9].
2.4.
Catalyst degradation
Copper based catalysts are sensitive to deactivation factors like temperature and poisoning. The Cu/ZnO/Al2O3 catalyst can operate in the temperature range from 473K to 573K as mentioned earlier.
8 poisonous sulfur and halide components are effectively removed in feed pretreatment [3, 10]. Nev-ertheless, water has an influence on the performance of the catalyst.
As mentioned in chapter 2.2., an equivalent amount of water is produced during the hydrogenation of CO2 (equation 7) [8]. A third of the H2 is converted into water, which is much higher than that
con-verted during the industrial production of methanol from syngas [6]. The produced water has a cru-cial effect on the activity and performance of the catalyst. Due to strong competitive adsorption, water occupies and blocks the active sites on the catalyst surface area causing fewer sites for CO2 to
bond. Furthermore, it is known that water is a strong oxidant for metals as Cu [8]. For this reason, the active sites of the Cu/ZnO/Al2O3 catalyst are oxidized and consequently, it loses its activity. The
oxidized Cu sites can be reduced back by hydrogen or CO gas. However, when the reduction rate is too low, which means that the partial pressure of water is higher than the partial pressures of hydro-gen and CO, most of the active sites remain oxidized so that the activity of the catalyst is lost [8].
Wu et al. [11] studied the stability of Cu/ZnO based catalysts in the methanol synthesis from a CO2
and CO rich feed respectively. At a CO rich feed no significant water is formed, as is shown in Figure 3. This is consistent with equation 6. However, when the amount of CO2 in the feed is increased,
[image:8.595.174.431.384.569.2]wa-ter is formed as expected by equation 7. The formed wawa-ter accelerates the crystallization of Cu and ZnO in the catalyst which leads to faster sintering and associated deactivation of the catalyst surface [2, 6, 11].
Figure 3: Yields of methanol / water and heat released at equilibrium in methanol synthesis as a function of CO2 concen-tration in the feed gas [11].
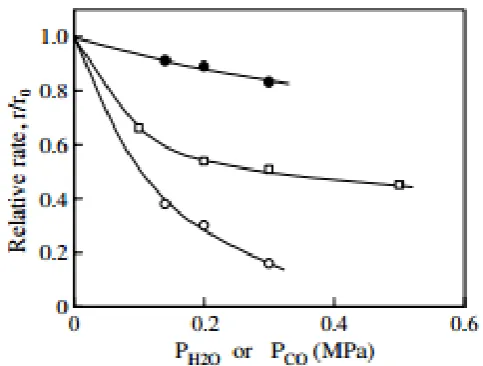
This inhibitory effect of water on the methanol synthesis was also observed by Saito et al. [12]. The presence of water in the reactor suppressed the methanol synthesis over Cu/ZnO based catalysts, resulting in a lower methanol yield and relative reaction rate [12], as can be seen in Figure 3 and Figure 4 respectively. In Figure 4, r0 and r represents the rates of methanol synthesis or CO formation without (pure CO2) and with the addition of H2O or CO respectively [12]. It can be seen that the
rela-tive reaction rate of methanol decreases with increasing water partial pressure.
Saito et al. [12] studied also the activity of Cu/ZnO based catalyst on different support materials as Al2O3, ZrO2 and SiO2 for the methanol synthesis from CO2 and H2. They found thatmulti-component
catalysts as Cu/ZnO/ZrO2/Al2O3 and Cu/ZnO/ZrO2/Al2O3/Ga2O3 are more active and stable than bi- or
Further-9 more, Wu et al. [11] found that the addition of a small amount of colloidal silica to the multi-component catalysts vastly improved the long-term stability.
Figure 4: Inhibitory effects of H2O (o) and CO (□) on methanol synthesis and of H2O (•) on CO formation from CO2(25%)/H2(75%) mixture over a Cu/ZnO/ZrO2 catalyst at 523 K [12].
Li et al. [8] investigated the performance and influence of water on three different Cu/ZnO based catalysts, namely, Cu/ZnO/ZrO2/Al2O3 (CZZA), Cu/ZnO/ZrO2 (CZZ) and Cu/ZnO/Al2O3 (CZA). The
exper-imental results are shown in Figure 5. When no water is added, it can be seen that the conversion of CO2 and the methanol yield is higher on the CZZA catalyst compared to the CZA and CZZ catalysts.
The selectivity of methanol on CZZA is 17.3% higher than that on CZA and 11.7% higher than that on CZZ [8].
To investigate the influence of water on the catalysts, water is added in the feed stream. As the amount of water is increased, the conversion of CO2 and methanol yield decreases, as can be seen in
Figure 5. From this figure it also follows that the CZZA catalyst is proved to be the most resistant against the influence of water and that the suppressive effect of water is most remarkable for CZA.
ZrO2 has thus a promotional effect on the catalyst performance. It promotes the catalytic activity of
methanol synthesis from CO2 and suppresses the inhibitive effect of water for the reaction as well as
the catalyst deactivation [8]. Furthermore, it is noted that the catalytic activity of Al2O3-ZrO2
promot-ed catalysts show better catalytic properties than the catalyst supportpromot-ed on either Al2O3 or ZrO2
alone. This is due to higher Cu dispersion in the Al2O3-ZrO2 promoted catalyst, resulting in a larger
reactive surface area and therefore, a higher activity [8, 13].
Because of the forward and reverse water gas shift reaction (equation 8), which takes place in the presence of the Cu/ZnO based catalyst, it is difficult to separate the roles of water and CO2 for the
reaction to methanol, as can be seen in the equations 7 and 8 in chapter 2.2.
As described above, the effect of water on catalyst degradation is being discussed in literature. On the one hand, water has a degradation effect on the catalyst due to the fact that an increase in water concentration decreases the methanol reaction rate and CO2 conversion because water blocks active
10 increase of the CO2 amount in the reactor which leads to an increase in the methanol reaction rate,
[image:10.595.161.437.142.647.2]even under the case of serious deactivation [8].
11
2.5.
Comparison of CO and CO
2based reaction kinetics
As discussed in the previous chapters, methanol can be produced from syngas (equation 6) and via catalytic direct hydrogenation (equation 7). Both reactions are exothermic and are affected by the water gas shift reaction (equation 8). Due to the exothermic character and the decrease of the num-ber of moles during these reactions, the equilibrium is more favorable at high pressure and low tem-perature [7]. The calculated equilibrium methanol yield of syngas is significantly higher than of CO2
based feed systems, as shown in Figure 1 and Figure 2 [7].
Lee et al. [14] have studied the methanol syntheses from a CO2/H2 and CO/H2 feed over a
Cu/ZnO/Al2O3 catalyst and compared the experimental results of the pure feeds with each other and
with CO/CO2/H2 feed mixtures with a varying CO/CO2 ratio and a fixed amount of hydrogen of
80mole%. Whereas the thermodynamic equilibrium yields are decreasing with increasing tempera-ture, the found experimental kinetic methanol yields show a maximum for both cases, as can be seen in Figure 6. In this figure, the equilibrium and experimental kinetic methanol yields depending on temperature are shown. In contrast to the calculated equilibrium yields, the experimental kinetic yields for the CO2 based reaction are higher than the CO based one for temperatures below 573K
[14]. It is striking that the methanol yield at temperatures below 523K is one order in magnitude higher for a CO2/H2 than a CO/H2 feed. The methanol yields decrease above 648K, with increasing the
[image:11.595.199.387.395.576.2]temperature because the product composition shifts from methanol rich to CO rich mixtures. There-by, the carbon conversion to methanol is decreased [9].
Figure 6: Calculated equilibrium and experimental kinetic methanol yields for CO/H2 and CO2/H2 depending on tempera-ture [14].
Space velocity is also an important factor that affects the methanol synthesis kinetics [10]. The space velocity is the quotient of the entering volumetric flow rate of the reactants divided by the reactor volume and reflects the reactor efficiency. In this case, the reactor volume is the catalyst bed vol-ume. It indicates how many reactor volumes of feed can be treated in a unit of time. A higher space velocity thus means a shorter residence time [15]. Therefore, an increase in space velocity can de-crease the rate of conversion.
An et al. [15] and Li et al. [8] investigated the effect of space velocity on the conversion of CO2 and
methanol yield of a CO2/H2 mixture with a ratio of 3. They found out that the CO2 conversion and
12 decrease in CO2 conversion. The rate of reverse water gas shift reaction is much faster than the
methanol synthesis reaction, so that a higher space velocity had less effect on the reverse water shift reaction than on the methanol synthesis. Therefore, the methanol yield decreases [8, 16].
Lee et al. [14] and Sahibzada et al. [16] observed that the space velocity has a different effect on the CO and CO2 based reactions. Figure 7 shows these differences. In the CO based reaction, the CO
con-version decreases rapidly with increasing space velocity while the methanol selectivity remains un-changed. In the CO2 based reaction, the CO2 conversion decreases much slower and the methanol
selectivity increases due to the rapid decrease of CO [14]. At high space velocity, methanol produc-tion is greater with the CO2/H2 based reaction because the methanol production rate is greater than
the CO production rate. However, at lower space velocity, methanol production is greater with CO/H2
based reaction because the selectivity in the CO2/H2 based reaction switched in favor of CO. At even
[image:12.595.196.400.280.467.2]lower space velocity, CO production approaches equilibrium [16].
Figure 7: Effect of space velocity on carbon conversion and methanol selectivity from CO2/H2 (o,•) and CO/H2 (△,♦)[14].
As discussed earlier, methanol is industrially produced from syngas. Syngas is a mixture of CO, CO2
and H2. Zhang et al. [17] discovered that both methanol production rates, of the CO and CO2 based
reactions, are much lower than the rate of syngas with a composition of CO/CO2/H2 mixture of
20.5/5/74.5, as can be seen in Figure 8.
Sahibzada et al. [16] and Lee et al. [14] both studied the effect on the reaction rate of the CO2
con-centration in the syngas. Whereas Sahibzada only studied the effects at low space velocity, Lee stud-ied the effects at both, low and high, space velocities. Regarding low space velocity, both reached the same results. Figure 9 shows the methanol yield dependent on CO2 concentration. At low space
ve-locity, the methanol yield sharply increases with a small increase in CO2 concentration, until it
reached a maximum at 2-5% CO2. A further increase in CO2 concentration decreases the methanol
production. At high space velocities, the methanol yield increases almost linearly with CO2
concentra-tion. It is notable that the higher the space velocity, the lower is the methanol yield is. The concen-tration of CO2 in the syngas mixture has thus a determining role. High concentrations of CO2 push the
13 Figure 8: Methanol synthesis rate for CO/H2, CO2/H2 and CO (20.5)/CO2 (5)/H2 (74.5) [17].
Figure 9: Methanol yields depending on CO2 concentration at different space velocities [14].
Furthermore, the amount of water increases with increasing CO2 concentration, as discussed in the
previous chapter, leading to inhibition of the CO2 hydrogenation. Nevertheless, operating at pure CO
conditions does not result in high methanol yields either due to kinetic reasons. In order to reach a maximum conversion, an amount of CO2 related to the ratio (H2−CO2):(CO+CO2) ≈ 2 is crucial in the
feed [18]. Whereas the promotional effect of CO2 is related to the water gas shift reaction, the
deac-tivation at higher concentrations of CO2 is related to the oxygen surface coverage, resulting in a
de-crease in Cu dispersion which is harmful for the CO2 hydrogenation [14, 18].
Since research on the methanol synthesis from hydrogenation of CO2 is performed under unequal
conditions, such as different reactor set-ups and catalysts, there are no general reaction rate equa-tions available. Most kinetic data is obtained from activity measurements. The reaction constants are determined with the data obtained from such activity measurements. However, it is important to set up kinetic equations for CO2 hydrogenation in order to develop a high-efficiency reactor for methanol
synthesis from CO2 and hydrogen. Although many kinetic mechanisms have been suggested for the
[image:13.595.207.394.303.488.2]14 kinetic mechanism for process simulations is that of Graaf et al. [3] and is also used in the studies of Lim et al. [13] and Rahimpour et al. [20].
Graaf et al. considered both the hydrogenation of CO (equation 6), CO2 (equation 7) and the water
gas shift reaction (equation 8) and proposed a dual site mechanism, with CO and CO2 adsorbing on a
s1 type site and H2 and water adsorbing on a s2 type site [13]. The methanol production from CO and
CO2 occurs via consecutive hydrogenations, while the water gas shift reaction proceeds along a
formate route. Assuming adsorption and desorption to be in equilibrium, and taking every elemen-tary step in each of the three overall reactions in turn as rate determining, Graaf et al. examined 48 possible models [13]. In order to reach the final set of kinetics, Graaf et al. used statistical discrimina-tion [21].
The resulting reaction rate equations can be seen in equations 9 – 11.
)
)
) (9)
)
) ) (10)
)
)
) (11)
In these rate equations, KP1,KP2 and KP3are the following pseudo equilibrium constants,
) (12)
) (13)
) (14)
KCO, KCO2and KH2O/KH20.5 are the adsorption equilibrium constants of CO, CO2, H2O and H2,
) ) (15)
) ) (16)
, )
) (17)
and k1, k2, and k3 are the rate constants of each individual reaction determined by Graaf et al. [22].
)
) (18)
) ) (19)
)
15 The fugacity f of the components in the gas phase is calculated from the fugacity coefficients which can be obtained from the modified Soave-Redlich-Kwong (mSRK) equation of state (equation 21) for the three reactions [23].
)
) (21)
In literature, the reaction kinetics of the methanol synthesis from CO2 and CO as well as syngas based
16
3.
Reactor model
[image:16.595.109.485.207.296.2]A kinetic model over the catalyst bed and a phase equilibrium model for the condenser of the exper-imental reactor setup are being developed in order to predict at which catalyst temperature the productivity is the highest at a specific fixed condenser outlet temperature. The block scheme of this model is presented in Figure 10. In this chapter the model will be described.
Figure 10: Block scheme of the model
3.1.
Catalyst bed
The model is based on the steady state mass balance of the components over the catalyst bed. In order to simplify the model the following assumptions have been made: Firstly, the temperature and pressure are constant over the catalyst bed as well as in the catalyst pallet. Furthermore, it is as-sumed that the mass flow over the catalyst bed is constant. Secondly, catalyst deactivation and side reactions to higher alcohols and simple carboxylic acids are neglected. With these assumptions the general the mass balance over the catalyst bed is defined as: Accumulation = in - out + production. From this definition the following general equation is derived:
) ) (22)
In this equation m denotes the mass of component j, ϕm the mass flow through the catalyst bed, w
the weight fraction of component j, R the reaction rate equation of component j, M the molar mass of component j and Vr the reactor volume. Since the weight fractions of the components vary over the length of the catalyst bed, a differential mass balance is needed. In the differential equation the volume of the reactor, Vr is expressed as Ar*dz. Herein, Ar denotes the cross section area of the cata-lyst bed and dz the length of the catalyst bed. The resulting differential mass equation is as follows:
) ) ) (23)
Since the reactor operates at steady state, there is no accumulation of mass in the reactor. From this it follows that dmj/dt=0:
) ) ) (24)
Dividing by dz and taking the limit of dz→0 leads to the following equation:
) (25)
catalyst bed condenser
liquid out feed gas in
17 The mass flow over the catalyst bed is independent of changes in the weight fractions of the compo-nents. Hence, it can be put out of the differential equation:
(26)
Rewriting this equation results in the final differential mass equation for component j:
(27)
It has been shown in the literature review that three reactions are involved in the production of methanol. Methanol is produced from syngas (equation 6) and by catalytic hydrogenation of CO2
(equation 7). During the catalytic hydrogenation the reverse water gas shift reaction (equation 8) occurs as a side reaction. In these three reactions five components are present, namely CO, CO2,
MeOH, H2 and H2O. Therefore, five differential equations are needed to calculate the weight
frac-tions of the components at the end of the catalyst bed. The differential equafrac-tions for the five com-ponents are listed below:
) (28)
) (29)
) (30)
) (31)
) (32)
The factor Vcat in the differential mass equations is needed to equalize the dimensions on both sides of the equation. Vcat is defined as ρcat*(1- εb ). Herein, ρcat is the density and εb the bed voidage of the catalyst respectively [24]. The used catalyst has a density of 1750kg/m3 and a bed voidage of 0,4, accordingly Vcat is 1050kg/m3. The catalyst section of the reactor has an inner diameter of 24mm and an outer diameter of 48mm [7]. Consequently the cross section area of the catalyst section is 0.0014m2.
In these differential equations r denotes the reaction rate equations of the three occurring reactions developed by Graaf et al. [21], as described in the literature review by equations 9 - 11. To calculate these differential equations, the fugacity f for each component in the gas phase has to be calculated from the mSRK equation of state. Therefore the mSRK equation of state (equation 21) can be rewrit-ten to [23]:
) (33)
18
) ) )
(34)
Secondly, the fugacity of each component can be calculated with equation 35. In this equation yiis the mole fraction of the component:
(35)
The equations above are solved with the MATLAB function mSRK_EoS.m written by Martin Bos. With the calculated fugacity of the components in the gas phase, the five differential mass equations can be solved numerically. The ode15s solver in MATLAB R2014b is used to solve the differential equa-tions over the known catalyst bed length of 72mm. The following the initial condiequa-tions are used: Since only H2 and CO2 are fed to the reactor, the initial weight fractions are: 0% CO, 25% CO2, 0%
MeOH, 75% H2 and 0% H2O. The pressure inside the reactor is 50bar and the desired catalyst
tem-perature and mass flow can be filled in manually.
3.2.
Condenser
The catalyst out composition is used to calculate an equilibrium flash in the condenser at a defined condenser temperature. It is assumed that the temperature is constant in the condenser. To calcu-late the equilibrium liquid and vapor mole fractions, the following equation has to be solved:
(36)
In this equation, ϕiL and xi are the fugacity coefficients and mole fractions in the liquid and ϕiG and yi
the fugacity coefficients and mole fractions in the vapor phase. Therefore, the weight fractions have to be converted into mole fractions. The equation is solved with the MATLAB function Fun_FlashPT.m written by Martin Bos. This function is used to do a flash calculation with respect to the phase equilibrium using the fmincon.m solver in MATLAB. In addition to the vapor mole fractions leaving the catalyst bed, this function needs two starting vectors of an approximation of the vapor and liquid mole fractions of the components after the flash and a defined vapor fraction as input. The function fmincon.m is used to find the minimum of the function Fun_FlashPT.m The resulting output represents the equilibrium liquid and vapor mole fractions after the flash at a given pressure and condenser temperature.
3.3.
Addition feed gas to recycle gas stream
It has to be noted that the reactor operates in a gas in liquid out operation mode, as has been de-scribed in the literature review. In order to maintain a steady state of mass inside the reactor, the amount of mass that is leaving the reactor as liquid, the product condensate, has to be replaced by an equal amount of mass by the feed gas.
From the resulting liquid equilibrium mole fractions calculated by the condenser model, the mass of the liquid leaving the reactor is determined and the same amount of gas has to be added. The re-maining vapor is internally recycled and is fed together with the amount of added feed gas to the catalyst bed as can be seen in Figure 10. This cycle is repeated until the mass flow over the reactor is constant and the reactor approaches steady state.
ap-19 proximation of the gas circulation inside the reactor. The results of this model are presented and discussed in the sensitivity studies in the next paragraph. In chapter 5 the sensitivity studies are compared with the experimental results.
3.4.
Sensitivity studies
From the performed experiments in this study it is known that when the experiments are performed under natural and low forced convection, the pressure drop over the catalyst bed is too low to be measured. Therefore, it is not possible to calculate the gas circulation rate inside the reactor and thereby the mass flow over the catalyst bed, which is required for the model.
The manufacturer of the catalyst advises a gas hourly space velocity (GHSV) of 3000/h for the optimal operation of the catalyst. Converted to mass flow and the used amount of catalyst, this results in a mass flow of 5*10-5kg/s.
This value is used together with the catalyst temperatures of 473 - 523K, a condenser temperature of 373K, a reactor pressure of 50bar and a feed gas composition of 25% CO2 and 75% H2 as initial
condi-tions in the model to calculate the productivity at the corresponding catalyst out temperature.
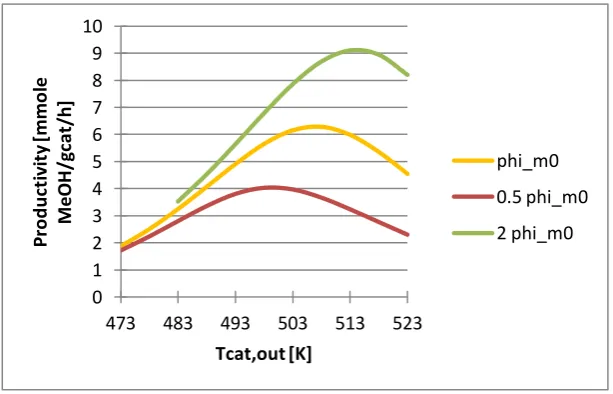
[image:19.595.145.452.383.580.2]The resulting productivities of this model calculation are presented in Figure 11. Since the mass flow in the reactor is unknown, the effect of the mass flow is investigated by calculating the productivity with a factor 0.5 and 2 of the initial mass flow.
Figure 11: Effect of the mass flow on the productivity
It can be seen in the figure that the productivity increases with increasing mass flow and the maxi-mum in productivity shifts to a higher catalyst out temperature. An increase in mass flow results in a shorter residence time. Therefore, more product is formed and the productivity increases, as long as the kinetics can keep up with the increased mass flow. The effect of the mass flow on the productivi-ty is small at low catalyst out temperature. At high catalyst out temperature, however, the reaction kinetics increase and the reaction approaches the chemical equilibrium productivity.
Next to the mass flow, the used reaction kinetics developed by Graaf et al. (equations 9 – 11) may not match the kinetics in the reactor set up. The reaction rates were developed almost 20 years ago and overtime the catalyst for this reaction has been improved and further developed, so that the reaction kinetics may have changed. Therefore, the effect of the reaction kinetics is investigated by
0 1 2 3 4 5 6 7 8 9 10
473 483 493 503 513 523
P
ro
d
u
ct
iv
it
y
[m
m
o
le
M
e
O
H
/gc
at
/h
]
Tcat,out [K]
phi_m0
0.5 phi_m0
20 calculating the productivities at the standard reaction rate and a factor 0.5 and 2 of the reaction rates. The results can be seen in Figure 12.
Figure 12: Effect of the reaction rates on the productivity
From the curves in this figure, it follows that an increase in reaction kinetics also results in an in-crease in productivity. However, the maximum in productivity is shifted to a lower catalyst out tem-perature. Whereas the effect on the productivity is higher at low catalyst out temperatures is higher, since more product is formed, at high catalyst out temperatures the productivity curves overlap each other, as a result of the fact that the reaction is limited by the chemical equilibrium.
Finally, also the influence of the condenser temperature on the productivity is investigated because it is known that the lower the condenser temperature, the higher the productivity is. The productivities for the condenser temperatures of 333K, 373K and 393K are calculated with advised mass flow and the reaction kinetics developed by Graaf et al. with the model and presented to the corresponding catalyst out temperature in Figure 13.
Figure 13: Effect of the condenser temperature on the productivity
0 1 2 3 4 5 6 7 8 9
473 483 493 503 513 523
P
ro
d
u
ct
iv
it
y
[m
m
o
le
M
eO
H
/gc
at
/h
]
Tcat,out [K]
Std
0.5 Std
2 Std
0 2 4 6 8 10 12 14
473 483 493 503 513 523
P
ro
d
u
ct
iv
it
y
[m
m
o
le
M
e
O
H
/gc
at
/h
]
Tcat,out [K]
Tcond 373K
Tcond 333K
[image:20.595.146.451.512.705.2]21 This figure shows the expected result: The lower the condenser temperature, the higher the produc-tivity. This is caused by the fact, that at a lower condenser temperature, a larger fraction of the prod-uct vapors condensates and thereby, the chemical equilibrium is shifted to the prodprod-ucts side. Again, the maximum is shifted to higher catalyst out temperatures due to the fact that the reaction rates increase with temperature.
22
4.
Experimental
In this chapter, first the experimental setup and the activation procedure for the catalyst are de-scribed. Then, the operation mode of the reactor setup is introduced, followed by how the meas-urements are being performed.
4.1.
Experimental setup
In this study the same reactor setup, feed gas and catalyst are being used as in the study of Bos [7]. A schematic overview of the reactor setup is given in Figure 14. The reactor consists of a catalyst sec-tion (b) at the bottom and a condenser secsec-tion (d) at the top. In order to maintain a constant pres-sure in the reactor, a buffer vessel (a) with a volume of 3,8L for the feed gas has been installed.
The feed gas can be fed to this buffer vessel to a maximum pressure of 100bar. The pressure in the buffer vessel is measured by a pressure indicator (PI-1) [GE Druck, Unik PTX-5072-TB-A1-CA-H1-PA, 0-100bar]. The pressure inside the reactor is regulated by a pressure reducer (PCV) between the buffer vessel and the reactor. The reactor pressure is measured by a pressure indicator (PI-2) [GE Druck, Unik PTX-5072-TB-A1-CA-H1-PA, 0-250bar].
This catalyst section (b) of the reactor has an inner diameter of 24mm and an outer diameter of 48mm. The length of this section is 72mm. The catalyst that has been used is a commercial Cu/ZnO/Al2O3 catalyst (CP-488) provided by Johnson Matthey. It is formed as cylindrical pallets with a
6mm diameter and 5mm length. These pallets are placed in the annular spacing.
The catalyst section is surrounded by a temperature controlled oven (h) [Eurotherm, 2132]. The cur-rent to the oven is measured by a curcur-rent indicator (CI-1) [Phoenix Contact, MACX MCR-SL-CAC-5-I-UP]. The gas temperature at the inlet (TI-3) and outlet (TI-2) of the catalyst section is measured by K-type thermocouples [B+B sensors]. A differential pressure indicator (dP-1) [GE Druck, LPM-9481] is installed to measure the pressure drop over this section. The reactor setup is located in a cold envi-ronment. In order to prevent condensation in the pressure lines to the pressure indicator, the lines are packed in a tracer.
A 38mm turbocharger fan (c) is installed in the bottom of the reactor to ensure gas circulation inside the reactor. It draws the recycle and feed gas from the top through the middle of the reactor to the bottom and pushes the gas up through the catalyst bed. The fan is powered by a 30W magnetic cou-pled motor (M) to ensure a gas-tide power transmission.
The top part of the reactor is the condenser section. The condenser (d) is placed in the inner part of this section. Basically, the condenser is a spiral shaped copper tubing. Through this tubing water is circulated. The temperature of the water is regulated by a water bath (g) [Julabo F34-HE]. The gas temperature of the condenser inlet (TI-5) and outlet (TI-4) are measured by K-type thermocouples [B+B sensors]. The water inlet (TI-7) and outlet temperature (TI-6) of the condenser is measured by K-type thermocouples [B+B sensors]. The water circulation flow is measured by a flow indicator [POM B.I.O-Tech Becker 52.01 in combination with Red Lion IFMA 0035].
23 Figure 14: Schematic overview of the reactor set-up: (a) buffer vessel, (b) catalyst section (annulus), (c) fan, (d) cooler, (e) liquid outlet, (f) purge, (g) water bath, (h) oven temperature controller, (TI) temperature indicator, (PI) pressure indica-tor, (CI) current indicaindica-tor, (dP) differential pressure indicaindica-tor, (FI) flow indicaindica-tor, (PCV) pressure control valve and (V) valve [7].
4.2.
Catalyst activation
The annular spacing at the bottom of the reactor is filled with the catalyst pallets and the catalyst is activated according to the procedure provided by the manufacturer. During the activation procedure the catalyst is reduced. This is achieved by first flushing the reactor with nitrogen (N2) 2L/min at a
catalyst out temperature of 433K and pressure of 2bar to remove oxygen (O2) and water. After
flush-ing, a small amount of hydrogen (H2) 0.2L/min is added and the nitrogen stream is increased to
3L/min. The addition of hydrogen causes an exothermic reaction, causing an increase in the catalyst out temperature, when the exotherm is passed, the catalyst out temperature decreases. The hydro-gen flow is increased to 0.5 L/min and nitrohydro-gen flow lowered to 2.5 L/min. After the exotherm passed again, the catalyst out temperature is set to 513K and the reactor is flushed continuously for 2 hours. Then the nitrogen flow is turned off and the reactor is cooled down and is stored under a reducing environment of pure hydrogen.
4.3.
Operation
Before an experiment, the buffer vessel is filled with feed gas from the gas bottle and the reactor is flushed with 8bar of feed gas. The feed gas for this experiment is pre-mixed mixture of 25% CO2 and
24 The catalyst outlet temperature is regulated by the temperature of the oven. The condenser is turned on and the condenser outlet temperature is controlled by the flow and by the temperature of the cooling water. For the experiments under forced convection, the fan is turned on and the speed is controlled by the supplied voltage. For experiments under natural convection, the fan is kept off.
The experiments are performed in a semi-continuous mode. This means a continuous amount of feed gas is fed from the buffer vessel to the reactor in order to maintain a constant reactor pressure. This is necessary because the pressure inside the reactor will decrease due to the reaction and the con-densation of water and methanol. In order to prevent overflow of the collection cup, the condensate is tapped from the reactor into the collection cup at every two bar of pressure drop in the buffer vessel. After having completed an experiment, the reactor is cooled down and depressurized to 2bar. The fan is turned on and the reactor is flushed with hydrogen for 10 minutes. After flushing, the purge is closed and the reactor is stored under a hydrogen pressure of 5bar, so that the catalyst is in a reducing environment to prevent oxidation.
4.4.
Measurements
Firstly, the experimental temperature limitation of the reactor set up has to be determined. Since the heat duty of the oven is limited, the maximum achievable catalyst out temperature by a constant condenser temperature of temperature 383K and constant pressure of 50bar is determined. Second-ly, the temperature of the condenser temperature is lowered to 373K in order to investigate whether the catalyst out temperature changes.
As the limitation is known, two series of experiments are being performed. In the first set of experi-ments, the catalyst out temperature varied between 473 and 523K within the experimental limita-tions of the reactor setup, whereas the condenser temperature and the fan speed are kept constant at 373K and 2V respectively to study the effects of the catalyst temperature under forced convection. In the second set of experiments, the fan is turned off and the experiment is repeated with the same catalyst out temperatures and condenser temperature to study the effect of the catalyst tempera-ture under natural convection. In both sets, the reactor pressure is kept constant at 50bar.
The productivity of the reactor is measured by the liquid production per unit of time. The productivi-ty is determined over a minimum of 5 condensate samples under stable temperature conditions. The composition of the liquid product is analyzed afterwards in IR absorption measurements. The calibra-tion curves of water and methanol are obtained by injecting pure water and methanol in the IR spec-trometer. The liquid product samples are compared to these curves.
The energy efficiency is defined by the energy output, the amount of energy which can be obtained from the produced methanol, divided by energy input, the energy which is used by the oven to heat the catalyst section of the reactor as can be seen in equation 37. To make the energy efficiency di-mensionless the quotient has to be multiplied by the mass of the catalyst.
25
5.
Results and discussion
The experimental results are presented in this chapter. All the raw data of the experiments including the set points are shown in Appendix A. It has to be noted that in this study only the effect of the catalyst out temperature on the productivity and the energy efficiency under natural and low forced convection (fan speed 2V) of the reactor setup is investigated. For both cases the reactor pressure is kept constant at 50bar and the condenser outlet gas temperature is regulated at 373K.
The influence of water on the used catalyst has not been studied in this study. The experiments were only performed with the in previous experiments used commercial Cu/ZnO/Al2O3 methanol catalyst
so that no comparison and statements on the difference in activity and stability in the presence of water on the catalysts introduced in the literature can be made.
To determine the experimental maximal achievable catalyst out temperature, the oven was set to the maximum temperature of 643K and the outlet of the condenser to 383K. At stable conditions, the maximal achievable catalyst out temperature is 522K. Changing the temperature of the conden-ser to 373K resulted in a maximal achievable catalyst out temperature of 518K. From these results it follows that experiments can be performed up to a catalyst out temperature of 518K.
First, the productivity and energy efficiency of the reactor setup is determined from the performed experiments. Then, the experimental productivity results are compared to the results of the reactor model.
5.1.
Productivity
As discussed in the literature review, the productivity is higher at lower condenser temperature. This is why the measurements were performed at a condenser outlet temperature of 373K. The goal of these experiments is to investigate the effect of the catalyst temperature on the productivity and energy efficiency under natural and forced convection. Since the catalyst out temperature is regulat-ed by the oven, the productivity is determinregulat-ed at the catalyst out temperature. The productivity is measured at the catalyst out temperatures in the range of 473 - 523K under a constant pressure of 50bar for both cases.
The productivity of the reactor is determined by calculating the slope of the plot from the liquid sample weights over time, for a minimum of five samples, under stable temperature conditions. The resulting productivities at the catalyst out temperatures from 473K to 523K under natural and forced convection are shown in Figure 15.
26 Figure 15: Measured productivities at Tcat,out with Tcond ≈ 373K
In order to find an explanation for this high productivity at a catalyst out temperature of 518K, the set points of the experiments are compared. It is seen that a lower water temperature and lower water flow rate for the condenser are used to maintain the condenser outlet temperature at 373K. Instead of a water temperature of around 333K, the water temperature was 316K during the experi-ment.
Besides that, the outlier occurred under forced convection. Previous research revealed that the fan speed has an effect on the productivity.
From the literature it is known that a lower condenser temperature leads to a higher productivity. Because of the fact that the temperature of the condenser is measured in the mixed gas phase at the condenser outlet, it is possible that the temperature inside the condenser is lower than the meas-ured temperature and therefore more product will condensate as expected.
Finally, it has to be noted that the experiment of the outlier productivity was the first experiment performed after the activation of the catalyst. The resulting high productivity may be caused by a startup effect of the catalyst. The influence of these factors on the productivity is discussed in the next paragraphs.
5.1.1. Temperature of the cooling water
The effect of the water temperature in the condenser on the productivity is investigated at a catalyst out temperature of 503K and a condenser outlet temperature of 373K. The productivity is measured at three different water temperatures: 316K, 326K and 330K.
The resulting productivities are presented in Figure 16 a).This figure shows a remarkable result. The literature, as discussed above, sets out that a lower condenser temperature results in a higher productivity. However, this figure shows a completely contrary result to the expectation raised by the literature: the productivity is lower at a lower water temperature.
In order to control the condenser out temperature, not only the water temperature can be varied but also the flow rate. At lower water temperatures, lower water flow rates are required to maintain the condenser outlet temperature at 373K as a constant cooler duty is needed. Hence, the water temperature alone does not have the ability to increase the productivity of almost 2,5mmole
3 4 5 6 7 8
473 483 493 503 513 523
P
ro
d
u
ct
iv
it
y
[m
m
o
le
M
eO
H
/gc
at
/h
]
Tcat,out [K]
With Fan 2V
27 MeOH/gcat/h. The water temperatures and the corresponding flow rates are used to calculate the cooler duties, which are the withdrawn energies of the gas stream. The corresponding cooler duties are presented in Figure 16 b). It is immediately apparent that the lower productivity at the lower water temperature is caused by a lower cooler duty. This leads to the conclusion that the tempera-ture of the cooling water did not caused the outlier productivity.
Figure 16: a) Productivity at the water temperature in the condenser b) Corresponding cooler duty at the water tempera-ture in the condenser. Both at a catalyst out temperatempera-ture of 503K and condenser outlet temperatempera-ture of 373K and a fan
speed of 2V
5.1.2. Fan speed
Another possible explanation for the outlier experiment is that the fan speed may be different than the expected 2V during the experiment. The fan may have faltered during the experiment. This as-sumption is based on the fact that the current on the fan control display had a constant value, whereas it alternated when the fan rotates. Based on Bos [7] research, it is known that at a fan speed of 1V the productivity is higher than at 2V. Bos measured the productivity at a catalyst out tempera-ture of 473K and a condenser outlet temperatempera-ture of 363K at different fan speeds. It has to be men-tioned that the measurements in this study were performed at different conditions. In this experi-ment, the catalyst out temperature was about 519K and the condenser outlet temperature of 373K.
In order to verify the hypotheses of a faltering fan, the effect of the fan speed on the productivity is investigated. The productivity is measured at fan speeds of 0V, 1V, 2V and 3V with the same set points as in the original measurement. The resulting productivities are presented in Figure 17. In this figure, the productivity against the fan speed of the original measurement is represented by the red point and the new measured productivities with blue points respectively.
In contrast to the results of Bos, this figure shows a maximum in productivity at a fan speed of 2V instead of 1V. Whereas the results of Bos show a sharp maximum between 0 and 3V, this curve is almost flat. Furthermore, the productivity at 0V and 1V is lower than at 2V. This means that when the fan faltered during the experiment, the productivity would have to be lower. Therefore, faltering of the fan cannot be the cause of the outlier in productivity.
4,75 5 5,25 5,5 5,75
313 318 323 328 333
P
ro
d
u
ct
iv
it
y
[m
m
o
le
M
eO
H
/gc
at
/h
]
A Twater [K]
240 250 260 270 280
313 318 323 328 333
C
o
o
le
r
D
u
ty
[W]
28 Figure 17: Productivity at fan speed with sp oven 643K, Twater 318K and flow 200 mL/min
5.1.3. Condenser temperature
As mentioned earlier, it is known that the lower the condenser temperature is, the higher the productivity is. Due of the fact that the temperature of the condenser is measured in the gas phase at the condenser outlet below the actual condenser it is possible that the temperature inside the condenser is actually lower than the measured temperature. Therefore, the effect of the condenser outlet temperature on the productivity is investigated.
The productivities are measured at three different condenser outlet temperatures, 363K, 373K and 383K at a catalyst out temperature of 516K under forced convection. The resulting productivities corresponding to the condenser outlet temperatures are represented in Figure 18. In this figure, the red point represents again the outlier measurement of the original experiment. Indeed, the blue points in this figure indicate that the lower the condenser outlet temperature, the higher the produc-tivity is. However, the increase in producproduc-tivity with a decrease in condenser outlet temperature is small. A decrease of 20K results in an increase of productivity of 1 mmole MeOH/gcat/h. Following this trend, the condenser outlet temperature has to be about 323K to reach a productivity of 7,5mmole MeOH/gcat/h.
Figure 18: Productivity at Tcond,out with sp oven 643K and fan 2V
4 5 6 7 8
0 1 2 3
P
ro
d
u
ct
iv
it
y
[mmo
le
M
eO
H
/g
ca
t/h
]
Fanspeed [V]
4 5 6 7 8
363 368 373 378 383 388
P
ro
d
u
ct
iv
it
y
[m
m
o
le
M
eO
H
/gc
at
/h
]
[image:28.595.145.452.547.742.2]29 Despite the fact that the actual condenser temperature could be lower than the measured tempera-ture in the gas phase at the condenser outlet, a temperatempera-ture difference of 50K between the actual and measured outlet temperature is not expected. Therefore, it can be concluded outlier productivi-ty was not caused by a lower condenser temperature.
5.1.4. Startup effect of the catalyst
The experiment of the outlier productivity was performed after the activation of the catalyst. During the activation the catalyst is reduced. It may be possible that the reduction of the catalyst was not complete during the activation. Therefore, the catalyst is may be further reduced during the experi-ment. During this reduction water is produced and generating a faulty productivity based on the condensate mass. To investigate the startup effect of the catalyst the compositions of the liquid samples are analyzed with IR absorption spectrometry. If this hypothesis is true, the amount of water should be higher in the liquid samples of the first experiment performed after the startup of the re-actor than in the liquid samples of the experiments performed in later experiments.
[image:29.595.72.525.392.587.2]Based on the literature, the expectation is raised that only methanol and water are present in the liquid samples. To determine whether methanol and or water are present in the liquid samples, the calibration curves of methanol and water are needed. Therefore, the absorbance of pure methanol and water are measured and the calibration curves are constructed. The calibration curves of pure methanol and water are shown in Figure 19. In this figure, the blue line belongs to water and the red line to methanol.
Figure 19: Calibration spectra Water and Methanol
Water shows two absorption peaks: one broad large OH peak at a wavenumber of 3345cm-1 and a sharp small OH bending peak at a wavenumber of 1638cm-1. Methanol has seven peaks: Like water, it has a broad OH peak at a wavenumber of 3316cm-1. The two small sharp peaks at wavenumber of 2944cm-1 and 2832cm-1 indicate CH sp3 bonding. The three small peaks at wavenumbers of 1449cm-1, 1404cm-1 and 1117cm-1 determine a CH3 group. The large sharp peak at a wavenumber of 1073cm-1 identifies a single CO bonding.
To determine if more water is present in the liquid samples of the first experiment the IR absorbance curves of the liquid samples are compared to the absorbance curve of the liquid sample from the reproducing experiment. The resulting spectra of these IR absorbance measurements are shown in
-0,1 0 0,1 0,2 0,3 0,4 0,5
500 1.000
1.500 2.000
2.500 3.000
3.500 4.000
A
b
so
rb
an
ce
Wavenumber [cm-1]
Water
30 Figure 20. Samples 1 to 3 are the first three liquid samples of the first experiment after the catalyst activation. The spectra of the liquid samples of the experiments at a catalyst out temperature of 519K and a condenser outlet temperature of 373K under forced convection with a fan speed of 2V are represented by Productivity 8 and Productivity 5 for the high productivity outlier and the produc-tivity of the reproducing experiment respectively.
As can be seen in Figure 20, all five liquid samples lay between the calibration curves of water and methanol. Furthermore, no additional peaks are present in the IR absorption spectra. The spectrum of Sample 1 lies above the spectra of the other samples at the OH peak. This means that the first liquid sample after the catalyst activation contains a bit more water than the subsequent samples. Strikingly, the spectra of Productivity 8 and Productivity 5 overlap each other, which results in the fact that they have the same composition. Therefore, it can be concluded that outlier productivity cannot be caused by the startup effect of the catalyst, since there is not more water in the liquid sample, and that the measured productivity is correct.
Figure 20: Spectra from the first three liquid samples, the measurement with the outline productivity of 8 and the repro-ducing measurement with resulting productivity of 5
The influence of the water temperature of the condenser, fan speed, condenser temperature and startup effect of the catalyst on the productivity has been investigated. However, these investiga-tions give not an explanation for the outlier measurement. The results excluding the outlier produc-tivity show that the producproduc-tivity of the reactor setup increases almost linearly with the catalyst out temperature until a temperature of 503K and then remain constant at productivity of 5mmole MeOH/gcat/h with increasing catalyst out temperature. Since the highest productivity for both forced and natural convection is measured at a catalyst out temperature of 502K, this seems to be the optimal catalyst out temperature by a condenser out temperature of 373K. This result will be compared with the calculated results from the model at the end of this chapter.
5.2.
Energy efficiency
As described in the previous chapter, the energy efficiency is calculated by equation 37. In this study, the mass of the catalyst in the reactor is 72,4g. The higher heating value of methanol was found in literature and has a value of 720kJ/mole [25].The energy efficiency at varying catalyst out tempera-tures, with a constant condenser outlet temperature of 373K for both forced and natural convection is investigated for the reactor setup.
-0,1 0 0,1 0,2 0,3 0,4 0,5
500 1.000
1.500 2.000
2.500 3.000
3.500 4.000
A
b
so
rb
an
ce
[
μ
m]
Wavenumber [cm-1]
Water
MeOH
Sample 1
Sample 2
Sample 3
Productivity 8
31 Figure 21 a) shows the required energy input, the needed oven duties, to reach the required catalyst out temperatures. The trend in this figure is as expected: The higher the catalyst out temperature, the more energy the oven requires to heat the gas stream to this temperature. With these oven du-ties the energy efficiencies at the corresponding catalyst out temperatures are calculated. The result-ing energy efficiencies under forced and natural convection at a condenser outlet temperature of 373K are presented in Figure 21 b). It can be seen that both curves for natural and forced convection show a clear maximum of energy efficiency at a catalyst out temperature of 502K. At this tempera-ture the productivity is the highest as is shown above. At higher temperatempera-tures the productivity re-mains constant whereas the oven duties increase resulting in a decrease in energy efficiency. The energy efficiency under forced convection is slightly higher because it has a slightly higher productivi-ty than under natural convection.
Figure 21: a) Oven duty at the catalyst out temperature. b) Energy efficiency at the catalyst out temperature. Both at a condenser outlet temperature of 373K
Additionally, the energy efficiency at a catalyst out temperature of about 519K with varying conden-ser outlet temperatures under forced convection is investigated. Figure 22 a) shows the required oven duties in order to maintain the catalyst out temperature of 519K at a fan speed of 2V. In this figure, the red point represents the result of the outlier measurement. Notable is that the lower the condenser outlet temperature, the more energy is required to maintain the catalyst out temperature at 519K. This is due to the fact that the catalyst in temperature is lower at lower condenser outlet temperature. Therefore, more energy is required to heat up the gas again to reach the desired cata-lyst out temperature.
The resulting energy efficiencies at a catalyst out temperature of about 519K with varying condenser outlet temperatures under forced convection are shown in Figure 22 b). Again, the red point repre-sents the outline measurement. As mentioned earlier, the methanol duty is linked to the productivi-ty. Since the productivity is higher at lower condenser outlet temperature, also the energies deliv-ered by the methanol are. Despite the higher necessary oven duties to maintain the catalyst out temperature at 519K, the energy efficiency is higher at low condenser temperatures due to the fact that the productivity is higher at lower condenser outlet temperatures.
325 350 375 400 425 450 475 500
473 483 493 503 513 523
O
ve
n
D
u
ty
[W]
A Tcat,out [K]
With Fan 2 V
Without Fan
0,145 0,165 0,185 0,205 0,225 0,245
473 483 493 503 513 523
En
e
rg
y
Ef
fi
ci
en
cy
B Tcat,out [K]
With Fan 2 V
[image:31.595.73.524.249.444.2]32 Figure 22: a) Required oven duties to maintain a catalyst out temperature of 519K at different condenser outlet tempera-tures b) Corresponding energy efficiencies at different condenser outlet temperatempera-tures with a catalyst out temperature of
373K
From these results, it can be concluded that under the conditions used in this study, a catalyst out temperature of 502K and condenser outlet temperature of 373K has the highest energy efficiency of 0,193 and 0,183 for forced and natural convection respectively.
5.3.
Comparison model with experimental results
The experimental results are compared to the model results from the sensitivity studies in chapter 3.4.. The comparisons are presented in Figures 23 to 25. It is notable that all model results show a clear maximum in the productivity curves over the catalyst out temperature range from 473K to 523K, whereas the experimental results do not. This indicates that a limiting factor is present in the reactor setup. Furthermore, it can be seen that the experimental and model results have the same order of magnitude. However, none of the calculated curves overlaps with the experimental results.
Figure 23: Comparison experimental results with the calculated results at different mass flow rates
By taking a closer look at Figure 23: Comparison experimental results with the calculated results at different mass flow ratesFigure 23, the experimental results at low catalyst out temperatures lie above the curves of the model calculations at different mass flows. As described in chapter 3.4., the
465 475 485 495 505
358 368 378 388
O
ven
D
u
ty
[
W]
A Tcond,out [K]
0,125 0,145 0,165 0,185 0,205 0,225 0,245
358 368 378 388
En
ergy
E
ff
ic
ie
n
cy
B Tcond,out [K]
0 1 2 3 4 5 6 7 8 9 10
473 483 493 503 513 523
P
ro
d
u
ct
iv
it
y
[m
m
o
le
M
e
O
H
/gc
at
/h
]
Tcat,out [K]
phi_m0
0.5 phi_m0
2 phi_m0
With Fan 2V
[image:32.595.144.452.496.693.2]
![Figure 2: Chemical equilibria in methanol synthesis from CO2 at different pressures. CO2 feed: H2/CO/CO2 75.0/0/25.0 [7]](https://thumb-us.123doks.com/thumbv2/123dok_us/9829241.484204/7.595.159.448.73.279/figure-chemical-equilibria-methanol-synthesis-different-pressures-feed.webp)
![Figure 3: Yields of methanol / water and heat released at equilibrium in methanol synthesis as a function of CO2 concen-tration in the feed gas [11]](https://thumb-us.123doks.com/thumbv2/123dok_us/9829241.484204/8.595.174.431.384.569/figure-yields-methanol-released-equilibrium-methanol-synthesis-function.webp)
![Figure 5: Influence of pre-addition of water on the CO2 conversion, methanol yield and CO yield [8]](https://thumb-us.123doks.com/thumbv2/123dok_us/9829241.484204/10.595.161.437.142.647/figure-influence-addition-water-conversion-methanol-yield-yield.webp)
![Figure 6: Calculated equilibrium and experimental kinetic methanol yields for CO/H2 and CO2/H2 depending on tempera-ture [14]](https://thumb-us.123doks.com/thumbv2/123dok_us/9829241.484204/11.595.199.387.395.576/figure-calculated-equilibrium-experimental-kinetic-methanol-depending-tempera.webp)
![Figure 7: Effect of space velocity on carbon conversion and methanol selectivity from CO2/H2 (o,•) and CO/H2 (△,♦)[14].](https://thumb-us.123doks.com/thumbv2/123dok_us/9829241.484204/12.595.196.400.280.467/figure-effect-space-velocity-carbon-conversion-methanol-selectivity.webp)
![Figure 8: Methanol synthesis rate for CO/H2, CO2/H2 and CO (20.5)/CO2 (5)/H2 (74.5) [17]](https://thumb-us.123doks.com/thumbv2/123dok_us/9829241.484204/13.595.207.394.303.488/figure-methanol-synthesis-rate-h-co-h-co.webp)