ᰠ
䤀
洀瀀爀
漀瘀椀
渀最
琀
栀攀
瀀栀愀猀椀
渀最
椀
渀
愀渀搀
漀甀琀
瀀爀
漀挀攀猀猀
愀琀
䠀甀渀琀
攀爀
䐀漀甀最氀
愀猀
䔀甀爀
漀瀀攀ᴠ
䴀愀猀琀攀爀
吀栀攀猀椀
猀
䴀⸀
䬀⸀
瘀愀渀
搀攀爀
䠀漀攀瘀攀渀
ii | M a s t e r T h e s i s – M . K . v a n d e r H o e v e n
C
OLOPHON
Document title: Improving the phasing in and out process at Hunter Douglas Europe
Author: M.K. van der Hoeven, BSc
Date: February 2016
Educational Institution: University of Twente Drienerlolaan 5 7522 NB, Enschede The Netherlands
Organization of Internship: Hunter Douglas Europe B.V. Piekstraat 2
3071 EL, Rotterdam The Netherlands
Educational Program: Industrial Engineering and Management
Specialization: Production and Logistics Management
Committee:
Dr. Peter Schuur
School of Management and Governance University of Twente, Ravelijn 3422 [email protected]
Dr. Ahmad Al Hanbali
School of Management and Governance University of Twente, Ravelijn 3335 [email protected]
Ir. Henk den Uijl Manufacturing Division
Hunter Douglas Europe, Rotterdam [email protected]
Ing. Rolf van Dok
iii | M a s t e r T h e s i s – M . K . v a n d e r H o e v e n
M
ANAGEMENT SUMMARY
This research is performed at Hunter Douglas Europe, located in Rotterdam. Hunter Douglas is the world market leader in window covering products, most commonly known in the Netherlands for its brand Luxaflex, and a major manufacturer of architectural products. Hunter Douglas had a revenue and net income of respectively $2,295 Million and $125 Million in 2014. As a starting point of this master thesis, Hunter Douglas Europe has stated that it does not excel at phasing in new products and phasing out old product inventories, and are looking to improve the efficiency of their inventory. Therefore, we formulate the following research question:
“How can Hunter Douglas Europe improve their phasing in and out process to decrease the obsolete costs of the inventory of their make to stock items of the window covering products at the distribution center in Oudenbosch while achieving the target service levels?”
To start answering this question, the current phasing in and out process is analyzed to identify potential problems. During the problem identification the major contributors to the obsolete costs are identified using the total financial reservations made for these costs. This analysis shows that the reservation of €6 Million for decorative window covering products (products intended for the consumer market) is 79% of the total reservations made and that this value is made up for 83% by the product lines Venetian Blinds, Roller Blinds, and Plissé Shades. Next to that, the major contributor to the financial reservations are make to stock items. The factors that cause the high obsolete costs are identified and fall in three categories, namely: a high minimum order quantity, faulty (production/purchase) orders, and wrong (delayed) start of the phasing out process.
Then, a literature review is performed to create an understanding of ways to tackle these problems. In the literature, it is stated that when inventory has the potential to suddenly become obsolete, traditional inventory analysis is rendered unsuitable for balancing reordering costs with costs of overstocking. The literature shows that when the number of weeks since the last obsolescence (in the case of recurring obsolescence) of a product increases, the optimal order quantity decreases. Next to that, according to the literature, when in the presence of an optimal inventory policy, the order-up-to levels increase at a decreasing rate when the mean lead time rises. These theoretical results do not only enforce the benefits of reduced lead times but also that the obsolescence factor should be significant in inventory management decisions. Finally, if a sudden change in demand rate can be foreseen, timely adaption of the order-up-to levels is crucial for optimal stock control. Adapting to a drop in demand is difficult since natural attrition of excess stocks depends on the demand process. Even if the timing and the size of the drop are known exactly, when to change the inventory control policy to minimize obsolete stocks without staking availability remains a challenging question. In the literature, it is shown that changing the policy in advance instead of immediately after the drop in demand results in significant cost savings.
According to the theoretical statements, we are led to believe that lowering the minimum order quantity in the prospect of a drop in demand rate has a positive influence on obsolete stock and thus costs. We have formulated the following proposition to research this assumption:
iv | M a s t e r T h e s i s – M . K . v a n d e r H o e v e n
The proposition is tested with a simulation study, using Microsoft Excel with Visual Basic for Applications, of 14 make to stock articles from the three major product lines, that are mentioned above. The 210 experiments per article are based on two factors. The first factor is the number of order lines of the previous 365 days of an article; used to determine when to lower the minimum order quantity. The second is the minimum order quantity factor; used to determine with which factor the minimum order quantity should be lowered.
The results of the simulation study show that lowering the minimum order quantity of an article when there is evidence that the article is at the end of its lifecycle has a positive influence on the resulting obsolete value which is greater than the increase in total value bought of the article during its lifecycle, for all but one article. Next to that, on average no increase in the total value bought during the total lifecycle of an article has occurred. This means that the proposition is not rejected based on the empirical research. On average over the 14 simulated articles, switching when the total order lines drop below 15 per year, and ordering 40% of the original minimum order quantity results in in an average decrease of 28% in obsolete costs. This in comparison when using the optimal setting for each article, which results in an average decrease of 58%. Based on the simulation study, however, no generic tool could be generated to help Hunter Douglas determine when to switch to a lower minimum order quantity and what this lower quantity should be.
These results are based on the difference between the obsolete costs of simulations with and without lowering the minimum order quantity, which is different from the obsolete costs that occurred in practice, which leads to the following point. The results of the simulation study shows that following the rules of the (r, q) policy, ordering a quantity q when the inventory level drops below a reorder point r, has a significant positive effect on both the obsolete costs and total value bought. It is remarkable that although Hunter Douglas says they use this policy for the reorder point controlled articles, Hunter Douglas does not follow this strategy. The results show that when strictly following the (r, q) policy, the obsolete costs can be reduced up to 50%.
The actual total obsolete costs made for the decorative window covering products in 2015 was almost 1.4 Million euros. This means that by following the strategy of Hunter Douglas, almost €700,000 can be saved on a yearly basis. These cost savings excludes the savings that can be made by lowering the minimum order quantities, which is an additional €200,000.
v | M a s t e r T h e s i s – M . K . v a n d e r H o e v e n
P
REFACE
February 2016 From September 2015 until February 2016, I’ve been performing research at Hunter Douglas Europe, located in Rotterdam, to improve the process of phasing inventory in and out. This thesis is the result of the previous six months of work in order to obtain my Masters in Industrial Engineering and Management at the University of Twente.
I would like to make use of this preface to thank the people that were involved during my education and especially during my internship.
Firstly, I would like to thank my supervisors from Hunter Douglas, Rolf van Dok and Henk den Uijl. Rolf has been of great help with brainstorming about my research and provided me with some key insights. Furthermore, he was able to help me obtain the right data for my research. Although I didn’t meet much with Henk, the meetings that we had always helped me with my progress. I’m impressed in the way he managed the people present at the various meetings I’ve attended. Both, many thanks for the great help and experience.
Then, my supervisors from the University of Twente, Peter Schuur and Ahmad Al Hanbali. Peter was also my supervisor during my Bachelors, which was already a great experience, and he helped me again with the search for an internship. During the always fun emphasized meetings, Peter helped me by steering me in the right direction. It is remarkable how quickly he understands the discussed subject. Although Ahmad joined the committee at a later moment, he was of great help. Especially his knowledge and insights in the academic parts of my research helped me a lot. Both, many thanks for the great help and the fantastic meetings.
Continuing with my friends from W6, Maät, Tranquillum, and other friends. I have had a great time in Enschede. Thanks for all the great evenings and support during hard but especially great times. And I hope you’ll be there for the coming great times!
Finally, I would like to thank the persons that helped me during (the majority of) my life. My parents, thanks for the unconditional support and love. Ruud, thanks for all the advice and great evenings. Kayleigh, thanks for always being there for me, no matter the time I called you.
Now that I finished my Masters, I am glad that Hunter Douglas has given me the opportunity to start my career with them as Junior IT Consultant!
vi | M a s t e r T h e s i s – M . K . v a n d e r H o e v e n
T
ABLE OF CONTENTS
Colophon ...ii
Management summary ... iii
Preface ... v
Table of contents ... vi
Glossary ... ix
Introduction ... 1
1.1 Hunter Douglas ... 1
1.2 Problem description ... 1
1.2.1 Forecasting ... 2
1.3 Research question ... 2
1.3.1 Main research question ... 3
1.3.2 Sub research questions ... 4
1.4 Research approach ... 5
Current process ... 7
2.1 Supply chain Hunter Douglas Europe ... 7
2.2 Relevant departments of Hunter Douglas Europe ... 8
2.2.1 Expert centers ... 8
2.2.2 Purchasing ... 9
2.2.3 Planning & Customer order service ... 10
2.2.4 Fabricator division ... 10
2.2.5 Components & Programs division ... 10
2.3 MRP types ... 10
2.3.1 Make to stock ... 10
2.3.2 Make to order ... 14
2.3.3 Engineer to order ... 14
2.4 Phasing in and out process ... 14
2.4.1 Master Collection ... 15
2.4.2 Phasing in... 17
2.4.3 Phasing out ... 18
2.5 Conclusion ... 18
Problem identification ... 19
3.1 Performance indicators ... 19
3.2 Obsolete costs analysis ... 20
vii | M a s t e r T h e s i s – M . K . v a n d e r H o e v e n
3.3.1 Minimum order quantity too high ... 24
3.3.2 Faulty (production/purchase) order ... 25
3.3.3 Phasing out not started on time ... 27
3.4 Conclusion ... 27
Literature review ... 29
4.1 Demand uncertainty ... 29
4.2 Lot sizing ... 31
4.3 Intermittent demand ... 32
4.3.1 Model of Croston ... 32
4.3.2 Model of Willemain et al. ... 33
4.3.3 Model of Teunter et al. ... 34
4.3.4 Conclusion about models ... 34
4.4 Obsolescence ... 35
4.5 Conclusion ... 38
Results ... 39
5.1 General solutions ... 39
5.1.1 Reorder points ... 39
5.1.2 Opening stocks ... 40
5.1.3 Phasing out not started in time ... 41
5.1.4 AGP in SAP with article ... 41
5.1.5 Demand uncertainty and supply chain alignment ... 41
5.1.6 Faulty (production/purchase) orders ... 42
5.2 Minimum order quantity reduction ... 42
5.2.1 Selection of articles and data retrieval ... 43
5.2.2 Simulation model design ... 44
5.2.3 Simulation experiments... 45
5.2.4 Model assumptions and discussion ... 45
5.2.5 Results ... 46
5.2.6 Prediction of the results ... 56
5.2.7 Generalizability ... 61
5.2.8 Conclusion ... 62
5.3 Conclusion ... 63
Implementation ... 65
6.1 General solutions ... 65
6.2 Minimum order quantity reduction ... 66
viii | M a s t e r T h e s i s – M . K . v a n d e r H o e v e n
7.1 Conclusions ... 69
7.2 Discussion ... 70
7.3 Recommendations... 71
References ... 73
Appendices ... 75
Appendix A: Overview of the Product and Collection Development Procedure ... 75
Appendix B: Customer launch plan 2014 for Plissé and Duette ... 77
Appendix C: Screen shot of article data in Microsoft Excel... 78
Appendix D: Cost structure of 50 plastic tape 25 ... 79
Appendix E: VBA simulation model ... 80
Appendix F: Results of simulation study ... 84
ix | M a s t e r T h e s i s – M . K . v a n d e r H o e v e n
G
LOSSARY
AGP Aanvraag gereed product (In English: request finished product)
AO Article Owner
B2B Business-To-Business
BIC Backward Integrated Company
BOM Bill Of Material
C&P Components & Programs
CODP Customer Order Decoupling Point
Collection Composition of articles that are currently sold in the market
DCO Distribution Center Oudenbosch
DWCP Decorative Window Covering Products
EC Expert Center
EMEA Europe, Middle East, and Africa
EOQ Economic Order Quantity
ERP Enterprise Resource Planning
ETO Engineer To Order
Expert center Department responsible for at least one product line
FIC Forward Integrated Company
FIFO First In, First Out
FWCP Functional Window Covering Products
GPROI Gross Profit Return On Inventory
Hardware Articles that are used to mount the fabrics
HDE Hunter Douglas Europe
KPI Key Performance Indicator
LFL Lot-For-Lot
MOQ Minimum Order Quantity
MRP Material Requirements Planning
MTO Make To Order
MTS Make To Stock
Obsolete costs Value of the obsolete stock
PCDP Product and Collection Development Procedure
PI MRP type indicating introduction articles
PO MRP type indicating obsolete articles
PR MRP type indicating medium and slow moving articles
PS MRP type indicating articles that are phasing out
PT MRP type indicating test articles
PU MRP type indicating articles at the end of its lifecycle
PV MRP type indicating fast moving articles
POQ Periodic Order Quantity
RFQ Request For Quotation
RONAE Return On Net Assets Employed
SAP Enterprise resource planning system
SKU Stock Keeping Unit
VB Venetian Blinds
VBA Visual Basic for Applications
WCP Window Covering Products
WW Wagner-Whitin algorithm
1 | M a s t e r T h e s i s – M . K . v a n d e r H o e v e n
I
NTRODUCTION
In the framework of completing my master education Industrial Engineering and Management, specialized in the field of Production and Logistics Management, at the University of Twente, I performed a research at Hunter Douglas, located in Rotterdam, regarding the process of phasing inventory in and out. In the following sections, Hunter Douglas is introduced, the problem is described, and the research question and approach are explained.
1.1
H
UNTERD
OUGLASHunter Douglas is the world market leader in window covering products, most commonly known in the Netherlands for its brand Luxaflex, and a major manufacturer of architectural products. Established in 1919 as a machine toolshop under the name of Sonnenberg, AG. In 1946, Henry Sonnenberg established a joint venture with Joe Hunter which developed new technology and equipment for the continuous casting and fabrication of lightweight aluminum. This led to the production of aluminum venetian blinds. Hunter Douglas, as we know it today, was born. In 1969, the Hunter Douglas Group went public, and its shares are currently listed on the Euronext and Deutsche Börse. In 1971, Hunter Douglas Group’s headquarters were moved to Rotterdam, The Netherlands. Nowadays, the company is composed of 190 companies with 50 manufacturing and 75 assembly plants, marketing organizations in more than 100 countries, and a management office in Luzern, Switzerland. Within the Netherlands, Hunter Douglas owns an aluminum coil foundry and coil coating facility in Rotterdam, a hardware production facility and distribution center in Oudenbosch, a paint facility in Hoogeveen, a slat and Duette fabric production facility in Leek, and a fabric producer/supplier, Artex, in Aarle-Rixtel. Hunter Douglas employs over 16,000 people, and has a revenue and net income of respectively $2,295 Million and $125 Million in 2014 (Hunter Douglas, Annual Report, 2014).
Hunter Douglas Europe has expressed that they have a problem which is explained in the following section.
1.2
P
ROBLEM DESCRIPTIONThe performance of the inventory at Hunter Douglas Europe (HDE) is measured by, amongst others, Gross Profit Return on Inventory (GPROI). GPROI is derived from Gross Margin Return on Inventory (GMROI). Gross margin is simply calculated by dividing the gross profit by the accompanying net sales. GMROI indicates if the modality of inventory management generates profit. It is an important indicator for appreciating the inventory efficiency and the company’s performance (Burja, 2011). GMROI is calculated as follows:
2 | M a s t e r T h e s i s – M . K . v a n d e r H o e v e n The GPROI is then calculated in the following way:
𝐺𝐺𝐺𝐺𝐺𝐺𝐺𝐺𝐺𝐺𝑃𝑃𝐺𝐺𝐺𝐺𝑃𝑃𝑀𝑀𝑅𝑅𝑅𝑅𝑅𝑅𝑅𝑅𝑅𝑅𝐺𝐺𝑀𝑀𝐺𝐺𝑀𝑀𝐼𝐼𝑀𝑀𝐼𝐼𝑅𝑅𝑀𝑀𝑅𝑅𝐺𝐺𝐺𝐺𝐼𝐼= 𝐺𝐺𝐺𝐺𝐺𝐺𝐺𝐺𝐺𝐺𝑃𝑃𝐺𝐺𝐺𝐺𝑃𝑃𝑀𝑀𝑅𝑅
𝐴𝐴𝐼𝐼𝑅𝑅𝐺𝐺𝑀𝑀𝑀𝑀𝑅𝑅𝐼𝐼𝑀𝑀𝐼𝐼𝑅𝑅𝑀𝑀𝑅𝑅𝐺𝐺𝐺𝐺𝐼𝐼
HDE has stated that the current GPROI is not good enough and is looking to improve the efficiency of the inventory (den Uijl, 2015). It is reported that the phasing in and phasing out of stock keeping units (SKUs) related to respectively new and old products is one of the factors which influences GPROI and is also a practice that HDE does not excel at. Especially the obsolete costs, resulting from an insufficient phasing out process, is a factor that negatively influences the GPROI. The SKUs at HDE are classified according to their stage in the product lifecycle (see Figure 1-1) where SKUs in the introduction stage are phased in and SKUs in the decline stage are phased out. The process of phasing SKUs in and out with respect to the inventory policies (such as replenishment quantity, replenishment point, review period, projected growth/decline) of these SKUs can be improved and standardized to achieve a better GPROI.
1.2.1 Forecasting
The process of phasing in and out is highly related with the ability to make an accurate demand forecast, however, HDE has stated that they have difficulties with forecasting the demand. This is mainly caused by their order profile. HDE has approximately 300,000 order lines per year with 15,000 SKUs. This results in an average of 20 order lines per SKU. This average of 20 order lines per SKU does not provide enough data to perform a decent forecasting analysis. Only a small part of the articles has enough data to perform this analysis. Because of this, Hunter Douglas Europe cannot accurately forecast their demand and therefore they have, in combination with a target service level, high inventory levels to cope with this uncertainty.
1.3
R
ESEARCH QUESTION [image:12.595.140.455.75.236.2]Based on the problem description and after initial research at HDE, a research question and sub research questions are formulated to systematically come to results to improve the problem described in Section 1.2. In Section 1.3.1, the main research question including the scope is stated and explained. The sub research questions are defined in Section 1.3.2.
3 | M a s t e r T h e s i s – M . K . v a n d e r H o e v e n
1.3.1 Main research question
The research question is used to determine the scope and the final goal of the research. First, the research question is stated and then, in the next section, the individual parts that define the scope are explained. The research question is:
“How can Hunter Douglas Europe improve their phasing in and out process to decrease the obsolete costs of the inventory of their make to stock items of the window covering products at the distribution center in Oudenbosch while achieving the target service levels?”
1.3.1.1 Scope
The elements that are underlined in the research question are explained in detail below. These elements define the scope of the research.
Hunter Douglas Europe
The research is executed at the headquarters of Hunter Douglas in Rotterdam, the Netherlands, but focusses on all the operations that belongs to Hunter Douglas Europe.
Phasing in and out process
The phasing in and out process is the process that is analyzed at HDE. The process of introducing new SKUs and decreasing the old SKUs with respect to the inventory, of which is stated that HDE does not excel at, has room for improvement.
Obsolete costs of the inventory
The GPROI is calculated by dividing the gross profit by the average inventory. With respect to the phasing in and out process, the inventory during introduction and the inventory that becomes obsolete are the two factors that negatively impact the GPROI. Although obsolete inventory is created due to decisions throughout the total lifecycle, it is decided to focus on decreasing the obsolete costs at the end of the lifecycle. This does not, however, exclude solutions that manage the risk on obsolescence throughout the lifecycle.
Make to stock items
Since the research aims at lowering inventory costs, it only includes the items that are kept on stock, thus the make to stock items. Make to order and engineer to order are therefore excluded. Next to that, the make to stock items are the major contributors to obsolete costs.
Window covering products
As mentioned in Section 1.1, Hunter Douglas is not only a supplier of window covering products (WCP), but also major manufacturer of architectural products. Since more than 80% of the reservations for obsolete stock are made for the WCP division, it is decided to exclude the division of architectural projects.
Distribution center in Oudenbosch
The inventory of Hunter Douglas Europe is held at the distribution center in Oudenbosch (DCO). From the DCO, Hunter Douglas’s owned and independent assembly plants, and third party customers are served for all EMEA operations. The focus therefore lies on the inventory held at the DCO.
4 | M a s t e r T h e s i s – M . K . v a n d e r H o e v e n
Hunter Douglas Europe has set target service levels for the delivery performance. This target of HDE is to deliver at least 95% of all orders within the contracted delivery time. Sufficient inventory can positively impact the service level, but has a negative effect on obsolete costs. Within this research, a service level of 95% is taken into account. Lowering the inventory is one solution to decrease the obsolete costs, but the target service level has to be achieved.
1.3.2 Sub research questions
To answer the research question, sub research questions are defined to divide the research questions into parts and guide the research.
Sub research question 1:
What is the current phasing in and out process at Hunter Douglas Europe?
To analyze the phasing in and out process, this process will be described first. This sub research question realizes this requirement and results in a complete description of the phasing in and out process, together with its related processes and information needed to understand the current process.
Sub research question 2:
Which key performance indicators of the phasing in and out process are currently maintained at Hunter Douglas Europe and is there a discrepancy between the current value and the norm?
After researching the current phasing in and out process, the key performance indicators will be investigated. This is necessary to understand how the performance of the current process is measured. First, the key performance indicators are defined based on interviews with stakeholders and an analysis of relevant data. Then, the current value and the norm of the indicators are established to identify potential problems in the current process.
Sub research question 3:
What are, according to the literature, adequate procedures for phasing in and out?
To find potential improvements for the phasing in and out process, an understanding of adequate phasing in and out procedures must be created. This is done with a literature review. Dependent of the outcomes of sub research question 2, there will be looked into different subjects that are present in the potential problems. This study will help to get an insight in different methods, models, and theories that are available, and creates a basis for the set of solutions that is created in the next sub research question.
Sub research question 4:
What is the set of solutions which can help Hunter Douglas Europe to improve their phasing in and out process, both short and long term?
This fourth sub question has the objective to present a set of solutions, specifically designed for Hunter Douglas, that enables Hunter Douglas to improve their current phasing in and out process, on short term as well as long term. The short term focuses on the ‘quick wins’ that can be implemented rather quickly, while the long term focuses on more radical recommendations that can require more resources, such as financial investments, pilots, and development efforts. The results of the proposed solutions are tested and compared with the current situation.
5 | M a s t e r T h e s i s – M . K . v a n d e r H o e v e n
Which of the proposed solutions should be implemented and how should they be implemented? In the final sub research question, a selection of the proposed solutions is made and an implementation plan is written to ensure that Hunter Douglas can make use of the solutions that are generated.
1.4
RESEARCH APPROACH
7 | M a s t e r T h e s i s – M . K . v a n d e r H o e v e n
C
URRENT PROCESS
This chapter presents the current process of phasing inventory in and out at Hunter Douglas Europe. Before this process is presented, the supply chain of Hunter Douglas is explained in Section 2.1. The relevant departments that are stakeholders of the process are described in Section 2.2. In Section 2.3, the MRP (material requirements planning) types, which categorize the articles according to their lifecycle phase and planning characteristics, are explained in detail. Then, the phasing in and out process is explained in detail in Section 2.4.
2.1
SUPPLY CHAIN HUNTER DOUGLAS EUROPE
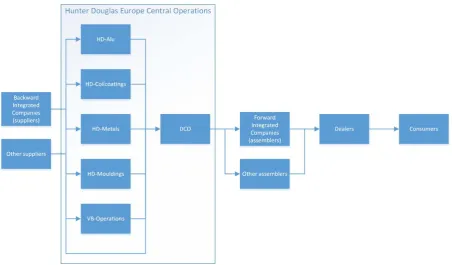
[image:17.595.72.525.276.541.2]To understand in which part of the market Hunter Douglas Europe operates it is necessary to know the location of HDE in the supply chain. A simplified overview of the supply chain of HDE is shown in Figure 2-1.
Figure 2-1: Simplified overview of the supply chain of Hunter Douglas Europe
8 | M a s t e r T h e s i s – M . K . v a n d e r H o e v e n
The terms FICs and wholesale are explained in more detail in Section 2.2.4, respectively 2.2.5.
2.2
R
ELEVANT DEPARTMENTS OFH
UNTERD
OUGLASE
UROPEThere are multiple departments that are stakeholders of the phasing in and out process. These departments, which are roughly responsible for product management, procurement, planning, and sales, are described in the following sections.
2.2.1 Expert centers
Within Hunter Douglas Europe, there are multiple expert centers (ECs), located at Rotterdam. Each expert center is responsible for one or more product lines. The four biggest product lines are Roller Blinds, Plissé Shades, Venetian Blinds, and Duette Shades (see Figure 2-3). Together, they are responsible for over 70% of the sales in 2014. These fall under the expert centers: Pleated & Duette (Plissé and Duette Shades), hardware components (Venetian Blinds), and roller blinds hardware (Roller Blinds). The last two expert centers are mainly responsible for the hardware, i.e., all the articles that are used to mount and operate the fabrics such as head and bottom rail, string tapes, aluminum slats, and chains. They are supported by the EC Fabrics, which is responsible for all the fabrics that are necessary to produce the products. Other expert centers (with logical to conclude product lines) are: insect screens, external venetian blinds, external roller blinds, vertical venetian blinds, and motorizations & controls.
9 | M a s t e r T h e s i s – M . K . v a n d e r H o e v e n
The products of Hunter Douglas are usually composed of hardware and fabrics. In the figure above, some product examples are shown. The first product is a roller blind. The black material is the fabric, while the grey stripe at the bottom, the bottom rail, is hardware. The third photo shows a venetian blind. This is completely composed of hardware, since the aluminum slats are not considered as fabrics. The slats are offered in different colors and prints, and are therefore also considered as collection like the fabrics are. Generally speaking, hardware is everything that is used to mount and operate the fabrics.
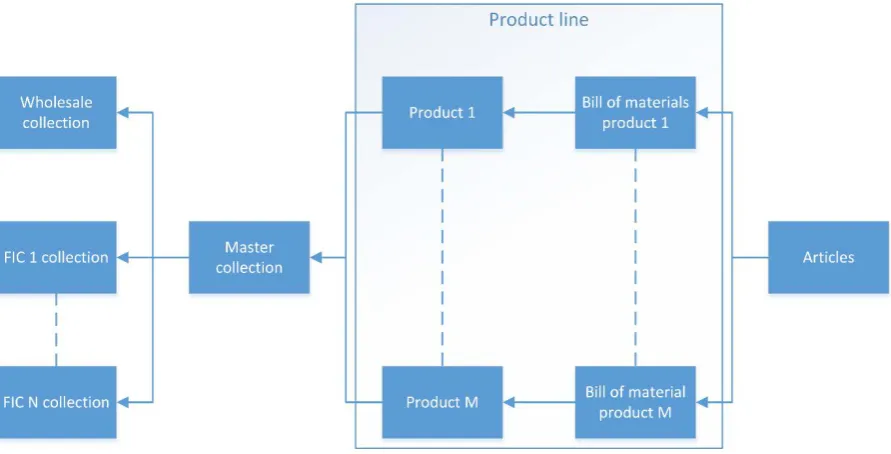
[image:19.595.76.522.275.502.2]ECs are very versatile and perform tasks related to marketing, sales, procurement, logistics, production, R&D, etc. Often, they work closely with these departments. They are responsible for identifying the requirements of the customers, translating this to product and collection development, managing the products, determining and documenting the specifications of the hardware/fabrics, and managing the project of making the new collections. The way collections are build up can be seen in the figure below.
Figure 2-4: Overview of how a collection is composed
Starting from the middle, a product line is composed of several products, 1,…,M, each with an own bill of materials (BOM). The BOM enlists all the articles that are present in a product. Articles are not always product line specific, i.e., they can occasionally be used in products from other product lines. All the products in a product line form the master collection. From this master collection, the collections for the FICs, 1,…,N, (see Section 2.2.4) and the wholesale collection (see Section 2.2.5) is composed. Although complete products are designed and communicated to dealers, Hunter Douglas sells the articles that are needed to assemble these products.
2.2.2 Purchasing
10 | M a s t e r T h e s i s – M . K . v a n d e r H o e v e n
2.2.3 Planning & Customer order service
The planning department is responsible for all planning activities, including supply, demand, and production planning. The planning department ensures that the right quantity is delivered on the right time, translates the forecast into future demand, creates an optimal production and purchased goods planning, and create and follow up production/purchase orders. The customer order service department is responsible for processing customer sales orders in SAP, the enterprise resource planning (ERP) system, and handling customer claims. Customer order entry, however, is for more than 90% of the total orders automated.
2.2.4 Fabricator division
The fabricator division is responsible for all the marketing and sales activities of the branded forward integrated companies (FICs). FICs are companies that are Hunter Douglas owned such as Luxaflex, Sunway, and Multisol of which, for example, the product line collection, and advertisements and promotions are managed centrally. For Luxaflex this is done by Hunter Douglas.
2.2.5 Components & Programs division
The components & programs (C&P) division is the counterpart of the fabricators division. The C&P division serves the independent assemblers and try to manage the wholesale collection, the part of the master collection that is made available for business-to-business (B2B) sales. These businesses create their own (partially or complete) collection by selecting components or products from Hunter Douglas. One of the targets of the C&P division is to maximize the portion of HD components in the collections of these businesses.
The departments that are stakeholders of the phasing in and out process are explained in the previous sections. Now, the MRP types that categorize the SKUs are discussed in the next section.
2.3
MRP
TYPESHunter Douglas has defined several MRP types which are used to differentiate the articles during the product lifecycle. Each MRP type has a different inventory policy, production strategy, responsibility owner, and support group. In this section, the MRP types are categorized by production strategy (make to stock, make to order, and engineer to order) and explained per category. Since the research focuses on make to stock items, this is explained in more detail. The description of the MRP types is based on the MRP type policy document of Hunter Douglas (van Dok, 2015).
2.3.1 Make to stock
11 | M a s t e r T h e s i s – M . K . v a n d e r H o e v e n
[image:21.595.74.521.97.313.2]types of the MTS items are based on the product lifecycle by Levitt (see Figure 2-5).
Figure 2-5: Product Lifecycle and its MRP types at Hunter Douglas Europe (van Dok, 2015)
The MRP types are explained based on the lifecycle stage (introduction, growth, maturity, and decline) to which they belong. The total lifecycle time can vary dependent on the type of product. Fabrics and slats, which are usually collection specific, have a lifecycle run time that is roughly the same of the collection run time. Products that are used to mount the fabrics (i.e., hardware) can be used across collections and therefore can have a lifecycle of several collections.
2.3.1.1 Introduction
The introduction stage encompasses the time period that a product initially enters the market until its unit sales start to rise at an increasing rate. This stage is characterized by low unit sales, losses or low profits, uncertainty of length, vulnerable to attack from competing items, relatively few distributors, inexperienced personnel, and the product is often manufactured in pilot plants (Rink, 1976).
The introduction stage at Hunter Douglas contains one MRP type: Test phase (PT).
Test Phase (PT)
Test phase items are new developed articles of which the functionality and the reproducibility of the component needs to be proven. Only nominated customers (normally one or two) are informed and allowed to order these articles.
12 | M a s t e r T h e s i s – M . K . v a n d e r H o e v e n
or stock keeping (PV), but only after the requested opening stock is reached and the reorder capacity is secured. If standard products are procured from a supplier then the article can be directly set to PI, once the opening stock has reached after the first delivery. The opening stock is the amount of a product Hunter Douglas want to have on hand before continuing to the introduction phase.
2.3.1.2 Growth
As long as unit sales continue to increase at an increasing rate, the product remains in the growth stage. This phase is epitomized by unit sales increasing at an increasing rate, substantial profits, many distributors existing, less product vulnerability, and full-scale production lines being in use or under construction (Rink, 1976).
The growth stage at Hunter Douglas contains one MRP type: Introduction (PI).
Introduction (PI)
PI items are articles of which the sales potential and the reproducibility of the component has been proven; either by passing the test phase or if it is a standard product from a supplier, as mentioned. The planning department is reordering based upon a calculated reorder point, which is based on the forecast. The scenario of how to build up stock made by the article owner (AO) will be reflected in this forecast. An article will have the PI status for a minimum of one year after the roll out started. This is because in the next phase a forecast can then be made, or a reorder point can be calculated based on the consumption of a minimum of one year.
2.3.1.3 Maturity
When unit sales continue increasing but at a decreasing rate, then the product encounters the maturity stage. This stage is represented by profits reaching a plateau and declining slightly, many aggressive competitors exist, prices start to decline, and a cost price squeeze begins (Rink, 1976). At Hunter Douglas, the maturity stage contains two MRP types, namely: stock keeping (PV), and reorder point (PR).
Stock keeping (PV)
Stock keeping items are reordered based upon the MRP calculation by SAP. The MRP is filled based upon the forecast made by the article owners. Based upon the seasonal pattern, a weekly/monthly demand will be calculated in the MRP run. For each time bucket the real sales for that period will consume from this demand. After the period is closed the balance will be cancelled. Extra sales will be consumed from the stock if available, if not, the orders stay open. The planner will review planned orders for production and purchasing. They decide when to transfer them into a definitive order. Customers expect that Hunter Douglas is able to deliver unlimitedly from the stock at the distribution center in Oudenbosch. To give insight on which quantities Hunter Douglas is able to deliver without interference of the planning, they communicate a demand filter (DF). Orders with quantities no greater than the DF will be shipped at once. Quantities above the DF are screened by the MRP planner and, if possible, will be delivered as requested. If not, the surplus will get a lead time as if it was a customer specific order.
An item needs to have a steady sales level and/or customer base to become/stay PV. This means at least three regular buying customers and/or 25 order lines per year.
13 | M a s t e r T h e s i s – M . K . v a n d e r H o e v e n
PR items are moderately moving items which are reordered based upon a reorder point which is calculated based upon the consumption of the last 12 months. PR items often have an irregular sales demand and typically less than 20 order lines and less than one production run and/or procurement order per year.
The MRP planner is responsible for reordering. The planned orders will be generated based upon the reorder point. They are reviewed the same way as PV articles.
The sales and order frequency needs to be reviewed frequently. If sales is picking up, the item might become PV, but when sales are dropping, it will become a phasing out (PS) item.
2.3.1.4 Decline
When unit sales decrease at an increasing rate, the product has entered the decline stage. The attributes of this stage include declining unit sales at an increasing rate, profits continuing to decline, the firm being unable to alleviate the sales and profit declines, and distributors forsaking the product for other items (Rink, 1976).
The decline stage of Hunter Douglas contains three MRP types, which are: phasing out (PS), end of lifecycle (PU), and sell out stock (PO).
Phasing out (PS)
PS items are those that will be phased out. They are slow moving stock items which are reordered based upon a reorder point. The reorder point is calculated based upon the consumption of the last six months.
The sales orders are monitored the same way as PV and PR items. The planned order will be generated based upon the reorder point. The production/purchase order for PS items will always pop-up in ZPS1 transaction of SAP (transaction that filters orders based on criteria e.g. order value or months of demand), because they have to be approved by the article owner. The article owners are able to judge whether the ordered amount will be sold before the item will be completely phased out. If no new (production) order is approved, the safety stock level has to be adjusted or the item has to be set on sell out stock (PO). The decision can also be to order one more (production) run which is less than the minimum order quantity (MOQ). The minimum order quantity is the quantity that Hunter Douglas has to order at least at its suppliers.
After the PS status, the item will become PU, if there is still stock left and the article is still in a collection; or PO, if no more stock is left and the article is not present in any collection.
End of lifecycle (PU)
PU items are slow moving stock items, still part of the collection, which are phased out. The items can be sold as long as stock is available.
The sales orders are not monitored by planning. Normally, PU items will not be replenished but production is still possible upon request of the article owner.
PU items will get the PO status on request of the article owner or when the stock hits zero. If customers are willing to reorder the MOQ, it can be made into a make to order item (see Section 2.3.2).
14 | M a s t e r T h e s i s – M . K . v a n d e r H o e v e n
PO items are obsolete stock items. As soon as an item is set PO and any stock is left, it will be part of the next scrap action.
In general it is not possible to produce PO items. For new production, the ‘aanvraag gereed product’ (AGP) process needs to be followed. When the bill of material is still correct, a request for quotation is enough to activate the item.
Consignment stock (PC)
There is one MRP type that is not categorized according to its lifecycle phase but is MTS, namely consignment stock. These are items which are sold to one unique customer (group). The stock available in the central warehouse is based upon a contract with the customer or sales unit.
The MRP planner is responsible to have the stock available within the lead time. They will inform the sales unit when the last stock is sold. The sales unit is responsible to clear the stock at the end of the contract.
PC items could change to any other status if this is commercially needed.
2.3.2 Make to order
For Hunter Douglas, make to order (MTO) are items that are engineered (only the first time) and produced on customer order. They are not subject to the product lifecycle and thus not classified that way. Hunter Douglas knows two MTO types: Make to order 1 customer (group) (PK) and make to order >1 customer (groups) (PN).
PK are make to order items which are sold to one unique customer (group). The branding could be customer specific and there is no stock hold in the central warehouse. The MOQ is based upon the minimum production run. PN are make to order items which are sold to several customers. They are part of a collection to give the customers a broader choice. There is no stock hold in the central warehouse and the MOQ is based upon the minimum production run. The sales orders are monitored by planning and a specific production or purchase order is issued to cover the demand. The MRP planner is responsible to have the stock available within the lead time. If the demand of either a PN or PK item is becoming stable and smaller lead times are needed it can be turned into a PV or PR item. The rule of thumb states that a minimum of three customers who order the article on a regular basis is needed before it can become a MTS item.
2.3.3 Engineer to order
Engineer to order (ETO) are items that are engineered and produced a single time, based on a customer specification and order. Hunter Douglas has one ETO type: Engineer to order (PE). PE are engineer to order items which are sold once to a unique customer. There is no stock available at the central warehouse. For the requested quantity, a request for quotation (RFQ) has to be filled out. Based upon the RFQ the price for the next production run can be calculated or a quotation at the supplier will be asked. If the customer wants to reorder this article frequently and the production costs are stable it can become a PK article.
All the MRP types are discussed. The next section continues with the description of the phasing in and out process.
2.4
PHASING IN AND OUT PROCESS
15 | M a s t e r T h e s i s – M . K . v a n d e r H o e v e n
understanding of this process. In Section 2.4.1, the principle of the master collection is explained. Following, the phasing in and phasing out process are described in respectively Section 2.4.2 and 2.4.3.
2.4.1 Master Collection
Hunter Douglas Europe works with a master collection. A master collection is the complete combination of every product that falls under one product line. Each expert center has a master collection for all the product lines they are responsible for. From this master collection, the collection for the forward integrated companies and the wholesale collection is defined. The way this is built can be seen in Figure 2-6. The collection for the forward integrated companies and wholesale collection have about 95% overlap, the remaining 5% is brand exclusivity for the FICs. For example, the collection of Luxaflex has some exclusive products to enforce the premium reputation. Generally, this collection will run for approximately four years at the customer. During these years, the current collection is managed, i.e., the collection is analyzed and based on this analysis products are planned to phased out or not. The way the collection is controlled is different for the FICs and the wholesale.
During the collection run time, the new collection is created. This is done via a method called the product & collection development procedure (PCDP). Since some important parameters are created during this procedure, it is shortly discussed in the following paragraph.
2.4.1.1 Product and Collection Development Procedure
Hunter Douglas uses the product and collection development procedure, to facilitate and assure smooth running for planning and developing new products/collections within Hunter Douglas Europe. The PCDP includes project phases and important milestones for projects that are planned and executed by Hunter Douglas. PCDP is applicable for both new product/hardware developments and developments of new collections.
Master collection
Wholesale
FICs
[image:25.595.72.546.309.586.2]95%
5%
16 | M a s t e r T h e s i s – M . K . v a n d e r H o e v e n
PCDP contains eight phases, namely (Hunter Douglas, Product and Collection Development Procedure, 2002):
1. Project idea
2. Project plan
3. Prototype development
4. Pre-industrialization
5. Test market
6. Final industrialization
7. Market introduction
8. Project evaluation
Each phase is closed with a milestone via a Milestone Approval Meeting (MAM) in which the project owner and key members of the project team are present and decisions to continue with the project or not are taken. Each phase is comprised of several steps for which the PCDP contains many standard formats. This process can be compared with a Stage-Gate® system by Cooper (1990). A detailed overview of the PCDP can be found in Appendix A: Overview of the Product and Collection Development Procedure.
During the PDCP, the expert centers have to make the forecasts for the articles within the collections. The forecast are based on historic sales (if available) and the information from the market. The ECs have several meetings with customers to discuss new products. During these meetings, the potential of the articles within the particular FICs are discussed. Customers of the C&P division indicate whether they are going to include the articles in their collection or not. Establishing an accurate forecast, based on this data, has proven to be difficult. Based on the forecast the purchasing department negotiates an optimal minimum order quantity with the selected supplier. It is desirable that the MOQ is as low as possible, since this does not oblige high order quantities with eventually a high obsolete risk. A low MOQ, however, is costly and therefore a tradeoff is made by the purchasing department between the minimum quantity and the cost price per unit bought. The rule of thumb that is used is that Hunter Douglas wants to order an article four times a year so the MOQ is the forecast divided by four.
17 | M a s t e r T h e s i s – M . K . v a n d e r H o e v e n
2.4.2 Phasing in
During the PCDP, article exclusivity for e.g. a brand, country, or market segment is defined. In this way, separation between the FIC collection and wholesale collection is established. As mentioned, the phasing in and out process of the FIC and wholesale collection is managed in a different way. In Section 2.4.2.1, the phasing in process of the collection for the FICs is described while this is done for the wholesale collection in Section 2.4.2.2.
2.4.2.1 Forward integrated companies
It was stated that the master collection contains all articles of a product line and is developed using the PCDP. During the PCDP, the expert center has several meetings with FICs to discuss whether new products ideas would be successful within the specific FIC or not. Dependent on these outcomes, the expert center could choose to insert these products in the new collection for the FIC. Independent of these outcomes, however, the expert center keeps the option open to insert these products in the wholesale collection or not. Next to that, the FICs have a different view on which products are suitable for their collection. This results firstly in different collections for each FIC and secondly in the separation between the collection for the FICs and the wholesale collection. The collections for the FICs is, in the end, composed by the expert centers, but must be approved by the fabricators division. This division also makes the customer launch plan. This is done in phase three and seven of the PCDP, in which the plan is a concept and definitive respectively. The customer launch plan shows in which month/quarter and for which FIC the collection should be introduced. An example of a rollout plan can be found in Appendix B: Customer launch plan 2014 for Plissé and Duette. There are several reasons why the different collections are launched at different times and why a hierarchy between FICs exists. Firstly, by ensuring continuous introduction across the market, there is always a brand which is introducing a new collection. This stimulates and spreads the sales, instead of introducing the new collection at all brands at once. Another advantage of this strategy is that the ECs and the fabricator division spreads the workload related to introductions. Next to that, FICs that have a more ‘premium’ image and tend to serve the top of the market (e.g., Luxaflex) have priority over certain products, or even exclusivity for some products or product features, for a certain period of time. That is why usually at these FICs the collection is introduced earlier than at the other FICs.
2.4.2.2 Wholesale
The wholesale collection is the set of articles used for B2B sales. Since this is also a part of the master collection, it is made using the PCDP. Companies can, with advise from the sales force, compile their own collection from the wholesale collection. This means that many companies have a different subset of the complete wholesale collection. For example, a roller blind with a common color (white, grey, black) can be present in many collections at different customers, but a purple roller blind could only be listed at one customer, while a roller blind with a pattern could be chosen by three customers. Next to that, the customers will phase in their own collection at different times and thus will select the articles at Hunter Douglas Europe at different times. This results that the wholesale collections is used in many collections with different start, run, and end times. The sales force can start to offer a new collection after the kickoff. Thus, after this, customers can start to compile their own collection. One condition for the kickoff is that the articles of a new collection have reached their opening stock. This is to prevent early stock outs. The expert center has to approve the proposed collection of the customer to ensure that only available articles are included in the collection.
18 | M a s t e r T h e s i s – M . K . v a n d e r H o e v e n
2.4.3 Phasing out
As mentioned, a collection has a run time of about four years. This means that near the end of the run time (a part of) the collection has to be phased out. This process is explained in the following sections, again divided between the FICs and the wholesale collection.
2.4.3.1 Forward integrated companies
The phase out process of the collection of the FICs is the complete opposite of the phase in process. During the run time of the collection, the sales are monitored and MRP changes are discussed, together with the corresponding EC/product manager, according to the MRP type policies. Products of which the sales are disappointing will be phased out and are not be included in the next collection. During a collection switch about 35% of the articles in the collection is switched. Since the collection for the FICs is determined by Hunter Douglas, they make a commitment for having every article in the collection available. This makes prematurely phasing out very difficult.
2.4.3.2 Wholesale
As mentioned above, the wholesale collection is used in many collections at different customers, all with different start, run, and end times. After a period of about one or two years, when approximately 50% of the customers is served, the expert center will analyze the sales of the collection. Articles of which the sales are low, e.g., venetian blinds that sell less than 25,000 meters per year (ECs have different criteria for different products), will be set on an introduction stop. This means that the sales department cannot offer the article to new customers anymore. The expert center also decide which (other) articles are going to be phased out. These articles can prematurely be set on PS, so that new orders will not automatically be produced or procured. In this way, the inventory is slowly reduced by the demand process. If a customer orders an article which status is PS and the order will induce a production or purchase order at Hunter Douglas, the article owner have to approve the order. This decision is based on the prediction if the article’s stock will sell out before it is phased out completely. If this is not the case, the article owner can decide to produce/procure a smaller run with a higher price or ask the customer to purchase the minimum order quantity. Another option, which is far from desirable, is to accept the loss of sales and also lower customer satisfaction.
2.5
C
ONCLUSIONThis chapter has aimed to create an adequate understanding of the phasing in and out process, together with other necessary information. Relevant departments are introduced, the different MRP types that are used are explained, and the way the master collection is composed is discussed. Lastly,
the actual phasing in and out process is described. The first sub research question “What is the
19 | M a s t e r T h e s i s – M . K . v a n d e r H o e v e n
P
ROBLEM IDENTIFICATION
A problem is a discrepancy between the norm and the reality. To determine if there are problems and if there are, to identify these problems, the key performance indicators (KPIs), the norm of these indicators and the current values of the KPIs must be known. This can be found in Section 3.1. Next, to determine the scope, an analysis of the activities of the business that (negatively) contribute to the KPIs is performed in Section 3.2. Last, a problem knot is presented which analyses which factors influence the main problem that is stated in the first section of this chapter. The problem knot is discussed in detail in Section 3.3.
3.1
PERFORMANCE INDICATORS
HDE maintains roughly two main key performance indicators, namely the profit target and the return on net assets employed (RONAE). The net assets employed are all the assets that are used to create the profit. The RONAE is calculated as follows:
𝑅𝑅𝑅𝑅𝑅𝑅𝐴𝐴𝑅𝑅= 𝐹𝐹𝑀𝑀𝐹𝐹𝑅𝑅𝐹𝐹𝑀𝑀𝐺𝐺𝐺𝐺𝑅𝑅𝑅𝑅𝐺𝐺+ (𝑖𝑖𝑅𝑅𝐺𝐺𝐺𝐺𝑅𝑅𝑀𝑀𝑅𝑅𝑅𝑅𝑅𝑅𝑅𝑅𝑀𝑀𝐺𝐺𝐺𝐺𝑅𝑅𝑅𝑅𝐺𝐺 − 𝑖𝑖𝑅𝑅𝐺𝐺𝐺𝐺𝑅𝑅𝑀𝑀𝑅𝑅𝑀𝑀𝑀𝑀𝑖𝑖𝐺𝐺𝑖𝑖𝑅𝑅 𝑙𝑙𝑀𝑀𝑀𝑀𝑙𝑙𝑀𝑀𝑙𝑙𝑀𝑀𝑅𝑅𝑀𝑀𝑅𝑅𝐺𝐺)
The norm of the profit target is set in the budgets of each departments, Next to that, the profit is a common target for every employee since the annual profit of HDE is represented in the personal bonus calculation. The norm of the RONAE in 2015 is set on >18%. The current RONAE of 2015, up to quarter three is 21.8%. Regarding the phase in and out process, one KPI is set, the GPROI (see Section 1.2 for definition). Its norm is dependent on the product line it is set for. This is roughly >2 for hardware and >1 for fabrics. It is considered, however, that a GPROI of 1 for fabrics is already difficult to achieve. This can be explained by the fact that Hunter Douglas has stock for every fabric. When a new collection is phased in, collection books are made. The collection books, which include actual fabrics, are distributed across dealers. This means that for the purpose of making the collection books with fabrics, orders for each fabric is placed. For some uncommon colors, the orders for filling the collections books are (almost) the only orders in its lifecycle. This will directly result in obsolete stock, which decreases the GPROI. The contrary applies for hardware, because this is more common across products than the fabrics. On overview of the GPROI of the four major product lines can be seen below. As can be seen, the product lines perform very differently and not all GPROI targets are achieved.
Table 3-1: Overview of GPROI per September 2015 of four major product lines
GPROI PER SEPTEMBER 2015
PRODUCT LINE Hardware Fabric
401 - VENETIAN BLINDS 1.45 -
404 - ROLLER BLINDS 0.64 0.48
426 - DUETTE SHADES - 3.11
429 - PLISSÉ SHADES 3.71 0.42
20 | M a s t e r T h e s i s – M . K . v a n d e r H o e v e n
gross profit by the average inventory. Then, by lowering the obsolete costs, not only the obsolete stock, which influences the average stock, is lowered, but also the gross profit is increased. This is because the obsolete costs are depreciated on the account of the sales unit, which presses on their profit margin.
To identify which activities are of influence of the obsolete costs, an analysis of the stock reservation for obsolete inventory is made in the following section.
3.2
O
BSOLETE COSTS ANALYSISHunter Douglas makes financial reservations for the stock that is or can become obsolete. The portion of stock for which a reservation is made and the value of that reservation is determined by rules. These rules are:
Stock type; description Reservation value
- Obsolete; articles with MRP type PO: 100% stock value
- Non-mover; 24 months no sales: 100% stock value
- Slow mover; stock is higher than sales of past 12 months: 50% of the surplus stock
value >12 months + 50% of the surplus stock value >24 months
The way the reservation value for slow movers is calculated can be unclear, so an example is given in the table below.
Table 3-2: Example of reservation calculation for a slow moving article
ARTICLE RC TRANSMITTER
STOCK QUANTITY 9,324
STOCK VALUE € 35,825
SALES PAST 12 MONTHS 378
SALES PAST 24 MONTHS 882
SURPLUS STOCK FOR 12 MONTHS (9,324 - 378) 8,946
VALUE OF SURPLUS STOCK FOR 12 MONTHS € 34,372
SURPLUS STOCK FOR 24 MONTHS (9,324 - 882) 8,442
VALUE OF SURPLUS STOCK FOR 24 MONTHS € 32,436
RESERVATION VALUE (50% OF 34,372 + 50% OF 32,436) € 33,404
21 | M a s t e r T h e s i s – M . K . v a n d e r H o e v e n
Figure 3-1: Total stock value and reservation of finished products, split over product line groups, over January - September 2015
As can be seen in the figure above, the total stock value (sum of first column) of €34,539,000 is for 80% made up by decorative window covering products (DWCP). Next to that, the reservation value (last column) of the DWCP is 79% of the total reservations made. Therefore, it can be concluded that the DWCP has the biggest impact on the total obsolete costs at HDE.
[image:31.595.69.527.72.356.2]To deepen the analysis, the DWCP product line group is split into its individual product lines to determine which product lines have the biggest impact within the group. This is shown in Figure 3-2. As can be seen in the first column, the product lines Roller Blinds, Venetian Blinds, and Plissé Shades have a combined stock value of €21,731,000 which is 79% of the total stock value of the DWCP and even 63% of the grand total. These three product lines are responsible for 83% (last column) of the reservations made for DWCP and for 65% of the overall reservations.
Figure 3-2: Total stock value and reservation of DWCP over January - September 2015
Total Obsoletes No Movers New Stock MovingSlow CurrentStock ReservationValue
Total industrial 48 - 3 11 - 33 3
Total feedstock 104 - - - 20 84 0
Total AP facade 834 - 101 139 231 364 218
Total AP sun control 789 65 18 45 350 312 273
Total AP ceilings 3.049 23 129 173 916 1.807 659
Total FWCP 2.243 19 163 39 704 1.319 481
Total DWCP 27.471 820 905 2.039 8.104 15.604 5.997
0% 10% 20% 30% 40% 50% 60% 70% 80% 90% 100%
STOCK OVERVIEW, JAN - SEPT 2015 (€ x 1,000)
Explanation legend Figure 3-1
- Industrial: raw materials which are sold to third parties- Feedstock: bulk raw materials for production processes of own products - AP facade: architectural projects facade; external panels to cover buildings
- AP sun control: architectural projects sun control; outside sun screens focused on offices etc.
- AP ceilings: architectural projects ceilings; metal ceiling systems focused on offices etc. - FWCP: functional window covering products; focused on the B2B sales, e.g., outside
venetian blinds
22 | M a s t e r T h e s i s – M . K . v a n d e r H o e v e n
To identify which production strategy is accountable for the obsolete costs, the articles from the three above mentioned product lines are analyzed. It is chosen to focus on the articles that are slow moving, non-moving or obsolete since only stock reservations are made for these types. It is expected that make to stock items are the major contributor to the costs, but an analysis is done to quantify this assumption. The analysis is done as follows:
1. Determine the articles that are responsible for 80% of the reservation value
2. From this set of articles, randomly select 10%
3. With this final selection, count whether an article is/was MTS, MTO, or ETO
[image:32.595.47.554.73.410.2]The results of the analysis can be found in Table 3-2. When only MTS articles were found, another random 10% was checked to see if this occurred by chance. For both Roller Blinds and Plissé Shades also the second time only MTS articles were found. As can be seen in the table below, as expected, the major contributor to the stock reservation are make to stock items.
Table 3-3: Production strategy analysis of three product lines with major contribution to obsolete costs
Product line Article % that make up 80%
reservation value # articles analyzed % MTS % MTO % ETO
401 - Venetian Blinds 29% 75 96% 4% 0%
404 - Roller Blinds 28% 25 100% 0% 0%
429 - Plissé Shades 25% 27 100% 0% 0%
Now that is known which category (DWCP), which product lines (Roller Blinds, Venetian Blinds, and Plissé Shades), and production strategy type (MTS) are the major contributors to the obsolete costs,
Total Obsoletes No Movers New Stock Slow Moving Current Stock ReservationValue
Skylight Blinds 198 - 0 14 44 140 15
Panel Tracks 23 23 - - - - 23
Roman Shades 182 15 28 0 37 102 61
Wood Blinds 153 14 16 - 54 70 59
Facette Shades 332 - 40 143 85 64 76
Non HD WCP 353 21 13 6 125 189 117
Motorisation & Controls 409 29 6 74 133 168 86
Vertical Venetian Blinds 1.634 12 110 17 679 817 472
Duette Shades 2.454 17 10 256 230 1.941 137
Plissé Shades 6.359 511 38 320 1.621 3.869 1.292
Venetian Blinds 6.508 163 386 628 1.524 3.807 1.393
Roller Blinds 8.863 16 257 582 3.571 4.437 2.268
0% 10% 20% 30% 40% 50% 60% 70% 80% 90% 100%
23 | M a s t e r T h e s i s – M . K . v a n d e r H o e v e n
the factors, under the major contributors, that are of influence on these costs can be analyzed. Therefore a problem knot is made. This knot, including detailed information, is presented in the following section.
3.3
PROBLEM KNOT
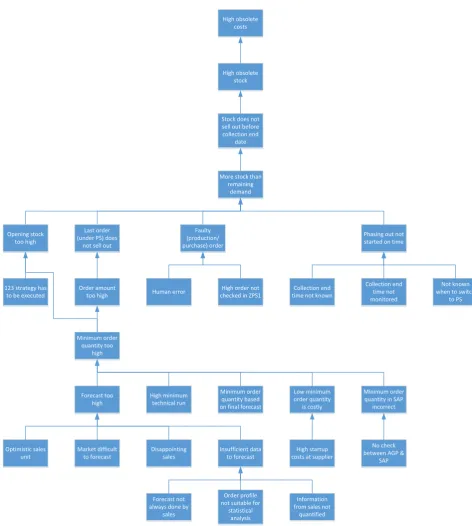
In this section, the problem knot is presented and explained in detail. Also, practical examples are given of the factors that in the end influence the obsolete costs. The problem knot is shown below.
High obsolete costs
High obsolete stock
Stock does not sell out before collection end
date
More stock than remaining
demand
Opening stock too high
Last order (under PS) does
not sell out
Faulty (production/ purchase) order
Phasing out not started on time
123 strategy has
to be executed Order amount too high Human error checked in ZPS1High order not time not knownCollection end
Collection end time not monitored
Not known when to switch
to PS
Minimum order quantity too
high
Forecast too
high High minimum technical run
Minimum order quantity based on final forecast
Low minimum order quantity
is costly
Minimum order quantity in SAP
incorrect
Market difficult to forecast Optimistic sales
unit Disappointing sales Insufficient data to forecast costs at supplierHigh startup
No check between AGP &
SAP
Order profile not suitable for
statistical analysis Forecast not
always done by sales
Information from sales not
[image:33.595.74.547.207.734.2]quantified
24 | M a s t e r T h e s i s – M . K . v a n d e r H o e v e n
The main problem are the high obsolete costs. Logically, this is caused by the fact that there is more stock left than that there is demand. This problem is split into four causes:
• Opening stock too high;
• Last production/purchase order (under PS) does not sell out;
• Faulty (production/purchase) order;
• Phasing out not started on time.
The first two causes mentioned fall under the cause that a MOQ is too high. The causes and practical examples of these three causes are treated in the sections below.
3.3.1 Minimum order quantity too high
A high minimum order quantity is one of the main reasons that the inventory is too high. As mentioned before, a significant part of the obsolete stock is due to decisions made at the introduction phase. This is because when an article already starts with more stock than its total lifecycle demand, obsolete stock is inevitable. This resembles a simple newsvendor problem, where extra stock at the end of a period is salvaged. There are many causes for a high MOQ, namely: there is a high minimum technical run, a low MOQ is costly, the MOQ is based on the full forecast, the MOQ in SAP is incorrect, or the forecast is too high.
The minimum technical run is the minimum output quantity of a process. This quantity is established by the parameters of the production process and cannot be influenced by decisions under these parameters. Changing the production process, however, can lower the minimum technical run, but can be costly. This problem occurs a lot with fabrics, where a high technical run is standard. E.g., the production process of fabrics at Artex uses a chain to pull the fabric through the machine. This chain has a length of approximate 200 meters, and therefore the minimum technical run will be 200 meters. The quantity is usually too high for special colors with low forecasts.
Following this, a low MOQ can be costly. Usually, the costs of a product are made up from fixed and variable costs. The fixed costs enlist, amongst others, the startup costs of the process. When these costs are divided by more output (e.g. meters, pieces, etc.) the cost per output is lower. Therefore, the procurement department (in collaboration with the expert centers) tries to negotiate lower cost prices by promising higher orders. This results in high minimum order quantities, which are contracted. This problem is enhanced by the expert centers. It has happened that article owners communicated a higher artificial forecast to ensure a lower cost price (Schuurs, 2015).
As stated above, the procurement department uses the forecast, which is entered on the AGP, to negotiate the MOQ while contracting suppliers. The forecast that is entered on the AGP is the expected quantity to be sold when the article is in its maturity phase. The quantity that is (expected to be) sold in the introduction phase, however, is much lower. Therefore, using the final forecast to negotiate a MOQ often results in high inventory levels in the introduction phase, which creates abundant risk, especially when the forecast fall out to be too high. Another cause for a high MOQ is when the value that is entered in SAP is higher than the MOQ that is contracted. This results in consequently higher orders than is necessary. This can occur because there is no final check between the data on the AGP and the data entered in SAP.