WORKING PAPERS SERIES
WP06-22
Risk bubbles and market instability
Matteo Marsili
a,1and Giacomo Ra
ff
aelli
baAbdus Salam International Centre for Theoretical Physics, Strada Costiera 11,
Trieste, Italy
bDip.to Fisica, Univ. Roma “La Sapienza”, P.le A. Moro, Roma, Italy
Abstract
We discuss a simple model of correlated assets capturing the feedback effects in-duced by portfolio investment in the covariance dynamics. This model predicts an instability when the volume of investment exceeds a critical value. Close to the crit-ical point the model exhibits dynamcrit-ical correlations very similar to those observed in real markets. Maximum likelihood estimates of the model’s parameter for empir-ical data indeed confirms this conclusion. We show that this picture is confirmed by the empirical analysis for different choices of the time horizon.
Globalization and the informatics revolution have expanded the reach and den-sity of financial interactions to an unprecedented extent. At the same time, the complexity of financial instruments has increased in complexity at a much faster pace than our understanding of their consequences on the collective be-havior. Somewhat at odds with this, most financial instruments are designed under the assumption that market prices are exogenous processes, i.e. that in-dividuals have no impact at all on the market. Such a price taking assumption might be a good approximation for the individual investor. But, if a particular strategy is used by many traders it will likely have a sizeable impact on the market.
the point where its susceptibility diverges, implying that the market reacts with a finite response even to infinitesimal perturbations. Interestingly, close to this point Minority Game models exhibit anomalous fluctuations phenom-ena [2] which bear some resemblance with the stylized facts observed in real markets[3].
We have recently shown [4] that this picture extends, qualitatively, to multi-asset markets described by a very simple model. Considerations about risk are essential in this extension2. One of the key functions of financial markets is indeed that of allowing companies to “trade” their risk for return, by spread-ing it across financial investors. Investors on their side, diversify (i.e. spread) their strategies across stocks so as to minimize risk, as postulated by portfolio optimization theory [5]. Ref. [4] discusses how the market is affected, when many agents spread their risk on the market following portfolio theory.
From the point of view of risk, the key quantity of interest is the covariance matrix of asset returns. Much attention has been recently put into the charac-terization of the statistical properties of the covariance matrix ˆC (at the daily scale in most cases): The key findings are that
• The bulk of the eigenvalue distribution of ˆC is dominated by noise and it is well described by random matrix theory [6].
• The largest eigenvalueΛ– the so-calledmarket mode– is very well separated from the other eigenvalues.
• The few large eigenvalues smaller than Λ, which leak out of the noise back-ground contain significant economic information. Indeed the taxonomy of assets built [7–10] from financial correlations alone bears remarkable simi-larity with a classification in economic sectors.
• market correlations also exhibit highly non-trivial dynamics: correlations “build up” as the time scale on which returns are measured increases, and they saturate for returns on the scale of some days [11,12]. Furthermore, financial correlations are persistent over time [13] and they follow recurrent patterns [10].
Fig. 1a shows the time dependence of the largest eigenvalue of (the exponen-tially averaged) correlation matrix of daily returns for Toronto Stock Exchange [14]. Similar behaviour has been reported earlier [15] for different markets. A closer look [4] at the data in Fig. 1 shows that fluctuations in the largest eigenvalueΛ(t+ 1)−Λ(t) are broadly distributed, suggesting that Fig. 1a can hardly be explained entirely as the effect of few exogenous shocks.
Ref. [4] formulates the hypothesis that such non-trivial dynamics arises as a
2 Most models of single asset markets focus on speculation and expected return.
consequence of the internal market dynamics. The efficiency of portfolio op-timization depends on the cross correlations among the stocks the financial market is composed of. But if such optimal portfolio strategies are used by many investors, this will have a sizeable impact on the market. This affects not only price dynamics, but also the very correlations on which these strate-gies depend. Hence financial correlations enter into a feedback loop because they determine in part those trading strategies which contribute to the price dynamics, i.e. to the financial correlations themselves.
0 0.01 0.02 0.03 0.04 0.05
Λ
a
0 0.01 0.02 0.03 0.04
0 400 800 1200 1600
Λ
t
[image:4.612.157.414.169.340.2]b
Fig. 1. Maximum eigenvalue of the correlation matrix as a function of time for
τ = 50. a) Toronto Stock exchange [14]. Here the correlation matrix is obtained using Eqs.(3) and (4) with|δxt! taken from historical data. b) simulation of Eq.(1)
withN = 20, R= 10−2,B = 10−6,∆= 0.04,#= 10−1,W = 1.4. Components of |b! were generated uniformly in the interval [0,2·10−3], resulting inW∗ ≈1.41.
The above chain of considerations is captured by a simple phenomenological model [4] aimed at reproducing in a simple yet plausible way the interaction among assets, and the resulting correlations induced by portfolio investment. We consider a market of N assets and we denote by |xt" the vector of
log-prices[16] in day t. This undergoes the dynamics
|xt+1"=|xt"+|βt"+ξt|zt". (1)
where |βt" is the vector of bare returns, i.e. it describes the fundamental
eco-nomic processes which drive the prices. This is assumed to be a Gaussian random vector with E[|βt"] =|b", E[|βt"#βt!|] =|b"#b|+ ˆBδt,t!, where |b" and
ˆ
B are parameters describing the “bare” economic correlations. The last term in Eq. (1) describes the component of trading activity along Markovitz’s op-timal portfolio. ξt is an independent Gaussian variable with mean $and
vari-ance ∆and |zt" is the optimal portfolio with fixed returnR and total wealth
min
|z#,ν,σ !1
2#z|Cˆt|z" −ν(#z|rt" −R)−σ(#z|1" −W)
"
(2)
where ˆCtis the correlation matrix at timet. Both the expected returns|rt"and
the correlation matrix ˆCt, which enter Eq. (2), are computed from historical
data over a characteristic time τ:
|rt"= (e
1
τ −1)#
t!<t
e−t−τt!|δxt" (3)
ˆ
Ct= (e
1
τ −1)#
t!<t
e−t−τt!|δx
t"#δxt|−|rt"#rt| (4)
where |δxt" ≡ |xt" −|xt−1". This makes the set of equations above a
self-contained dynamical stochastic system. In a nutshell, it describes in a simple way how the economic bare correlated fluctuations|βt"aredressedby financial
investment. Note that:
• the optimal portfolio is usually computed from the expected covariance and returns. The model assumes that one can use historical covariance and re-turns as a proxy for expected ones
• traders have different time horizons in the market whereas the model as-sumes that all investors have the same trading horizon τ
• a simple linear impact function for the price dynamics is assumed
• a dependence on |δzt" = |zt" − |zt−1" can also be envisaged. Indeed, one may think that Eq. (1) contains just the first term in an expansion in time derivatives of |zt". The rationale for neglecting these terms is that they
are less relevant with respect to the |zt" term, as far as the low frequency
behavior of the model is concerned
• the structure of economic correlations is neglected, i.e.Bi,j =Bδi,j. The idea
behind this is that economic correlations contribute to eigenvalues which are much smaller than the market mode, and hence, to a first approximation are indistinguishable from the noise band. At any rate, economic correlations are expected to change over time scales much longer than those over which the market mode fluctuates. This means that it is unlikely that they contribute in any appreciable way to the dynamics observed in Fig. 1.
• one can consider several component |zk
t" of portfolio investors, each with a
different parameters Rk, $k and ∆k. This model can be reduced to the one
above, with effective parameters ˜R, ˜$ and ˜∆
• |zt" is a quantity, not a percentage as in portfolio theory [5].
in Λ show a clear power-law behaviour, again very similar to the one we get for real markets.
In the limit τ → ∞, where correlations and returns are computed averaging over an infinite time period, the model can be solved analytically [4]. One finds a singular behavior ofΛ when the volume W of investment in portfolio strategies reaches a critical value W∗. Indeed as W → W∗ the solution de-velops a singularity with infinite slope ∂Λ
∂W → ∞. This is reminiscent of the
divergence of susceptibilityχclose to a phase transition, signalling that the re-sponse δΛ=χδW to a small perturbationδW diverges asW →W∗. A static solution ceases to exist in the τ → ∞ limit for W > W∗. This can be seen from a simple geometric argument: For $ = 0 the two constraints #z|1" =W
and #z|r" = R are hyper-planes in the |z" space, hence a solution exists for all W and R. With $ '= 0, the constraint #z|r" = R becomes a hyper-sphere hence, solutions are possible only forW < W∗.
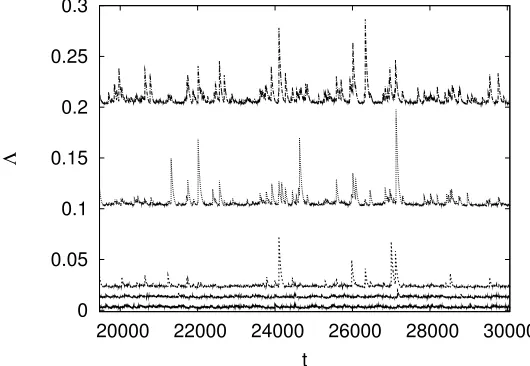
Numerical simulations show that W∗ represents a threshold to the amount of wealth that can be invested by risk-minimization into a market without destabilizing it. This is clearly seen in Fig. 2 where we reportΛt as a function
of time for values ofW approachingW∗. Within the picture offered by the this simple model, Fig. 1 suggests that real markets might be close to the critical point W∗. This has been checked [4] by fitting real market data [14] with a maximum likelihood method. The whole method was checked to reproduce the correct parameters on synthetic data set generated from the model itself.
0 0.05 0.1 0.15 0.2 0.25 0.3
20000 22000 24000 26000 28000 30000
Λ
[image:6.612.156.421.381.564.2]t
Fig. 2. Maximum eigenvalue of ˆC as a function of time for different values of W (W = 1.2, 1.32, 1.42 and 1.48 from bottom to top) and the same parameters as in Fig. 1 (W∗ ≈1.42). Curves are shifted upwards for clarity.
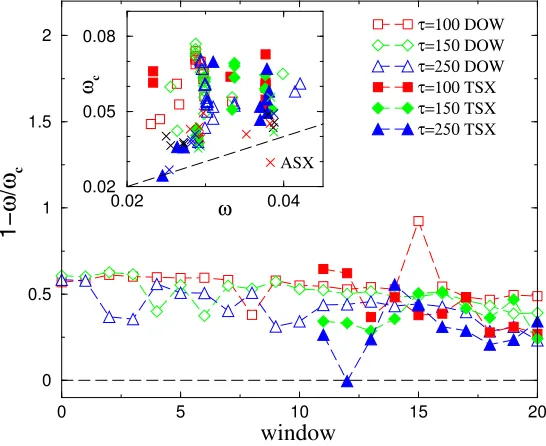
τ on different time windows of T = 500 days. Fig. 3 shows the results for the Dow Jones and the Toronto stock exchange indices. Each window is shifted by 50 days with respect to the previous one, so the data covers approximately 4 years (in order to compute the initial condition for ˆCt, we used data for 1000
more days). In this time period (1997-2005), no major crashes or structural changes occurred in these markets. The same cannot be said of European markets, because of the introduction of the Euro.
The main figure shows that parameters exhibit some fluctuations but are roughly constant over a long time horizon (the longer time series of the Dow Jones actually displays a very slow convergence toW∗ in time). The parame-ters are also stable with respect to changes inτ. The inset shows the location of the fitted parameters with respect to critical point. Results for the same market cluster in the same region for different values ofτ.
0.02 ω 0.04
0.02 0.05 0.08
ωc
ASX
0 5 10 15 20
window 0
0.5 1 1.5 2
1
−
ω
/
ωc
[image:7.612.154.427.227.450.2]τ=100 DOW τ=150 DOW τ=250 DOW τ=100 TSX τ=150 TSX τ=250 TSX
Fig. 3. Fitted values of the parametersω =#W and ωc =#W∗ for successive time
windows ofT = 500 points τ = 100,150 and 250 and different markets (DJ, TSX, ASX). The main figure shows the distance from the critical point as a function of time. The time window is shifted by 50 days for each point. Inset: ωc vs ω for the
same data sets.
the structure of correlations with which that strategy was computed. This component of risk diverges as the market approaches the critical point W∗, thus discouraging further investment. This provides a simple rationale for why markets “self-organize” close to the critical point, which is somewhat reminiscent of the picture which Minority Games [1] provide of single asset markets. The idea is that the market attracts investors as long as it provides efficient ways of diversifying risk. This increases the volume (W) of investment up to the point where the risk measure changes thus turning optimal portfolio strategies into sub-optimal ones.
This is a further case where, when the density of interactions increases, the system approaches a critical state where individual actions might propagate through the system in an unpredictable manner [17]. In such systems, actions might be so remotely related to their ultimate consequences to make even the most sophisticated optimizing behavior or design chimerical.
References
[1] Challet D., Marsili M. and Zhang Y-C.Minority Games. Interacting agents in financial marketsOxford University Press (Oxford, 2004)
[2] Challet D. and Marsili M. Phys. Rev. E68(3) 036132 (2003)
[3] J.-P. Bouchaud and M. PottersTheory of financial risk and derivative pricing: from statistical physics to risk management (Cambridge University Press, Cambridge, 2003); R. Mantegna and E. Stanley,Introduction to Econophysics
(Cambridge University Press, 1999).
[4] G. Raffaelli and M. Marsili, eprintphysics/0508159.
[5] Elton E.J. and Gruber M.J.,Modern Portfolio theory and investment analysis
(J. Wiley & sons, New York, 1995).
[6] Laloux L, Cizeau P, Bouchaud JP, Potters M Phys. Rev. Lett. 83 (7) 1467-1470 (1999) and Plerou V, Gopikrishnan P, Rosenow B, Amaral LAN, Stanley HE Phys. Rev. Lett. 83(7) 1471-1474 (1999)
[7] Bonanno G, Caldarelli G, Lillo F, Mantegna RN, Phys. Rev. E 68 4, 046130 (2003)
[8] Plerou V, Gopikrishnan P, Rosenow B, Amaral N.A.N. and Stanley H.E., Phys. Rev. Lett.83(7) 1471-1474 (1999).
[9] Giada L. and Marsili M. Phys. Rev. E 63(6) 061101 (2001)
[10] Marsili M. Quant. Fin.2 297-302 (2002)
[12] Potters M. , Bouchaud J.P. and Laloux L., cond-mat/0507111
[13] Onnela JP, Chakraborti A, Kaski K, Kertesz J, Kanto A, Phys. Rev. E68(5) 056110 (2003)
[14] Data was taken form finance.yahoo.com in the time period June 16th 1997 to May 25th 2005 for all assets except for the Dow Jones, for which we used May 2nd 1995 to May 23rd 2005. Correlations were measured on the set of assets composing the index at the final date.
[15] Drodz S, Kwapien J, Grummer F, Ruf F and Speth J, Phys. A 299 (1-2), 144-153 (2001) and Drodz S, Grummer F, Ruf F and Speth J, Phys. A 294 (1-2), 226-234 (2001).
[16] We use Bra-ket notation:|x!should be considered as a column vector, whereas
#x|is a row vector. Hence #x|y! is the scalar product and |x!#y| is the direct product, i.e. the matrix with entriesai,j =xiyj.
!
!"#$%&'()*)+#,(,+#%+,(
(
List of other working papers:
2006
1. Roman Kozhan, Multiple Priors and No-Transaction Region, WP06-24
2. Martin Ellison, Lucio Sarno and Jouko Vilmunen, Caution and Activism? Monetary Policy Strategies in an Open Economy, WP06-23
3. Matteo Marsili and Giacomo Raffaelli, Risk bubbles and market instability, WP06-22
4. Mark Salmon and Christoph Schleicher, Pricing Multivariate Currency Options with Copulas, WP06-21
5. Thomas Lux and Taisei Kaizoji, Forecasting Volatility and Volume in the Tokyo Stock Market: Long Memory, Fractality and Regime Switching, WP06-20
6. Thomas Lux, The Markov-Switching Multifractal Model of Asset Returns: GMM Estimation and Linear Forecasting of Volatility, WP06-19
7. Peter Heemeijer, Cars Hommes, Joep Sonnemans and Jan Tuinstra, Price Stability and Volatility in Markets with Positive and Negative Expectations Feedback: An Experimental Investigation, WP06-18
8. Giacomo Raffaelli and Matteo Marsili, Dynamic instability in a phenomenological model of correlated assets, WP06-17
9. Ginestra Bianconi and Matteo Marsili, Effects of degree correlations on the loop structure of scale free networks, WP06-16
10.Pietro Dindo and Jan Tuinstra, A Behavioral Model for Participation Games with Negative Feedback, WP06-15
11.Ceek Diks and Florian Wagener, A weak bifucation theory for discrete time stochastic dynamical systems, WP06-14
12.Markus Demary, Transaction Taxes, Traders’ Behavior and Exchange Rate Risks, WP06-13 13.Andrea De Martino and Matteo Marsili, Statistical mechanics of socio-economic systems with
heterogeneous agents, WP06-12
14.William Brock, Cars Hommes and Florian Wagener, More hedging instruments may destabilize markets, WP06-11
15.Ginwestra Bianconi and Roberto Mulet, On the flexibility of complex systems, WP06-10 16.Ginwestra Bianconi and Matteo Marsili, Effect of degree correlations on the loop structure of
scale-free networks, WP06-09
17.Ginwestra Bianconi, Tobias Galla and Matteo Marsili, Effects of Tobin Taxes in Minority Game Markets, WP06-08
18.Ginwestra Bianconi, Andrea De Martino, Felipe Ferreira and Matteo Marsili, Multi-asset minority games, WP06-07
19.Ba Chu, John Knight and Stephen Satchell, Optimal Investment and Asymmetric Risk for a Large Portfolio: A Large Deviations Approach, WP06-06
20.Ba Chu and Soosung Hwang, The Asymptotic Properties of AR(1) Process with the Occasionally Changing AR Coefficient, WP06-05
21.Ba Chu and Soosung Hwang, An Asymptotics of Stationary and Nonstationary AR(1) Processes with Multiple Structural Breaks in Mean, WP06-04
22.Ba Chu, Optimal Long Term Investment in a Jump Diffusion Setting: A Large Deviation Approach, WP06-03
23.Mikhail Anufriev and Gulio Bottazzi, Price and Wealth Dynamics in a Speculative Market with Generic Procedurally Rational Traders, WP06-02
24.Simonae Alfarano, Thomas Lux and Florian Wagner, Empirical Validation of Stochastic Models of Interacting Agents: A “Maximally Skewed” Noise Trader Model?, WP06-01
2. Mark Salmon, Gordon Gemmill and Soosung Hwang, Performance Measurement with Loss Aversion, WP05-16
3. Philippe Curty and Matteo Marsili, Phase coexistence in a forecasting game, WP05-15
4. Matthew Hurd, Mark Salmon and Christoph Schleicher, Using Copulas to Construct Bivariate
Foreign Exchange Distributions with an Application to the Sterling Exchange Rate Index (Revised), WP05-14
5. Lucio Sarno, Daniel Thornton and Giorgio Valente, The Empirical Failure of the Expectations
Hypothesis of the Term Structure of Bond Yields, WP05-13
6. Lucio Sarno, Ashoka Mody and Mark Taylor, A Cross-Country Financial Accelorator: Evidence
from North America and Europe, WP05-12
7. Lucio Sarno, Towards a Solution to the Puzzles in Exchange Rate Economics: Where Do We
Stand?, WP05-11
8. James Hodder and Jens Carsten Jackwerth, Incentive Contracts and Hedge Fund
Management, WP05-10
9. James Hodder and Jens Carsten Jackwerth, Employee Stock Options: Much More Valuable
Than You Thought, WP05-09
10.Gordon Gemmill, Soosung Hwang and Mark Salmon, Performance Measurement with Loss
Aversion, WP05-08
11.George Constantinides, Jens Carsten Jackwerth and Stylianos Perrakis, Mispricing of S&P
500 Index Options, WP05-07
12.Elisa Luciano and Wim Schoutens, A Multivariate Jump-Driven Financial Asset Model,
WP05-06
13.Cees Diks and Florian Wagener, Equivalence and bifurcations of finite order stochastic
processes, WP05-05
14.Devraj Basu and Alexander Stremme, CAY Revisited: Can Optimal Scaling Resurrect the
(C)CAPM?, WP05-04
15.Ginwestra Bianconi and Matteo Marsili, Emergence of large cliques in random scale-free
networks, WP05-03
16.Simone Alfarano, Thomas Lux and Friedrich Wagner, Time-Variation of Higher Moments in a
Financial Market with Heterogeneous Agents: An Analytical Approach, WP05-02
17.Abhay Abhayankar, Devraj Basu and Alexander Stremme, Portfolio Efficiency and Discount
Factor Bounds with Conditioning Information: A Unified Approach, WP05-01
2004
1. Xiaohong Chen, Yanqin Fan and Andrew Patton, Simple Tests for Models of Dependence
Between Multiple Financial Time Series, with Applications to U.S. Equity Returns and Exchange Rates, WP04-19
2. Valentina Corradi and Walter Distaso, Testing for One-Factor Models versus Stochastic
Volatility Models, WP04-18
3. Valentina Corradi and Walter Distaso, Estimating and Testing Sochastic Volatility Models
using Realized Measures, WP04-17
4. Valentina Corradi and Norman Swanson, Predictive Density Accuracy Tests, WP04-16
5. Roel Oomen, Properties of Bias Corrected Realized Variance Under Alternative Sampling
Schemes, WP04-15
6. Roel Oomen, Properties of Realized Variance for a Pure Jump Process: Calendar Time
Sampling versus Business Time Sampling, WP04-14
7. Richard Clarida, Lucio Sarno, Mark Taylor and Giorgio Valente, The Role of Asymmetries and
Regime Shifts in the Term Structure of Interest Rates, WP04-13
8. Lucio Sarno, Daniel Thornton and Giorgio Valente, Federal Funds Rate Prediction, WP04-12
9. Lucio Sarno and Giorgio Valente, Modeling and Forecasting Stock Returns: Exploiting the
Futures Market, Regime Shifts and International Spillovers, WP04-11
10.Lucio Sarno and Giorgio Valente, Empirical Exchange Rate Models and Currency Risk: Some
Evidence from Density Forecasts, WP04-10
11.Ilias Tsiakas, Periodic Stochastic Volatility and Fat Tails, WP04-09
12.Ilias Tsiakas, Is Seasonal Heteroscedasticity Real? An International Perspective, WP04-08
13.Damin Challet, Andrea De Martino, Matteo Marsili and Isaac Castillo, Minority games with
15.Andrew Patton and Allan Timmermann, Properties of Optimal Forecasts under Asymmetric Loss and Nonlinearity, WP04-05
16.Andrew Patton, Modelling Asymmetric Exchange Rate Dependence, WP04-04
17.Alessio Sancetta, Decoupling and Convergence to Independence with Applications to
Functional Limit Theorems, WP04-03
18.Alessio Sancetta, Copula Based Monte Carlo Integration in Financial Problems, WP04-02
19.Abhay Abhayankar, Lucio Sarno and Giorgio Valente, Exchange Rates and Fundamentals:
Evidence on the Economic Value of Predictability, WP04-01
2002
1. Paolo Zaffaroni, Gaussian inference on Certain Long-Range Dependent Volatility Models,
WP02-12
2. Paolo Zaffaroni, Aggregation and Memory of Models of Changing Volatility, WP02-11
3. Jerry Coakley, Ana-Maria Fuertes and Andrew Wood, Reinterpreting the Real Exchange Rate
- Yield Diffential Nexus, WP02-10
4. Gordon Gemmill and Dylan Thomas , Noise Training, Costly Arbitrage and Asset Prices:
evidence from closed-end funds, WP02-09
5. Gordon Gemmill, Testing Merton's Model for Credit Spreads on Zero-Coupon Bonds,
WP02-08
6. George Christodoulakis and Steve Satchell, On th Evolution of Global Style Factors in the
MSCI Universe of Assets, WP02-07
7. George Christodoulakis, Sharp Style Analysis in the MSCI Sector Portfolios: A Monte Caro
Integration Approach, WP02-06
8. George Christodoulakis, Generating Composite Volatility Forecasts with Random Factor
Betas, WP02-05
9. Claudia Riveiro and Nick Webber, Valuing Path Dependent Options in the Variance-Gamma
Model by Monte Carlo with a Gamma Bridge, WP02-04
10.Christian Pedersen and Soosung Hwang, On Empirical Risk Measurement with Asymmetric
Returns Data, WP02-03
11.Roy Batchelor and Ismail Orgakcioglu, Event-related GARCH: the impact of stock dividends
in Turkey, WP02-02
12.George Albanis and Roy Batchelor, Combining Heterogeneous Classifiers for Stock Selection,
WP02-01
2001
1. Soosung Hwang and Steve Satchell , GARCH Model with Cross-sectional Volatility; GARCHX
Models, WP01-16
2. Soosung Hwang and Steve Satchell, Tracking Error: Ex-Ante versus Ex-Post Measures,
WP01-15
3. Soosung Hwang and Steve Satchell, The Asset Allocation Decision in a Loss Aversion World,
WP01-14
4. Soosung Hwang and Mark Salmon, An Analysis of Performance Measures Using Copulae,
WP01-13
5. Soosung Hwang and Mark Salmon, A New Measure of Herding and Empirical Evidence,
WP01-12
6. Richard Lewin and Steve Satchell, The Derivation of New Model of Equity Duration,
WP01-11
7. Massimiliano Marcellino and Mark Salmon, Robust Decision Theory and the Lucas Critique,
WP01-10
8. Jerry Coakley, Ana-Maria Fuertes and Maria-Teresa Perez, Numerical Issues in Threshold
Autoregressive Modelling of Time Series, WP01-09
9. Jerry Coakley, Ana-Maria Fuertes and Ron Smith, Small Sample Properties of Panel
Time-series Estimators with I(1) Errors, WP01-08
10.Jerry Coakley and Ana-Maria Fuertes, The Felsdtein-Horioka Puzzle is Not as Bad as You
Think, WP01-07
Non-13.Frank Critchley, Paul Marriott and Mark Salmon, On Preferred Point Geometry in Statistics, WP01-04
14.Eric Bouyé and Nicolas Gaussel and Mark Salmon, Investigating Dynamic Dependence Using
Copulae, WP01-03
15.Eric Bouyé, Multivariate Extremes at Work for Portfolio Risk Measurement, WP01-02
16.Erick Bouyé, Vado Durrleman, Ashkan Nikeghbali, Gael Riboulet and Thierry Roncalli,
Copulas: an Open Field for Risk Management, WP01-01
2000
1. Soosung Hwang and Steve Satchell , Valuing Information Using Utility Functions, WP00-06
2. Soosung Hwang, Properties of Cross-sectional Volatility, WP00-05
3. Soosung Hwang and Steve Satchell, Calculating the Miss-specification in Beta from Using a
Proxy for the Market Portfolio, WP00-04
4. Laun Middleton and Stephen Satchell, Deriving the APT when the Number of Factors is
Unknown, WP00-03
5. George A. Christodoulakis and Steve Satchell, Evolving Systems of Financial Returns:
Auto-Regressive Conditional Beta, WP00-02
6. Christian S. Pedersen and Stephen Satchell, Evaluating the Performance of Nearest
Neighbour Algorithms when Forecasting US Industry Returns, WP00-01
1999
1. Yin-Wong Cheung, Menzie Chinn and Ian Marsh, How do UK-Based Foreign Exchange
Dealers Think Their Market Operates?, WP99-21
2. Soosung Hwang, John Knight and Stephen Satchell, Forecasting Volatility using LINEX Loss
Functions, WP99-20
3. Soosung Hwang and Steve Satchell, Improved Testing for the Efficiency of Asset Pricing
Theories in Linear Factor Models, WP99-19
4. Soosung Hwang and Stephen Satchell, The Disappearance of Style in the US Equity Market,
WP99-18
5. Soosung Hwang and Stephen Satchell, Modelling Emerging Market Risk Premia Using Higher
Moments, WP99-17
6. Soosung Hwang and Stephen Satchell, Market Risk and the Concept of Fundamental
Volatility: Measuring Volatility Across Asset and Derivative Markets and Testing for the Impact of Derivatives Markets on Financial Markets, WP99-16
7. Soosung Hwang, The Effects of Systematic Sampling and Temporal Aggregation on Discrete
Time Long Memory Processes and their Finite Sample Properties, WP99-15
8. Ronald MacDonald and Ian Marsh, Currency Spillovers and Tri-Polarity: a Simultaneous
Model of the US Dollar, German Mark and Japanese Yen, WP99-14
9. Robert Hillman, Forecasting Inflation with a Non-linear Output Gap Model, WP99-13
10.Robert Hillman and Mark Salmon , From Market Micro-structure to Macro Fundamentals: is
there Predictability in the Dollar-Deutsche Mark Exchange Rate?, WP99-12
11.Renzo Avesani, Giampiero Gallo and Mark Salmon, On the Evolution of Credibility and
Flexible Exchange Rate Target Zones, WP99-11
12.Paul Marriott and Mark Salmon, An Introduction to Differential Geometry in Econometrics,
WP99-10
13.Mark Dixon, Anthony Ledford and Paul Marriott, Finite Sample Inference for Extreme Value
Distributions, WP99-09
14.Ian Marsh and David Power, A Panel-Based Investigation into the Relationship Between
Stock Prices and Dividends, WP99-08
15.Ian Marsh, An Analysis of the Performance of European Foreign Exchange Forecasters,
WP99-07
16.Frank Critchley, Paul Marriott and Mark Salmon, An Elementary Account of Amari's Expected
Geometry, WP99-06
17.Demos Tambakis and Anne-Sophie Van Royen, Bootstrap Predictability of Daily Exchange
Rates in ARMA Models, WP99-05
18.Christopher Neely and Paul Weller, Technical Analysis and Central Bank Intervention,
20.Christopher Neely and Paul Weller, Intraday Technical Trading in the Foreign Exchange Market, WP99-02
21.Anthony Hall, Soosung Hwang and Stephen Satchell, Using Bayesian Variable Selection Methods to Choose Style Factors in Global Stock Return Models, WP99-01
1998
1. Soosung Hwang and Stephen Satchell, Implied Volatility Forecasting: A Compaison of Different Procedures Including Fractionally Integrated Models with Applications to UK Equity Options, WP98-05
2. Roy Batchelor and David Peel, Rationality Testing under Asymmetric Loss, WP98-04 3. Roy Batchelor, Forecasting T-Bill Yields: Accuracy versus Profitability, WP98-03
4. Adam Kurpiel and Thierry Roncalli , Option Hedging with Stochastic Volatility, WP98-02
![Fig. 1. Maximum eigenvalue of the correlation matrix as a function of time forτ = 50. a) Toronto Stock exchange [14]](https://thumb-us.123doks.com/thumbv2/123dok_us/9771615.478183/4.612.157.414.169.340/maximum-eigenvalue-correlation-matrix-function-toronto-stock-exchange.webp)