BB
Anja Reckermann
M.Sc. Business Administration Master Thesis Date: 20 June 2016
Colloquium Date: 28 June 2016
1. Supervisor: Dr. ir J. Kraaijenbrink
2. Supervisor: MSc. M.R. Stienstra
Firm Survival Explained by Causation,
Effectuation, and the Degree of Industry
ABSTRACT
This study analyses the relationship between the level of causation and effectuation as displayed in a firm’s business plan and the survival data on those firms taking the level of industry dynamism into account. It is hypothesized that effectuation and its sub-dimensions lead to more firm survival than causation and that businesses operating in environments showing higher levels of industry dynamism increase their chances of survival when they employ an effectual entrepreneurial approach. To test this, data on causation, effectuation and firm survival was collected by coding 228 business plans. Data on industry dynamism was obtained from allocating each business plan into a specific NAICS sector and then calculating the uncertainty value (i.e. industry dynamism) for each sector according to Ensley et al. (2006). The findings indicate that effectuation and partially industry dynamism can indeed explain firm survival, but causation seems to not contribute to the explanatory value of the models. Furthermore, it was established that businesses operating in higher uncertainty do not employ more effectuation to begin with.
Contents
Abstract ... 1
1. Introduction ... 4
2. Literature Review ... 5
2.1 Effectuation as a One-Dimensional Construct ... 5
2.2 Effectuation as a Multi-Dimensional Construct ... 7
2.3 Environmental Uncertainty ... 9
2.4 Uncertainty and Effectuation ... 10
3. Hypotheses... 10
4. Method ... 13
4.1 Data Collection ... 13
4.2 Measure of Firm Performance... 14
4.3 Coding Business Plans on Effectuation & Causation ... 14
4.4 Industry Dynamism ... 17
4.5 Analyses ... 18
5. Results ... 19
5.1 Descriptives ... 19
5.2 Hypothesis 1 ... 21
5.3 Post-hoc on Effectuation Sub-Dimension Partners ... 22
5.4 Hypothesis 2 ... 23
5.5 Post-hoc on Industry Dynamism of the Years 2005 – 2013 ... 23
5.6 Hypothesis 3 ... 24
5.7 Hypothesis 4 ... 24
5.8 Summary of Hypotheses ... 26
6.1 Limitations ... 30
6.2 Suggestions for Future Research ... 30
7. Conclusion ... 31
8. References ... 33
Appendix A: Coding Scheme Causation & Effectuation ... 35
Appendix B: Inter-Rater Reliability of Coding Scheme Business Plans ... 38
4
1. INTRODUCTION
Most research papers in the field of entrepreneurship are based on rational and goal-driven decision-making models as employed in neo-classical economics (Perry, 2012). Under this approach, termed causation, competitive advantage for emergent firms is achieved by searching for, discovering and exploiting opportunities that are within the control of the firm (Chandler & Jansen, 1992). Prediction plays a central role under this model in that it posits that through increased planning, an individual or firm is better positioned to predict the future, and can set themselves up to succeed (Wiltbank et al., 2009).
However, highly uncertain environments reduce both the accuracy and usefulness of prediction and call for a different approach to achieve a competitive advantage (Wiltbank et al., 2009; Gruber, 2007). In response to this, Sarasvathy introduced the concept of effectuation (2001) which is an alternative approach to new venture development. Effectuation is the paradigm of design rather than the paradigm of decision-making or discovery. It does neither require clear goals nor accurate predictions, but focuses on redrawing the problem space and on reconstituting existing realities into new opportunities (Dew et al., 2009). Under effectuation, control plays a central role and it is believed that by controlling the future, one does not need to predict it.
5
This paper will address both these issues and empirically test the relationship between entrepreneurial approach as displayed in a firm’s business plan and firm survival taking into account the moderating effect of industry dynamism.
To measure the level of causation and effectuation displayed, each business plan was coded using a specific coding scheme designed to measure the sub-dimensions of causation and effectuation. To measure industry dynamism, a purely objective measure of the environmental uncertainty, each business plan was assigned to a NAICS sector and the industry dynamism present in each sector was calculated through a formula according to Ensley et al. (2006), making use of regression coefficients. The results indicate that effectuation is indeed the more effective entrepreneurial approach for realizing firm survival, but there seems to be only a partial explanatory value of industry dynamism. Additional research into a more subjective measure of environmental uncertainty as well as into additional mitigating factors is required to gain more specific insights into the relationship between entrepreneurial approach, industry uncertainty and firm performance.
2. LITERATURE REVIEW
2.1 Effectuation as a One-Dimensional Construct
The traditional model of entrepreneurship draws largely on economic thinking to describe how an individual or firm takes entrepreneurial action. Under this model, the entrepreneur follows a linear process of discovery, evaluation and exploitation of opportunities which in turn lead to further planning activities (Shane and Venkataraman, 2000). This approach is termed causal reasoning and is based on the logic that, “to the extent [to which] we can
predict the future we can control it” (Sarasvathy, 2001, p. 251).
Causation has its roots in decision theory (Simon, 1959 In: Fisher, 2012) which posits that “if decision makers believe they are dealing with a measurable or relatively predictable future, they will tend to do some systematic information gathering and analysis within certain bounds” (Sarasvathy, 2001, p.252). Under causation, the entrepreneur first decides on a pre-determined goal and then selects between different means to achieve that goal (Sarasvathy, 2001).
6
evaluate opportunities prior to exploitation (Fisher, 2012). Sarasvathy addresses this issue in her paper (2001) and developed the concept of effectuation as an explanation for entrepreneurial activities under such conditions.
Effectuation is a logic of design rather than that of decision or discovery in that it contains a consistent set of ideas that forms a clear basis for action upon the world. Effectuation does not assume pre-determined goals. Instead, goals emerge from negotiations with stakeholders and in the process frequently transform into new goals. Further, effectuation reframes the initial set of opportunities the firm had intended to exploit and explicitly reshapes the environment the firm operates in. In short: effectuation is non-predictive in the sense that it does neither require accurate predictions, nor clear goals or an adaptive stance towards an exogenous environment (Dew et al., 2008).
[image:7.595.73.530.562.794.2]The two approaches can be contrasted as follows: Causal logic argues that better predictions lead to better control over outcomes (“to the extent we can predict the future, we do not need to control it”) while effectual logic is based upon the premise that to the extent each relevant stakeholder controls elements of the environment, investments in prediction are unnecessary (“to the extent we can control the future, we do not need to predict it”) (Sarasvathy, 2001, p. 252). The boundary condition for the causational strategy to be applicable is that the market for the product or service needs to be existent prior to exploitation. The pre-requisite for effectuation to be useful is a dynamic and nonlinear environment where the future is unknown and therefore not predictable (Fisher, 2012). Table 1 shows the main categories of differentiation of the two theories.
Table 1
Contrasting causation and effectuation (adapted from Sarasvathy, 2001)
Categories of
Differentiation Causation Processes Effectuation Processes
Givens Effect is given Only some means or tools are given
Decision-making selection criteria
Help choose between means to achieve the given effect
Help choose between possible effects that can be created with given means
Selection criteria based on expected return Selection criteria based on affordable loss or acceptable risk
Effect dependent: Choice of mean is driven by characteristics of the effect the decision maker wants to create and his or her knowledge of possible means
Actor dependent: Given specific means, choice of effect is driven by characteristics of the actor and his or her ability to discover and use contingencies Competencies
employed
7 Context of
relevance
More ubiquitous in nature More ubiquitous in human action
Most useful in static, linear and independent environments
Explicit assumption of dynamic, nonlinear, and ecological environments
Nature of unknowns
Focus on the predictable aspects of an uncertain future
Focus on the controllable aspects of an unpredictable future
Underlying logic To the extent we can predict the future, we can control it
To the extent we can control the future, we do not need to predict it
Outcomes Market share in existent markets through competitive strategies
New markets created through alliances and other cooperative strategies
Sarasvathy (2001) does not claim that effectuation is inherently superior to causation when it comes to performance, but postulates that it is likely to be more efficient in settings governed by higher levels of risk and uncertainty. Especially the finding that expert entrepreneurs use effectuation significantly more often than less experienced MBA students supports this tendency (Sarasvathy, 2001).
Which entrepreneurial approach promises the higher positive benefits therefore depends on the situation. Research on business planning points in the same direction. According to Gruber (2007), the value received from planning is largely dependent on three circumstances: the type of founding environment, the type of activities pursued in planning and the effort devoted to specific activities. The greatest benefits from planning can be derived in stable environments as entrepreneurs know what to plan for. In uncertain environments where the outcome is unpredictable, a more flexible approach and planning in a trade-off manner is more successful. (Gruber, 2007; Wiltbank, 2006).
2.2 Effectuation as a Multi-Dimensional Construct
While effectuation can be seen as one construct, Chandler et al. (2011) states that it is in fact a multidimensional construct. The four sub-constructs that effectuation is made of serve not only in understanding the concept of effectuation better, but also can be contrasted with the causational constructs to highlight in what areas the two theories differ. Each dimension can be considered as a dichotomous variable with effectuation on one end of the continuum, and causation on the other end, respectively. All effectual sides of the dimensions are designed to maximize the ability to control the future, all causational sides are designed to maximize prediction accuracy of the future.
8
Under effectuation, an individual or firm begins with a given set of means and focuses on generating new ends. Under causation, an individual or firm begins with selecting a goal and then chooses among existing means to achieve this goal.
2. Affordable loss as opposed to expected return
Effectual logic prescribes that the decisions are made based on the entrepreneur’s assessment of what they are willing to lose. This means that decision-makers focus on projects where, should a loss happen, this is affordable to them. Causational logic, on the other hand, is driven by the desire to maximize the expected return.
3. Partnerships as opposed to competitive analysis
An effectual entrepreneur favors pre-commitments and brings stakeholders into the equation as early into a project as possible. This often happens before a venture has even been created. As a result, the stakeholders take part in forming the venture and giving it a direction. In contrast, causal entrepreneurs start with defining and analyzing the market through detailed competitive analyses and only after that make decisions on which stakeholders to pursue.
4. Leveraging contingencies as opposed to avoiding contingencies
Under effectuation, an entrepreneur is prepared to leverage both positive and negative contingencies and is adaptive enough to transform them into useful elements of new opportunities. They exploit opportunities by remaining flexible. Causational entrepreneurs try to avoid all sorts of surprises, irrespective of whether they are positive or negative, and focus on exploiting pre-existing opportunities instead.
[image:9.595.72.529.584.735.2](Sarasvathy, 2001; Dew et al., 2009; Chandler et al., 2011).
Table 2
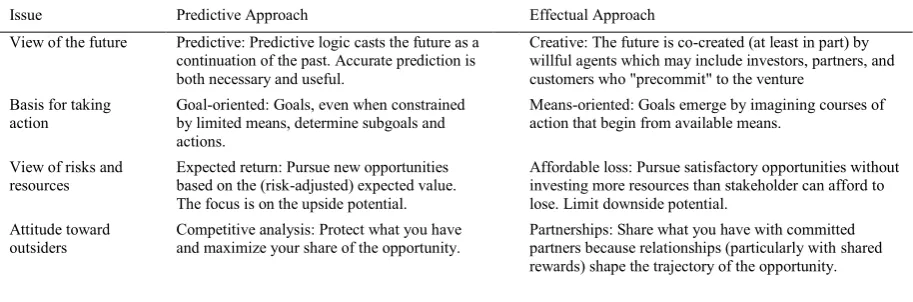
Fundamental differences between causational and effectual thought -adapted from Read et al. (2009)
Issue Predictive Approach Effectual Approach
View of the future Predictive: Predictive logic casts the future as a continuation of the past. Accurate prediction is both necessary and useful.
Creative: The future is co-created (at least in part) by willful agents which may include investors, partners, and customers who "precommit" to the venture
Basis for taking action
Goal-oriented: Goals, even when constrained by limited means, determine subgoals and actions.
Means-oriented: Goals emerge by imagining courses of action that begin from available means.
View of risks and resources
Expected return: Pursue new opportunities based on the (risk-adjusted) expected value. The focus is on the upside potential.
Affordable loss: Pursue satisfactory opportunities without investing more resources than stakeholder can afford to lose. Limit downside potential.
Attitude toward outsiders
Competitive analysis: Protect what you have and maximize your share of the opportunity.
9 Attitude toward
unexpected events
Avoid: Surprise is bad. Prediction, planning, and focus enable the firm to minimize the impact of unexpected events.
Leverage: Surprise is good. Imaginative rethinking of possibilities transforms the unexpected into new opportunities.
Conceptually, Sarasvathy (2001) clearly opposes causation and effectuation and their dimensions on opposite ends of a dichotomous scale and describes effectuation as being the inverse of causation but concedes that, empirically, both approaches can occur at the same time. More recent studies support this statement by arguing that causation and effectuation are orthogonal rather than on opposite ends of a continuum (Wiltbank, 2009; Chandler et al., 2011; Appelhoff, 2015).
2.3 Environmental Uncertainty
In general, uncertainty is the inability to predict the future and arises when decision makers are unable to forecast future events based on the information at hand (Anderson, 2001). Environmental uncertainty is currently one of the most important research areas in management and entrepreneurship literature (Verdu et al., 2012) and places a direct impact on start-up firms (Ghosh et al., 2014). This relationship between uncertainty and the success of start-ups has already been a vital element in Schumpeter’s (1974; In Ghosh, 2014) idea of stressed innovation with uncertainty as discussed by Knight (1921) and Brouwer (2000). Environmental uncertainty has its roots in (1) contingency theory (March and Simon, 1958; Lawrence and Lorsch, 1967) which deals with interpreting the environment and with fitting the organization to the environment and in (2) perceptual theory (Duncan, 1972; Child, 1972) which relates uncertainty to the interpretation of the environment and to accessing its real meaning (Ghosh et al., 2014).
The concept of environmental uncertainty has multiple definitions in the literature such as the unknown probability of outcome (Knight, 1921), a lack of information about environmental components necessary for decision-making (Duncan, 1972) and an individual’s perceived inability to accurately predict an organization’s environment (York &
10
Objective uncertainty, therefore, describes the state of the organizational environment in terms of how objectively uncertain it is (Milliken, 1987). It equates to industry dynamism, which McKelvie (2011) defines as an objective, external factor contributing to uncertainty. Ensley et al. (2006) supports this definition by characterizing dynamic environments as rapidly changing, unpredictable environments which increase uncertainty for both individuals and firms operating within them (Dess and Beard, 1984). Subjective uncertainty, on the other hand, describes the state of a person who perceives himself/herself to be lacking critical information about the environment. Uncertainty thus lies in the eye of the beholder and is considered a perceptual phenomenon (Milliken, 1987).
There is no consensus yet on the significant effects of objective and perceived environments on firm performance, but it is believed that perception mediated between the objective environment and decision-making to make meaning of the environment and to take the necessary actions (Terborg, 1981; Jauch & Kraft, 1986; Milliken, 1987; In Ghosh et al., 2014).
2.4 Uncertainty and Effectuation
Uncertainty not only affects entrepreneurial decision-making (Ghosh 2014), it is also the key environmental dimension associated with organizational mortality (Anderson, 2001). A lot of research has dealt with conceptualizing and analyzing uncertainty in itself (Milliken, 1987; Jansen et al., 2009; McKelvie, 2011; Thanti, 2014) as well as in relation to different entrepreneurial strategies. Uncertainty has been at the center of studies on homogeneous and heterogeneous top management teams (Ensley et al., 2006), planning vs. no-planning strategies (Gruber, 2007) and transactional vs. transformational leadership (Jansen et al., 2009). The results from these studies suggest that highly uncertain environments require a flexible, adaptive management approach, which goes in line with effectuation theory. Sarasvathy (2001) states that effectual logic is likely to be more effective in environments characterized by greater levels of uncertainty and Dew et al. (2008) claims that effectuation does not need a predictive stance to properly respond to a largely exogenous environment.
3. HYPOTHESES
11
to answer the question. The question this paper can attempt to answer is: Does effectuation in objectively uncertain (i.e. dynamic) environments lead to more firm survival? In other words, it constitutes an attempt to quantitatively assess the explanatory value of effectuation, causation and industry dynamism for firm survival.
The world is defined by constant opportunity and change. This situation is even exacerbated for entrepreneurs who, by definition, have to solve unique problems (Hmieleski et al., 2008) and are subject to the liability of newness (Gao et al.; 2010). The difficulty of this situation is evidenced by the consistently high failure rates of start-ups across all industries and various periods of time (Gao et al., 2010). Effectuation appears to be a reasonable solution to these problems facing new ventures. It is means-driven rather than goal-driven and thus flexible in applying the limited available resources as efficiently as possible while also focusing on keeping losses to a minimum. It effectively balances the resource constraints by building a strong network of partners and by trying to co-create the future rather than wasting resources on prediction logic (Gabrielsson et al., 2013; Read, Dew, et al., 2009). Effectuation can manage crises effectively and create more successful firms in the process (Sarasvathy, 2001). The resulting hypothesis is:
Hypothesis 1a: New ventures applying an effectuation approach are more likely to survive
than new ventures applying a causation approach.
Effectuation attempts to co-create the future rather than wasting the limited resources on prediction logic (Gabrielsson et al., 2013). It can thus shape the future rather than simply react to it and allocate the limited resources to other areas where they are needed more urgently.
Hypothesis 1b – sub-dimension “predictive control”: New ventures focusing on non-predictive control are more likely to survive than those focusing on non-predictive control.
Effectuation is means-oriented rather than goal-oriented and therefore imagines courses of actions and goals that can be achieved with the available means (Read, Dew, et al., 2009). Since new ventures are usually subject to significant resource constraints (Gabrielsson et al., 2013), beginning with the available means appears to be a good starting point for setting realistic future goals.
12
Ventures employing effectuation focus on limiting downside potential by pursuing satisfactory opportunities without investing more resources than they can afford to lose. Ventures employing causation, on the other hand, focus on the upside potential with the main goal of maximizing profits (Read et al., 2009). The former approach implies that effectual entrepreneurs exert generally more caution when deciding on potential opportunities than their causational counterparts and are therefore more perceptive to potential red flags. At the same time, they are more reluctant to make large investments that could potentially impact their survival.
Hypothesis 1b – sub-dimension “affordable loss”: New ventures placing a high emphasis on affordable loss are more likely to survive than those placing a high emphasis on
expected return.
Rather than investing scarce resources on analyzing and monitoring competitors to stay ahead of them, effectual entrepreneurs try to build a strong network of partners (Read et al., 2009). In doing so, they can not only effectively manage their limited resources by tapping into their partners resource pool, but are also in a good position to shape the future together with these partners rather than simply reacting to it.
Hypothesis 1b – sub-dimension “partnerships”: New ventures that focus more on building partnerships are more likely to survive than those focusing more on competitive analysis.
New ventures are naturally exposed to certain levels of uncertainty (Mc Kelvie et al., 2011). At the same time, uncertainty is the key environmental dimension concurrent with organizational mortality (Anderson, 2001). This leads to the following hypothesis:
Hypothesis 2: Higher levels of industry dynamism negatively affect firm survival.
Due to the fact that new ventures are naturally exposed to certain levels of uncertainty (Mc Kelvie et al., 2011) as well as to the belief that effectuation is considered to be an effective means for coping with uncertainty (Sarasvathy, 2001), it can be expected that new ventures with a desire to survive express more effectual behavior.
Hypothesis 3: More industry dynamism leads to firms applying more effectuation.
13
manner (Gruber, 2007), that heterogeneous management teams outperform homogeneous teams in dynamic environments (Ensley et al., 2006) and that uncertain environments require firms to stay flexible to industry dynamics (Thanti, 2014). Combining these arguments leads to the following hypothesis.
Hypothesis 4a: The relationship between effectuation and firm survival is positively moderated by industry dynamism. The greater the industry’s dynamism, the stronger the positive effect of effectuation on firm survival.
Applying the same reasoning as for hypothesis 1a-1d as well as the arguments for hypothesis 4 result in these hypotheses for the sub-dimensions of effectuation.
Hypothesis 4b – sub-dimension “non-predictive control”: The relationship between non-predictive control and firm survival is positively moderated by industry dynamism. The greater the industry’s dynamism, the stronger the positive effect of non-predictive control on firm survival.
Hypothesis 4b - sub-dimension “means-orientation”: The relationship between means-orientation and firm survival is positively moderated by industry dynamism. The greater the industry’s dynamism, the stronger the positive effect of means-orientation on firm survival.
Hypothesis 4b - sub-dimension “affordable loss”: The relationship between affordable loss and firm survival is positively moderated by industry dynamism. The greater the industry’s dynamism, the stronger the positive effect of affordable loss on firm survival.
Hypothesis 4b – sub-dimension “partnerships”: The relationship between seeking partnerships and firm survival is positively moderated by industry dynamism. The greater the industry’s dynamism, the stronger the positive effect of seeking partnerships on firm survival.
4. METHOD
4.1 Data Collection
The business plans for the main dataset were collected from the Business Plan Archive
(http://www.businessplanarchive.org), a research database which contains information on
14
based on purposive sampling and only those business plans that contained information on the required variables were selected. Those business plans that did not contain information on multiple variables were omitted (Oude Luttikhuis, 2014). Of the initially coded 414 business plans, 228 business plans were eventually used for the main analysis. Inclusion criteria were that the survival data at 2004 and at 2014 had to be available, founding date and date of business plan submission had to be between 1990 and 2004. An exclusion criterion was that no more than 10 missing values were permitted. Data on industry dynamism was collected via official U.S. databases (Bureau of Labor Statistics, United States Census Bureau, U.S. Bureau of Economic Analysis and the U.S. National Science Foundation). These databases contain detailed historic as well as current information and statistics on all U.S. industries (Appendix B). Missing values were excluded case-wise within each analysis.
4.2 Measure of Firm Performance
Firm survival was used as the dependent variable to measure firm performance. The data on firm survival reflects whether a firm was still in business in the year 2004 and the year 2014, respectively. Firm survival was chosen over other performance measures for two reasons. New firms are facing high uncertainty and are therefore required to focus on establishing their market positions and building their business. This is especially true for firms operating in emerging industries where they often have to invest heavily to reach and educate customers about their products (Porter, 1980). As a consequence, profitability may not be a good indicator of performance in the first years of business (Baum et al., 2001; Mudambi et al., 2007). Moreover, empirical evidence exists that supports a positive relationship between a firm’s survival data and its later market share and profit performance (Evans, 1987a,b). Nonetheless, data on additional dependent variables such as mergers and acquisitions was collected as well.
4.3 Coding Business Plans on Effectuation & Causation
15
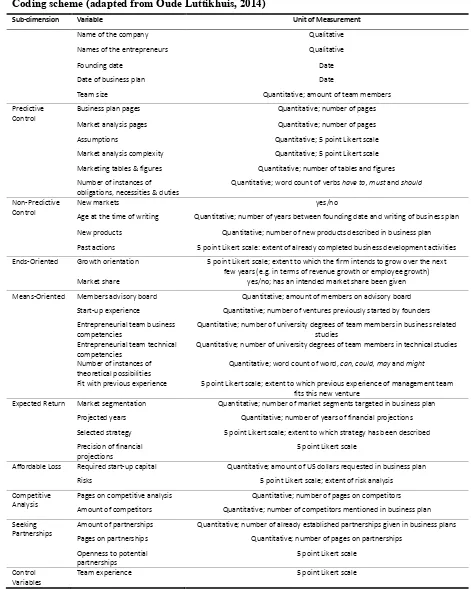
Table 3
Coding scheme (adapted from Oude Luttikhuis, 2014)
Sub-dimension Variable Unit of Measurement
Name of the company Qualitative
Names of the entrepreneurs Qualitative
Founding date Date
Date of business plan Date
Team size Quantitative; amount of team members
Predictive Control
Business plan pages Quantitative; number of pages
Market analysis pages Quantitative; number of pages
Assumptions Quantitative; 5 point Likert scale
Market analysis complexity Quantitative; 5 point Likert scale
Marketing tables & figures Quantitative; number of tables and figures
Number of instances of obligations, necessities & duties
Quantitative; word count of verbs have to, must and should
Non-Predictive Control
New markets yes/no
Age at the time of writing Quantitative; number of years between founding date and writing of business plan
New products Quantitative; number of new products described in business plan
Past actions 5 point Likert scale: extent of already completed business development activities
Ends-Oriented Growth orientation 5 point Likert scale; extent to which the firm intends to grow over the next few years (e.g. in terms of revenue growth or employee growth)
Market share yes/no; has an intended market share been given
Means-Oriented Members advisory board Quantitative; amount of members on advisory board
Start-up experience Quantitative; number of ventures previously started by founders
Entrepreneurial team business competencies
Quantitative; number of university degrees of team members in business related studies
Entrepreneurial team technical competencies
Quantitative; number of university degrees of team members in technical studies
Number of instances of theoretical possibilities
Quantitative; word count of word, can, could, may and might
Fit with previous experience 5 point Likert scale; extent to which previous experience of management team fits this new venture
Expected Return Market segmentation Quantitative; number of market segments targeted in business plan
Projected years Quantitative; number of years of financial projections
Selected strategy 5 point Likert scale; extent to which strategy has been described
Precision of financial projections
5 point Likert scale
Affordable Loss Required start-up capital Quantitative; amount of US dollars requested in business plan
Risks 5 point Likert scale; extent of risk analysis
Competitive Analysis
Pages on competitive analysis Quantitative; number of pages on competitors
Amount of competitors Quantitative; number of competitors mentioned in business plan
Seeking Partnerships
Amount of partnerships Quantitative; number of already established partnerships given in business plans
Pages on partnerships Quantitative; number of pages on partnerships
Openness to potential partnerships
5 point Likert scale
Control Variables
Team experience 5 point Likert scale
16
[image:17.595.67.280.217.280.2]The dataset was generated by two independent raters working according to the coding scheme. The reliability of the coding procedure was checked by first having both raters code a random sample of 35 business plans individually and then comparing results via Cohen’s Kappa. Fleiss’ (1981) Kappa Benchmark was applied for labeling the Kappa values into poor, intermediate to good, and excellent strength of agreement (Appendix B).
Table 4
Fleiss' Kappa benchmark scale
Kappa Value Strength of Agreement
< 0.40 Poor
0.40 - 0.75 Intermediate to good
> 0.75 Excellent
Fourteen codes showed an excellent strength of agreement, twelve an intermediate to good strength of agreement and four codes (”market analysis pages”, “pages on partnerships”, “number of instances of theoretical possibilities” and “fit with previous experience”) showed poor strength of agreement with Kappa statistics below 0.40. The first three codes were measured by counting pages or the number of instances of certain word occurrences and thus resulted in natural differences, even if only by half a page or one count. The code “fit with previous experience” is a 5 point Likert scale measure of the degree to which a business plan fits the previous experience of the founding team. The fact that the measure is rather subjective in nature prevents a high strength of agreement. Furthermore, the Kappa value is 0.38 and thus almost in the intermediate range. Consequently none of the four codes were excluded from further analyses. After an acceptable inter-rater reliability was achieved, the complete dataset of 414 business plans was split among the two raters and coded completely. In a second stage, data was cross-checked to increase reliability of the results.
17
arrive at a mean for causation. The mean for the four sub-dimensions of causation displayed a Cronbach’s alpha of .60.
4.4 Industry Dynamism
[image:18.595.69.464.330.637.2]Industry dynamism was calculated according to the formula proposed by Ensley et al. (2006). Dynamism was chosen over uncertainty because it allows for an objective measure of the uncertainty that is present in the environment without having to adjust for subjective differences in perceptions. First, each individual business plan was assigned a specific 6-digit NAICS code that most closely matched its core business activity. Each 6-digit code (industry level) was then grouped into their respective 2-digit NAICS code (sector level), resulting in the following distribution
Table 5
NAICS sector frequency distribution
2 digit NAICS sector Industry Title Frequency
Of Occurrence
11 Agriculture, Forestry, Fishing and Hunting 0
21 Mining 0
22 Utilities 0
23 Construction 2
31-33 Manufacturing 12
42 Wholesale Trade 0
44-45 Retail Trade 19
48-49 Transportation and Warehousing 3
51 Information 97
52 Finance and Insurance 11
53 Real Estate Rental and Leasing 4
54 Professional, Scientific, and Technical Services 58
55 Management of Companies and Entrepreneurs 0
56 Administrative and Support and Waste Management and Remediation Services 7
61 Educational Services 5
62 Health Care and Social Assistance 3
71 Arts, Entertainment, and Recreation 1
72 Accommodation and Food Services 1
81 Other Services (except Public Administration) 3
92 Public Administration 0
18
regressions was then divided by the mean of the respective variable that the regression was calculated with, yielding measures of instability. The sum of the instability measures of the number of employees, the number of establishments, the added value was standardized and added to the standardized instability measure of research and development intensity and added the number of years within the respective time span to yield the industry dynamism for the respective time span.
Industry Dynamism 1998 – 2004 = Z(NEI + MI + NESTI) + Z(TI) + 7
Industry Dynamism 2005 – 2013 = Z(NEI + MI + NESTI) + Z(TI) + 9
Industry Dynamism 1998 – 2013 = Z(NEI + MI + NESTI) + Z(TI) + 16
Where Z() = z-score of terms within parentheses, MI = market instability, NEI = number of employees instability, NESTI = number of establishments instability, TI = technological instability.
4.5 Analyses
All calculations and analyses were conducted via SPSS, version 23. To determine statistical significance, an alpha of .05 was handled for all statistical tests. To determine trends, an alpha of .10 was adopted.
To test the first hypothesis whether effectuation leads to more firm survival four binary logistic regression analyses were conducted with firm survival at 2004 (model 1.1a) and 2014 (model 1.2a) as the dependent variables and the aggregate scores of effectuation and causation as the independent variables. This was repeated with the sub-dimensions of effectuation and causation as independent variables (model 1.1b and 1.2b).
To test the second hypothesis whether high industry dynamism leads to lower firm survival three binary logistic regression analyses were conducted. Model 2.1 tests firm survival at 2004 as the dependent variable and industry dynamism of 1998 – 2004 as the independent variable, Model 2.2 tests firm survival at 2014 as the dependent variable and industry dynamism of 2005 – 2013 as the independent variable, and Model 2.3 tests firm survival at 2014 as the dependent variable and industry dynamism of 1998 – 2013 as the independent variable.
19
To test the fourth hypothesis whether effectuation and industry dynamism lead to more firm survival three binary logistic regression analyses were conducted. Model 4.1a tests with firm survival at 2004 as the dependent variables and the aggregate scores of effectuation and causation, and industry dynamism at 1998 – 2004 as the independent variables, model 4.2a tests with firm survival at 2014 as the dependent variables and the aggregate scores of effectuation and causation, and industry dynamism at 2005 – 2013 as the independent variables, and model 4.3a tests with firm survival at 2004 as the dependent variables and the aggregate scores of effectuation and causation, and industry dynamism at 1998 – 2013 as the independent variables. Model 4.1b through model 4.3b repeated these analyses with the sub-dimensions of effectuation and causation instead of their aggregate scores.
5. RESULTS
5.1 Descriptives
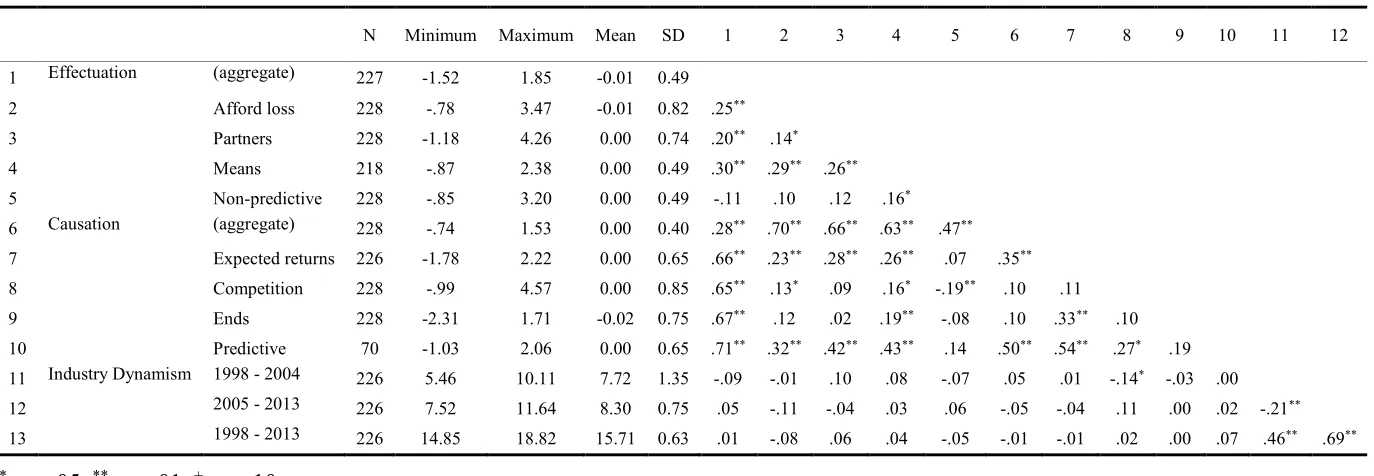
The formula for calculating industry dynamism includes the span of years that the measure is aimed at. In other words, industry dynamism is a measure that increases 1 per year, by default. The time spans of the industry dynamism of 1998 - 2004 and 2005 - 2013 are approximately equal to each other (i.e. 7 and 9 years). In contrast, the industry dynamism of 1998 - 2013 spans 16 years. This explains partly the differences between the two short time spans of 1998 - 2004 and 2005 - 2013 and the long time span of 1998 - 2013 (Table 7). Other fluctuations in industry dynamism are due to changes in industry establishment, industry
employees, value added, and research and developmental intensity.
20
Table 6
Descriptives and bivariate correlations for effectuation, causation and industry dynamism
N Minimum Maximum Mean SD 1 2 3 4 5 6 7 8 9 10 11 12
1 Effectuation (aggregate) 227 -1.52 1.85 -0.01 0.49
2 Afford loss 228 -.78 3.47 -0.01 0.82 .25**
3 Partners 228 -1.18 4.26 0.00 0.74 .20** .14*
4 Means 218 -.87 2.38 0.00 0.49 .30** .29** .26**
5 Non-predictive 228 -.85 3.20 0.00 0.49 -.11 .10 .12 .16*
6 Causation (aggregate) 228 -.74 1.53 0.00 0.40 .28** .70** .66** .63** .47**
7 Expected returns 226 -1.78 2.22 0.00 0.65 .66** .23** .28** .26** .07 .35**
8 Competition 228 -.99 4.57 0.00 0.85 .65** .13* .09 .16* -.19** .10 .11
9 Ends 228 -2.31 1.71 -0.02 0.75 .67** .12 .02 .19** -.08 .10 .33** .10
10 Predictive 70 -1.03 2.06 0.00 0.65 .71** .32** .42** .43** .14 .50** .54** .27* .19
11 Industry Dynamism 1998 - 2004 226 5.46 10.11 7.72 1.35 -.09 -.01 .10 .08 -.07 .05 .01 -.14* -.03 .00
12 2005 - 2013 226 7.52 11.64 8.30 0.75 .05 -.11 -.04 .03 .06 -.05 -.04 .11 .00 .02 -.21**
13 1998 - 2013 226 14.85 18.82 15.71 0.63 .01 -.08 .06 .04 -.05 -.01 -.01 .02 .00 .07 .46** .69**
21
Table 7
Industry dynamism for all sectors (2 digit NAICS) and over both short time spans and the long time span
NAICS sector (2-digit) 23 31 32 33 44 45 48 49 51
Industry Dynamism 1998 - 2004 6.69 6.41 6.41 6.41 5.46 5.46 10.11 10.11 9.10 2005 - 2013 10.01 8.54 8.54 8.54 8.30 8.30 11.64 11.64 7.84 1998 - 2013 16.87 14.92 14.92 14.92 15.27 15.27 18.49 18.49 15.85
N 2 1 3 8 4 15 1 2 97
NAICS sector (2-digit) 52 53 54 56 61 62 71 72 81
Industry Dynamism 1998 - 2004 7.18 6.67 6.81 8.05 6.04 5.95 7.26 6.29 6.34 2005 - 2013 10.30 9.25 8.27 9.53 8.04 7.52 8.42 8.58 7.89 1998 - 2013 17.13 16.95 15.31 16.19 15.19 14.85 15.74 15.45 15.27
N 11 4 58 7 5 3 1 1 3
5.2 Hypothesis 1
To determine whether firm survival can be explained by effectuation and causation, several models were tested with binary logistic regression (Table 8 and 9). Model 1.1a tests whether effectuation and causation can explain firm survival on 2004. The binary logistic regression is marginally significant (χ2
(2) = 5.32; p < .10). Within Model 1.1a effectuation displays a
statistically significant positive incline parameter for the chance of survival on 2004 (B = 0.63 SEB = 0.29; Wald(1) = 4.60; p < .05). Causation did not display a statistically significant incline parameter. The hypothesis is supported as effectuation can explain firm survival on 2004, causation cannot.
Model 1.2a tests whether effectuation and causation can explain firm survival on 2014. The binary logistic regression is marginally significant (χ2
(2) = 5.37; p < .10). Within model 1.2a
effectuation displays a statistically significant positive incline parameter for the chance of survival on 2014 (B = 0.76; SEB = 0.35; Wald(1) = 4.76; p < .05). Causation did not display a statistically significant incline parameter (B = 0.02; SEB = 0.41; Wald(1) = 0.00; p = .97). The hypothesis is supported as effectuation can explain firm survival on 2014, causation cannot.
Table 8
Binary logistic regressions for firm survival explained by effectuation and causation
Model 1.1a: survival 2004 Model 1.2a: survival 2014
22
Effectuation 0.63(0.29) 4.60 .03 0.76(0.35) 4.76 0.03
Causation 0.04(0.35) 0.01 .92 0.02(0.41) 0.00 0.97
χ2 df R2 p χ2 df R2 p
5.32 2 0.03 .07 5.37 2 0.04 0.07
* p < .05, ** p < .01, + p < .10
To determine whether firm survival can be explained by the sub-dimensions of effectuation and causation, several models were tested with binary logistic regression (Table 9). Model 1.1b tests whether the sub-dimensions of effectuation and causation can explain firm survival on 2004. The binary logistic regression is not significant (χ2
(8) = 2.70; p = .95).
Further analyses on this model are omitted. The hypothesis is not supported as the model with the sub-dimensions cannot explain firm survival on 2004.
Model 1.2b tests whether the sub-dimensions of effectuation and causation can explain firm survival on 2014, the binary logistic regression is marginally significant (χ2
(8) = 14.35; p <
[image:23.595.67.341.72.125.2].10). Within Model 1.2b affordable loss and partners display a statistically and marginally significant positive and negative incline parameters for the chance of survival on 2014 (B = 1.37; SEB = 0.58; Wald(1) = 5.58; p < .05; and B = -1.82; SEB = 3.09; Wald(1) = 3.09; p < .10). The hypothesis is partially supported as two of the four sub-dimensions of effectuation can explain firm survival on 2014, no sub-dimension of causation can.
Table 9
Binary logistic regressions for firm survival explained by sub-dimensions of effectuation and causation
Model 1.1b: survival 2004 Model 1.2b: survival 2014
B (SEB) Wald p B (SEB) Wald P
Effectuation Affordable loss 0.11(0.28) 0.16 0.69 1.37(0.58) 5.58 0.02
Partners -0.09(0.36) 0.07 0.79 -1.82(1.03) 3.09 0.08
Means-oriented 0.57(0.6) 0.90 0.34 -0.81(1.21) 0.45 0.50 Non-Predictive 0.2(0.82) 0.06 0.81 -1.13(1.33) 0.73 0.39 Causation Expected return -0.28(0.59) 0.22 0.64 1.63(1.29) 1.60 0.21 Competitors -0.24(0.37) 0.42 0.52 -0.32(0.73) 0.19 0.66 Ends-oriented -0.1(0.37) 0.07 0.79 -0.46(0.72) 0.41 0.52 Predictive 0.24(0.51) 0.22 0.64 0.35(0.89) 0.15 0.70
χ2 df R2 P χ2 df R2 p
2.70 8 0.05 0.95 14.35 8 0.35 0.07
* p < .05, ** p < .01, + p < .10
5.3 Post-hoc on Effectuation Sub-Dimension Partners
The variable partners explaining a negative trajectory seemed counterintuitive, which is why a post-hoc binary logistic regression analysis was devised to investigate whether partners is related to the chance for mergers and acquisition 2014. This variable measured whether the firms from the business plans had merged with- or been acquired by- another company by the year 2014. The binary logistic regression was statistically significant (χ2
(1) = 4.34; p < .05) and
23
2014 (B = 0.54; SEB = 0.25; Wald(1) = 4.82; p < .05). Survival is coded as surviving individually and a merger or an acquisition is coded as not surviving. In other words, the negative incline parameter for partners can be explained by the negative coding of mergers and acquisitions. Further sub-dimensions of effectuation or causation did not display a statistically significant incline parameter.
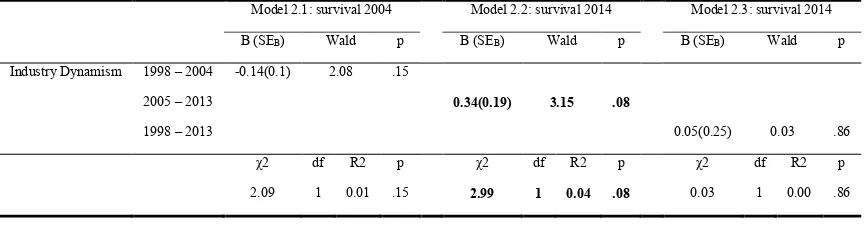
5.4 Hypothesis 2
To determine whether firm survival can be explained by industry dynamism, several models were tested with binary logistic regression (Table 10). Model 2.1 tests whether industry dynamism of the years 1998 – 2004 can explain firm survival on 2004. The binary logistic regression is not significant (χ2
(1) = 2.09; p = .15). Further analyses are omitted.
Model 2.2 tests whether industry dynamism of the years 2005 – 2013 can explain firm survival on 2014. The binary logistic regression is marginally significant (χ2
(1) = 2.99; p < .10).
Within Model 2.3 industry dynamism of the years 2005 – 2013 displays a marginally significant positive incline parameter for the chance of survival on 2014 (B = 0.34; SEB = 0.19; Wald(1) = 3.15; p < .10).
Model 2.3 tests whether industry dynamism of the years 1998 – 2013 can explain firm survival on 2014. The binary logistic regression is not significant (χ2
(1) = 0.03; p = .86). Further
[image:24.595.67.499.529.642.2]analyses are omitted. The hypothesis is not supported as industry dynamism can explain firm survival on 2014, but does so with a positive instead a negative incline parameter.
Table 10
Binary logistic regressions for firm survival explained by industry dynamism
Model 2.1: survival 2004 Model 2.2: survival 2014 Model 2.3: survival 2014
B (SEB) Wald p B (SEB) Wald p B (SEB) Wald p
Industry Dynamism 1998 – 2004 -0.14(0.1) 2.08 .15
2005 – 2013 0.34(0.19) 3.15 .08
1998 – 2013 0.05(0.25) 0.03 .86
χ2 df R2 p χ2 df R2 p χ2 df R2 p
2.09 1 0.01 .15 2.99 1 0.04 .08 0.03 1 0.00 .86
* p < .05, ** p < .01, + p < .10
5.5 Post-hoc on Industry Dynamism of the Years 2005 – 2013
24
chance for mergers and acquisition 2014. This variable measured whether the firms from the business plans had merged with- or been acquired by- another company by the year 2014. The binary logistic regression was marginally significant (χ2
(1) = 2.67; p = .10) and reveals a
positive incline parameter for industry dynamism of the years 2005 – 2013 on the chance for mergers and acquisition 2014 (B = 0.42; SEB = 0.24; Wald(1) = 3.09; p < .10). Survival is coded as surviving individually and a merger or an acquisition is coded as not surviving. This analysis can be understood as more industry dynamism evokes more mergers and acquisitions. However, this does not serve as an explanation for why industry dynamism is positively associated with more firm survival.
5.6 Hypothesis 3
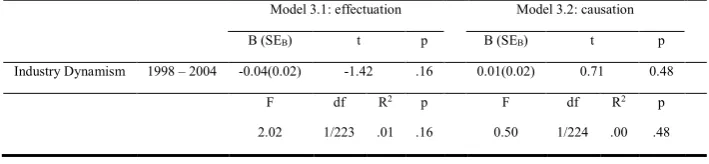
[image:25.595.65.420.497.579.2]To determine whether more industry dynamism leads to more effectuation two OLS regression analyses were conducted. The aggregate scores for effectuation and causation were taken as dependent variables and industry dynamism of the years 1998 – 2004 as the independent variable. No statistically significant predictive value of industry dynamism (between 1998-2004) on effectuation was found (Model 3.1: F (1; 223) = 2.02; p = .16) and no statistically significant predictive value of industry dynamism of the years 1998 – 2004 on causation was found (Model 3.2: F (1; 224) = 0.50; p = .48). The hypothesis is not supported since no connection between industry dynamism and effectuation was found.
Table 11
OLS regressions for effectuation explained by industry dynamism
Model 3.1: effectuation Model 3.2: causation
B (SEB) t p B (SEB) t p
Industry Dynamism 1998 – 2004 -0.04(0.02) -1.42 .16 0.01(0.02) 0.71 0.48
F df R2 p F df R2 p
2.02 1/223 .01 .16 0.50 1/224 .00 .48
* p < .05, ** p < .01, + p < .10
5.7 Hypothesis 4
Model 4.1a tests whether effectuation, causation and industry dynamism of the years 1998 – 2004 can explain firm survival on 2004. The binary logistic regression is marginally significant (χ2
(3) = 6.28; p < .10). Within model 4.1a effectuation displays a marginally
25
Model 4.2a tests whether effectuation, causation and industry dynamism of the years 2005 – 2013 can explain firm survival on 2014. The binary logistic regression is marginally significant (χ2
(3) = 7.43; p < .10). Within model 4.2a effectuation and industry dynamism of the
years 2005 – 2013 display marginally significant positive incline parameters for the chance of survival on 2014 (B = 0.68; SEB = 0.35; Wald(1) = 3.85; p < .10; and B = 0.33; SEB = 0.19; Wald(1) = 2.81; p < .10). The hypothesis is supported, since a contribution of industry dynamism to effectuation could be detected.
Model 4.3 tests whether effectuation, causation and industry dynamism of the years 1998 – 2013 can explain firm survival on 2014. The binary logistic regression is not significant (χ2
(3) = 4.77; p = .19). Further analyses are omitted. The hypothesis is not supported,
since the model is not significant.
Table 12
Binary logistic regressions for firm survival explained by effectuation, causation and industry dynamism
Model 4.1a: survival 2004 Model 4.2a: survival 2014 Model 4.3a: survival 2014
B (SEB) Wald P B (SEB) Wald P B (SEB) Wald P
Effectuation 0.56(0.30) 3.61 .06 0.68(0.35) 3.85 .05 0.72(0.35) 4.24 .04
Causation 0.07(0.35) 0.04 .84 0.08(0.41) 0.03 .86 0.01(0.41) 0.00 .98
Industry Dynamism 1998 – 2004 -0.12(0.10) 1.49 .22
2005 – 2013 0.33(0.19) 2.81 .09
1998 – 2013 0.03(0.25) 0.01 .91
χ2 df R2 P χ2 df R2 P χ2 df R2 P
6.28 3 .04 .10 7.43 3 .05 .06 4.77 3 .03 .19
* p < .05, ** p < .01, + p < .10
Model 4.1b tests whether the sub-dimensions of effectuation and causation and industry dynamism of the years 1998 – 2004 can explain firm survival on 2004. The binary logistic regression is not significant (χ2
(9) = 2.70; p = .97). Further analyses are omitted due to statistical
insignificance of the model. The hypothesis is not supported, since the model is not significant.
Model 4.2b tests whether the sub-dimensions of effectuation, causation and industry dynamism of the years 2005 – 2013 can explain firm survival on 2014. The binary logistic regression is not significant (χ2(9) = 14.36; p = .11). Further analyses are omitted due to statistical insignificance of the model. The hypothesis is not supported, since the model is not significant. The hypothesis is not supported, since the model is not significant.
Model 4.3b tests whether the sub-dimensions of effectuation and causation and industry dynamism of the years 1998 – 2013 can explain firm survival on 2014. The binary logistic regression is statistically significant (χ2
26
[image:27.595.71.507.249.383.2]and industry dynamism of the years 1998 – 2013 display statistically and marginally significant positive and negative incline parameters for the chance of survival on 2014 (B = 1.39; SEB = 0.60; Wald(1) = 5.37; p < .05; and B = -2.97; SEB = 1.64; Wald(1) = 3.30; p < .10). Further sub-dimensions of effectuation or causation did not display a statistically significant incline parameter. The hypothesis is partially supported, since affordable and industry dynamism of the years 1998 – 2013 can explain firm survival on 2014.
Table 13
Binary logistic regressions for firm survival explained by sub-dimensions of effectuation and causation and industry dynamism
Model 4.1b: survival 2004 Model 4.2b: survival 2014 Model 4.3b: survival 2014
B (SEB) Wald P B (SEB) Wald P B (SEB) Wald P
Effectuation Affordable loss 0.11(0.28) 0.16 .69 1.37(0.58) 5.54 .02 1.39(0.60) 5.37 .02
Partners -0.1(0.37) 0.07 .80 -1.82(1.03) 3.09 .08 -1.30(1.03) 1.60 .21 Means-oriented 0.56(0.61) 0.87 .35 -0.79(1.24) 0.41 .52 -0.63(1.46) 0.18 .67 Non-Predictive 0.20(0.82) 0.06 .81 -1.18(1.44) 0.67 .41 -1.53(1.74) 0.77 .38 Causation Expected return -0.28(0.59) 0.22 .64 1.63(1.29) 1.59 .21 1.51(1.3) 1.36 .24 Competitors -0.23(0.37) 0.39 .53 -0.32(0.73) 0.20 .66 -0.67(0.82) 0.65 .42 Ends-oriented -0.1(0.38) 0.07 .79 -0.49(0.77) 0.40 .53 -0.3(0.84) 0.13 .72 Predictive 0.24(0.51) 0.22 .64 0.35(0.89) 0.15 .70 0.21(0.97) 0.05 .83 Industry Dynamism 1998 – 2004 0.00(0.21) 0.00 .98
2005 – 2013 0.07(0.77) 0.01 .93
1998 – 2013 -2.97(1.64) 3.30 .07
χ2 df R2 P χ2 df R2 P χ2 df R2 P
2.70 9 .05 .97 14.36 9 .35 .11 18.67 9 .45 .03
* p < .05, ** p < .01, + p < .10
5.8 Summary of Hypotheses
In summary, effectuation and industry dynamism can partly explain firm survival at 2004 and 2014. The explanatory values of effectuation and industry dynamism are not stable over all models, suggesting that other events and elements of the business world (e.g. external environment or internal changes) play a role in keeping the businesses from failing. Causation seems to not contribute to the explanatory value of any model containing effectuation and industry dynamism.
Table 14
Summary of tested hypotheses, decisions and formulated conclusions
Hypothesis Decision Conclusion
1 firm survival can be explained by effectuation and causation
supported More effectuation can be associated with higher firm survival. The sub-dimensions are only partially supported
2 firm survival can be explained by industry dynamism
rejected No negative association between industry dynamism and firm survival
3 more industry dynamism leads to more effectuation
[image:27.595.69.518.597.737.2]27 4 effectuation, causation and industry
dynamism can explain firm survival
partially Effectuation and industry dynamism are positively associated with firm survival. The sub-dimensions are partially supported as well.
6. DISCUSSION
This paper constitutes an attempt to quantitatively assess the explanatory value of causation, effectuation and industry dynamism for firm survival. It is postulated that effectuation leads to more firm survival than causation since effectuation balances the resource constraints new ventures are typically faced with (Gabrielsson et al., 2013; Read, Dew, et al., 2009) and provides a flexible framework for adaptive action and decision-making to optimally exploit contingencies (Sarasvathy, 2001). The obtained data support this assumption on the main dimension of effectuation. Further, it is postulated that the positive impact of effectuation is due to building a strong network of partners and by trying to co-create the future rather than wasting resources on prediction logic (Gabrielsson et al., 2013; Read, Dew, et al., 2009). The data support the assumption that two of the sub-dimensions of effectuation, namely
affordable loss and partners, play a role in realizing firm survival. The sub-dimension
affordable lossis based on the entrepreneur’s assessment of what they are willing to lose. The
goal is to limit downside potential by never investing more resources into opportunities than the stakeholders can afford to lose (Read et al., 2009). This is, especially under consideration of the resource constraints new ventures usually have to deal with, a reasonable coping mechanism to not go bankrupt in the first few years after founding. At the same time, the resource constraints also imply that entrepreneurs have to consider opportunities more carefully and analyse the respective risks that may be involved because pursuing the wrong opportunities could lead to non-survival fast.
The initial negative association of the second sub-dimension of effectuation, namely
28
It is postulated that uncertainty is a crucial factor determining firm survival (Anderson, 2001). In contrast to this postulation, this paper could not establish a negative link between industry dynamism and firm survival. Even more unexpectedly, a positive link was found suggesting that more industry dynamism facilitates firm survival.
One possible explanation for this unexpected result might lie in the overestimation of the importance of objective uncertainty (industry dynamism) and the underestimation of the importance of subjective (perceived) uncertainty. As a result, perceived uncertainty might weigh more strongly than objectively measured uncertainty in the decisions a firm makes and the effects these decisions have on firm survival. Another explanation could be the fact that no measure of an entrepreneur’s reaction to uncertainty was taken and corrected for. The high survival despite the high industry dynamism might be explained by an effective entrepreneurial coping strategy such as effectuation.
Since new ventures are naturally exposed to certain levels of uncertainty (Mc Kelvie et al., 2011) and since effectuation is considered to be an effective means for coping with uncertainty (Sarasvathy, 2001), it is posited that more industry dynamism induces more effectuation. However, this paper could not establish a link between industry dynamism and either effectuation or causation. Businesses that are faced with higher uncertainty do not employ more effectuation even though this is considered to be a good solution for coping with uncertainty. One possible reason for this is that entrepreneurs do not know about the different entrepreneurial strategies and about when to best apply which. Another possible reason for this is that they apply a combination of knowledge acquired in business schools, which mainly teaches the causal decision-making approach (Sarasvathy, 2001), and an intuitively effectual approach that best suits their respective needs.
29
employed in this paper and that this is the reason for the erratic results. This would be another reason to focus future research on measuring perceived uncertainty.
It is postulated that effectuation leads to more firm survival under condition of uncertainty than causation (Sarasvathy, 2001). The findings of the present paper suggest that uncertainty plays a role, but the findings are not definite. Sometimes a clear association of uncertainty with firm survival was found, while at other times uncertainty did change the outcomes without a distinct direction. A possible explanation for the inconsistent results might lie in the fact that industry dynamism was calculated for a time span post-formulation of the business plans. Certain events such as 9/11 and the NASDAQ crash most probably affected the uncertainty measures, but could not have affected the writing of the business plans as this action took place before the incidents.
Yet again, another possible explanation for the inconsistency might lie in the overestimation of the importance of objective uncertainty (industry dynamism) and the underestimation of the importance of subjective (perceived) uncertainty. The present study tried to quantify uncertainty with the objective measure industry dynamism. This objective measure is a rather complex calculation of different hard-to-get business parameters that may not be accessible or comprehensible for most entrepreneurs. So, rather than an objective measure of the environmental uncertainty, a subjective measure thereof might have captured more closely how the businesses view their opportunities and risks and how they perceive the environmental uncertainty facing their business. This is supported by Samsami (2015) who states that the relationship between perceived uncertainty and decision-making style is more important than other parameters. It may therefore not be enough to research only industry dynamism’s (objective uncertainty’s) moderating influence on the degree of causation and effectuation displayed in a firm’s business plans, but necessary to look at a combination of both industry dynamism and perceived uncertainty to get a better understanding of the influence of environmental uncertainty on the choice of entrepreneurial logic. A third possible explanation for the incongruence could be that firm survival is not an adequate indicator of firm performance.
30
historic events within the observed time span which would have necessitated the incorporation of certain control variables and by using a subjective measure for environmental uncertainty.
6.1 Limitations
There are a number of limitations to this study. One problem arises from the fact that business plans are usually written to raise money for the business. The general perception to business plan writing seems to be that the more thoroughly information is collected and presented, the better the business and the higher the chances to receive funding. As a consequence, business plan writers might be inclined to write very extensive business plans that do not reflect the actual entrepreneurial logic employed by the entrepreneurs and top management accurately.
Another issue affecting the dataset could be the coding scheme in itself, which is not detailed enough to represent the actual differences between causation and effectuation. Part of the problem is the difficulty to develop empirical measures that accurately capture the underlying realities. Both these issues have potentially affected results. A possible solution to these problems might be to combine empirical databases with qualitative measures (e.g. interviews with the respective entrepreneurs) in the future to get a more complete picture of the entrepreneurial approach employed.
An important limitation of the industry dynamism construct is the fact that not enough data was available to calculate industry dynamism scores for time spans before 1998. Since most business plans were written around the year 2000, there is hence no measure for industry dynamism at the time of writing the business plan available. This renders a possibly insightful regression between effectuation and causation found in business plans and the respective industry dynamism before writing invalid.
6.2 Suggestions for Future Research
31
profit from combining objective and subjective uncertainty and use them both to analyse their effect on the success of causation and effectuation strategies.
Another possibility to bring a new angle to the relationship between the entrepreneurial approach employed, industry dynamism and firm survival is to include the venture’s initial conditions. According to Gao et al. (2010), new venture performance is strongly affected by a venture’s initial conditions. These conditions are the entrepreneurial quality (e.g. team heterogeneity and know-how), characteristics of the venture (e.g. degree of product novelty and initial founding conditions), the external environment (industry structure and competitive environment), the entrepreneurial process (venture strategy and legitimacy generation) and the available resources (initial financial resources and general human capital). While some of the conditions have been partly discussed in this paper, focusing on others might yield some new insights. The resource aspect in particular could add some insight into this discussion as it has already been established that the initial resources available at start-up do affect a firm’s ability to survive the first few years (Aspelund et al., 2005), but has not yet been studied in relation to the entrepreneurial approach.
Besides further researching other independent variables, looking at some alternative dependent variables besides firm survival may yield some additional knowledge. The reasoning for this is twofold. For one, it has been argued that firm survival is the superior measure of firm performance in the start-up stage of business since generally applied profitability measures are not representative of success in the early stages of business due to the fact that profit generation is not a key goal yet (Baum et al., 2001; Mudambi et al., 2007). However, other performance measures may become relevant when the firm matures and when the focus is no longer mainly on reaching customers and building product awareness (Mudambi et al., 2007). Additionally, firm survival is a binary, and therefore rather simplistic, measure (yes or no) and other more diverse measures might prove to be more insightful in the later stages of business. Alternative dependent variables may be financial measures such as profit, sales or market share performance.
7. CONCLUSION
32
industry dynamism into account. The findings suggest that effectuation and partially industry uncertainty can explain firm survival on 2004 and 2014. Causation seems to not contribute to the explanatory value of models containing effectuation. New insights into the relationship between causation, effectuation and firm survival could be obtained from combining the existing empirical data with additional qualitative data that counteract the limitations listed above.