Modulated Raman spectroscopy for
enhanced identification of bladder tumor
cells in urine samples
Elisabetta Canetta
Michael Mazilu
Anna Chiara De Luca
Antonia E. Carruthers
Kishan Dholakia
Sam Neilson
Harry Sargeant
Tina Briscoe
Journal of Biomedical Optics 16(3), 037002 (March 2011)
Modulated Raman spectroscopy for enhanced
identification of bladder tumor cells in urine samples
Elisabetta Canetta,aMichael Mazilu,aAnna Chiara De Luca,aAntonia E. Carruthers,aKishan Dholakia,aSam Neilson,b
Harry Sargeant,bTina Briscoe,bC. Simon Herrington,band Andrew C. Richesb
aUniversity of St Andrews, SUPA-School of Physics and Astronomy, North Haugh, St Andrews, KY16 9SS, United
Kingdom
bUniversity of St Andrews, School of Medicine, Medical and Biological Sciences Building, North Haugh, St Andrews,
KY16 9TF, United Kingdom
Abstract. Standard Raman spectroscopy (SRS) is a noninvasive technique that is used in the biomedical field to discriminate between normal and cancer cells. However, the presence of a strong fluorescence background detracts from the use of SRS in real-time clinical applications. Recently, we have reported a novel modulated Raman spectroscopy (MRS) technique to extract the Raman spectra from the background. In this paper, we present the first application of MRS to the identification of human urothelial cells (SV-HUC-1) and bladder cancer cells (MGH) in urine samples. These results are compared to those obtained by SRS. Classification using the principal component analysis clearly shows that MRS allows discrimination between Raman spectra of SV-HUC-1 and MGH cells with high sensitivity (98%) and specificity (95%). MRS is also used to distinguish between SV-HUC-1 and MGH cells after exposure to urine for up to 6 h. We observe a marked change in the MRS of SV-HUC-1 and MGH cells with time in urine, indicating that the conditions of sample collection will be important for the application of this methodology to clinical urine samples.C2011 Society of Photo-Optical Instrumentation Engineers (SPIE). [DOI: 10.1117/1.3556722]
Keywords: Raman spectroscopy; modulation spectroscopy; bladder cancer.
Paper 10590R received Nov. 1, 2010; revised manuscript received Jan. 18, 2011; accepted for publication Jan. 31, 2011; published online Mar. 29, 2011.
1 Introduction
Currently, a variety of diagnostic tests are used to detect bladder cancer.1However, these techniques are costly and time
consum-ing for both hospitals and patients. In addition, most of these diagnostic tools require the expertise of a cytopathologist, radi-ologist (e.g., intravenous urography, computed tomography and magnetic resonance urography), or urologist (e.g., cystoscopy). This approach is the underlying reason for a “lack of progress” in the early diagnosis of bladder cancer.1A delay in the detection
of invasive bladder cancer increases the risk of bladder cancer death.2Therefore, it is crucial to develop an inexpensive, nonin-vasive, highly sensitive, rapid, and easily automated technique to diagnose bladder cancer in its early stages.
In the last decade, Raman spectroscopy (RS) has been used for the discrimination of normal cells from bladder and prostate cancer cells on the basis of their biochemical fingerprints.3RS has considerable potential as a diagnostic tool for the classifi-cation of normal and cancer cells due to its noninvasive nature and capability to predict pathological diagnosis in real time.4
However, the use of this spectroscopic technique is dramatically limited by the presence of strong fluorescence signals. These
oc-Address all correspondence to: Elisabetta Canetta, University of St Andrews, SUPA-School of Physics and Astronomy, St Andrews KY16 9SS, United Kingdom. Tel: +44 (0)1334 46 3124; Fax: +44 (0)1334 46 3104; E-mail: [email protected].
Michael Mazilu, University of St Andrews, SUPA-School of Physics and Astron-omy, St Andrews, KY16 9SS, United Kingdom. Tel:+44 (0)1334 46 3210; Fax:
+44 (0)1334 46 3104; E-mail: [email protected].
Andrew C. Riches, University of St Andrews, School of Medicine, St Andrews, KY16 9TF, United Kingdom. Tel:+44 (0)1334 46 3603; Fax:+44 (0)1334 46 3482; E-mail: [email protected].
cur in the same spectral window as the inherently weak Raman signals from biomedical samples and therefore hide these Raman peaks. In the last 30 years several fluorescence-suppression methods have been developed, all with the aim of removing the fluorescence background and isolating the Raman signals.5–11
These methods include polynomial fitting,10 time-resolved
Raman spectroscopy,12 polarization modulation technique,13 and shifted excitation Raman difference spectroscopy.14Though
each of these techniques has been demonstrated to be useful in specific situations, they are not without limitations.
Recently, we developed a simple innovative method, mod-ulated Raman spectroscopy (MRS), that is able to filter out the Raman spectra from the fluorescence background.15,16The
method is based on the wavelength shift of the Raman peaks as the wavelength of the excitation laser is continuously modulated while the fluorescence background remains static. By using an algorithm based on principal component analysis (PCA) of the raw data, mostly fluorescence-free Raman spectra are obtained. This method exposes even very weak Raman features generally masked by the fluorescence. Additionally, the signal-to-noise ra-tio of the modulated Raman spectra is greatly improved, reduc-ing the necessary accumulation time and permittreduc-ing real-time applications.
In this paper, we present the application of MRS to the iden-tification of fixed urothelial and bladder tumor cells exposed to urine for up to 6 h. We model the effects of urine on exfoliated cells by using urothelial and malignant human bladder cell lines. We validate the use of the MRS technique to discriminate be-tween fixed urothelial cells and cancer cells not exposed to urine
Canetta et al.: Modulated Raman spectroscopy for enhanced identification...
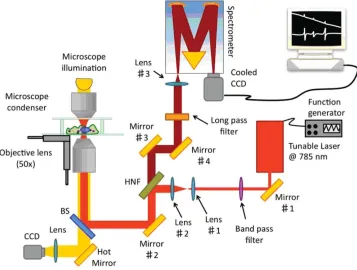
Fig. 1 Experimental setup (not to scale): A laser beam is expanded through a telescope formed by Lens #1 and Lens # 2 lenses and reflected from a 45◦holographic notch filter (HNF) and focused on the sample by an objective lens (50×). The Raman scatter from the sample is collected by the same microscope objective and filtered by the same HNF. It is then guided toward the spectrometer and acquiredviaa liquid nitrogen cooled CCD camera.
by comparing modulated Raman (MR) spectra of these cells to the corresponding standard Raman (SR) spectra. The ability of MRS compared to standard Raman spectroscopy (SRS) to clas-sify urothelial cells and cancer cells is then assessed by carrying out PCA on both the SR and MR spectra. We then mimic a sce-nario closer to a real clinical setting by exposing urothelial cells and bladder cancer cells to urine for different lengths of time up to 6 h. The ability of MRS to classify urothelial cells and cancer cells correctly in urine is assessed by multivariate analysis.
2 Materials and Methods
2.1 Experimental Set-Up
The MR microscopy system is shown in Fig.1. The setup is iden-tical to that used for standard Raman17but for the laser which is a tunable diode laser (Sacher Lasertechnik, TEC-520–0780-100, external cavity diode laser in a Littman configuration, total tun-ing range 25 nm) operattun-ing at 785 nm and with a maximum power of 100 mW. Additionally, an external arbitrary wave-form/function generator (Keithley, 3390 50 MHz) is connected to the tunable laser to modulate the wavelength at frequencies as low as a few millihertz.
2.2 Cell Lines and Sample Preparation
Human urothelial cells (SV-HUC-1) were cultured in the fol-lowing medium: F-12 nutrient mixture with L-glutamine (Ham-GIBCO 21765), with added human insulin 5 μg/ml, hydro-cortisone 1 μg/ml, transferrin 5 μg/ml, glucose 2.7 mg/ml (Sigma), nonessential amino acids 0.1 mM (Gibco), penicillin 100μg/ml, streptomycin 100 U/ml (Sigma), and fetal calf serum
1% (Globepharm). The SV-HUC-1 cells had been immortalized by transformation with simian virus 40 (SV40).18
A cell line derived from a recurrent human bladder tumor (MGH-U1) was maintained in long-term culture.19It has been shown that the MGH cell line is the same as the T24 cell line, also derived from a recurrent bladder tumor.20MGH-U1 cells were
cultured in the following medium: GIBCO D-MEM:F12 (1:1) with added fetal calf serum 7% (Globepharm), penicillin 100 μg/ml, L-glutamine 2 mM, and streptomycin 100 U/ml (Sigma). Cells from each cell line were incubated for up to 6 h in a fresh urine sample that had been filtered through a 0.22-μm Mil-lipore filter. These samples were collected from healthy donors with full ethical approval (approval number MD5091). Cell viability was assessed by sampling the cells at different times in urine and incubating the cells with 1% Fast Green [CI (color index number) 42053, Sigma Chemical Co. Ltd.] for 5 min. The proportion of cells that excluded the dye was recorded.
Further samples incubated in urine were diluted in a large volume of medium and plated in microtiter plates to assess their reproductive capacity. Following 4 days culture, viability was assessed by adding 10μl of cell counting reagent (Dojindo kit CK04) and incubating the plates for a further 3 h, after which the optical density was measured using a Dynex MRX reader at a wavelength of 450 nm.
[image:3.630.137.494.75.345.2]Canetta et al.: Modulated Raman spectroscopy for enhanced identification...
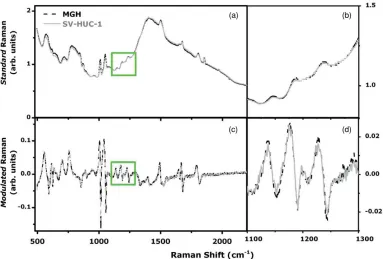
Fig. 2 (a) Mean standard Raman spectrum of fixed urothelial (SV-HUC-1) and bladder cancer cells (MGH) not exposed to urine (control). (b) Zoom on region 1100 to 1300 cm−1. (c) Mean modulated Raman spectra of control fixed SV-HUC-1 and bladder cancer MGH cells. (d) Zoom on region
1100 to 1300 cm−1.
(PBS) and re-suspended in 100μl of PBS to concentrate the cells.
The sample chamber used in the Raman experiments was made by using a 80-μm deep vinyl spacer between a quartz slide (1 mm in thickness) and a quartz coverslip (150μm in thickness) (UQG, United Kingdom). 20μl of cell suspension was placed inside the chamber and the cells were allowed to sediment onto the inverted quartz coverslip for∼30 min before starting the Raman experiments.
2.3 Method and Spectral Analysis
Single cell standard spectra were acquired from 40 fixed urothe-lial cells (SV-HUC-1) and 40 fixed bladder cancer cells (MGH cells) exposed to urine for 0 h (control), 30 min, 3 and 6 h. The background spectra were also acquired. The laser power on the sample during signal acquisition was∼8 mW, and each spec-trum was collected in the range from 500 to 2100 cm−1with an integration time of 200 s. The laser beam, during acquisition, was focused on the cell nucleus.
For each cell, 40 stacked spectra were recorded with an acqui-sition time of 5 s each while the laser wavelength was modulated with a ramp wave of 50% symmetry, a modulation frequency of 40 mHz, and a modulation amplitude of 60 GHz (corresponding to 0.2 nm at this wavelength). The 40 stacked spectra were then analyzed by using a custom designed MATLAB script based on the PCA method for fluorescence suppression, and modulated Raman spectra of the cells were obtained. These modulation pa-rameters were chosen to maximize the signal-to-noise ratio (data not shown). Indeed, higher modulation frequencies decrease the 1/fnoise level while increasing the shot noise.16
To evaluate the SR and MR spectra of control and urine-stressed HUC and MGH cells and to compare different
cell classes against each other, PCA21 was carried out. The
specificity/sensitivity and, more generally, the confusion matrix was determined using a leave-one-out procedure in which each spectrum is classified against the PCA of all the other spectra. The overall efficiency was defined as the proportion of cells classified correctly.
3 Results and Discussion
3.1 Cell Viability
The viability of both the urothelial cells and the bladder tumor cells decreased with time in urine as assessed by dye exclusion. After 1 h the viability decreased to (60 ± 2)% for the tumor cells and (64 ± 4)% for the urothelial cell line. In contrast, the reproductive capacity of both cells decreased rapidly after incubation in urine. After 20 min the tumor cells had almost completely lost reproductive integrity and the urothelial cells demonstrated a similar decline by 40 min.
3.2 Standard and Modulated Raman Spectra for Control Fixed SV-HUC-1 and MGH Cells
To test the robustness of the MRS technique compared to SRS, fixed urothelial cells (SV-HUC-1) and bladder cancer cells (MGH) not exposed to urine (control) were characterized by both MRS and SRS.
[image:4.630.123.506.73.332.2]Canetta et al.: Modulated Raman spectroscopy for enhanced identification...
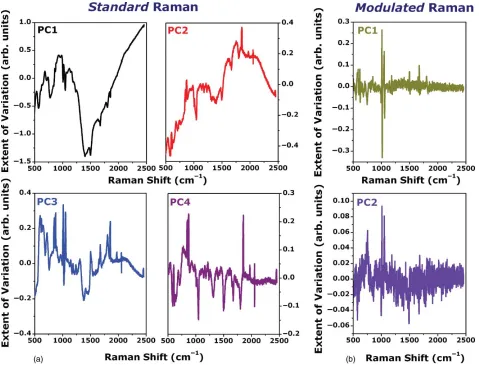
Fig. 3 (a) First four principal components generated by the analysis of SR spectra for control MGH cells. (b) First two principal components generated by the analysis of MR spectra for control MGH cells.
the analyzed sample [Fig.2(b)]. Conversely, in the MR spectra of SV-HUC-1 and MGH cells [Fig.2(c)] the Raman peaks of the chemical constituents of the cells can be clearly observed [Figs.2(c)and2(d)]. This facilitates the assignment of individ-ual peaks based on previous data.22 To carry out an objective
comparison between the urothelial cell (SV-HUC-1) and cancer cell (MGH) spectra, each spectrum is normalized to the height of the double peak in the region 950 to 1100 cm−1. This
nor-malization is applied to the whole spectrum. Comparing the rel-ative intensities of the spectral peaks for SV-HUC-1 and MGH spectra show that urothelial cells (SV-HUC-1) are characterized by relatively strong protein and carbohydrate Raman peaks, in the spectral region 1100 to 1300 cm−1, which suggest greater
concentrations of proteins and carbohydrates in nonmalignant cells.23In contrast, the spectra from bladder cancer cells (MGH)
show a significant increase in the peaks pertaining to ring breath-ing modes in DNA bases, such as 669, 727, 785, 828, 1095, and 1578 cm−1, suggesting an increase in the DNA concentration of
bladder cancer cells. Tumor cells commonly exhibit an increase in DNA content in the nucleus.
The ability of modulated Raman spectroscopy, compared to standard Raman spectroscopy, to discriminate between control urothelial cells (SV-HUC-1) and bladder cancer cells (MGH) was assessed using PCA. In the PCA carried out on the SR and
MR spectra of the SV-HUC-1 and MGH cells, 40 SV-HUC-1 spectra were compared with 40 MGH spectra.
As clearly observed in Fig.2(a), the standard spectra show a very strong background intensity (cell autofluorescence), upon which the Raman spectra are superimposed. This behavior is also clearly visible in the first two principal components shown in Fig.3(a).
[image:5.630.78.557.73.438.2]Canetta et al.: Modulated Raman spectroscopy for enhanced identification...
Fig. 4 (a) PCA of all individual SR spectra and (b) PCA of all individual MR spectra for 40 control SV-HUC-1 and 40 MGH cells.
shown in Fig.4(a). The two cell types do not form distinct and separate clusters, giving a sensitivity of 97% and a specificity of 72%.
The spectra recorded via MR spectroscopy have advantages over the SR spectra when used in a multivariate analysis such as PCA. First, PCA relies on a normal distribution of the noise, which might not be the case for SR spectroscopy due to the positive nature of the spectral intensity. On the contrary, the MR spectra oscillate between negative and positive values [Fig.2(b)] and therefore the noise of the MR spectra can have a normal distribution. Further, MR spectra are background-free and the Raman contribution is already present in the first two PCs as clearly observed in Fig.3(b).
The plot of the first two main PCs for the MR spectra of SV-HUC-1 and MGH cells are shown in Fig.4(b), revealing the presence of two very distinct clusters, one for SV-HUC-1 cells and the other for MGH cells. These findings indicate that when
Fig. 5 PCA of all individual MR spectra for 40 SV-HUC-1 and 40 MGH cells exposed to urine for 6 h.
PCA is carried out on the MR spectra its ability to discriminate between SV-HUC-1 and MGH cells is improved. Therefore, the 1st and 2nd components, containing the most pertinent Raman information, can be used to discriminate between SV-HUC-1 and MGH modulated spectra resulting in excellent sensitivity (98%) and specificity (95%).
3.3 Modulated Raman Spectroscopy of
Urine-Stressed Urothelial Cells (SV-HUC-1) and Bladder Cancer Cells (MGH)
To mimic a scenario as close as possible to a clinical setting, the effects of urine on the Raman spectra and hence the biochemistry of urothelial cells (SV-HUC-1) and bladder cancer cells (MGH) were investigated. The two types of cells were exposed to urine for different lengths of time up to 6 h and MR spectroscopy was carried out following fixation of the SV-HUC-1 and MGH cells. First, 40 urine-stressed SV-HUC-1 cell spectra were com-pared with 40 urine-stressed MGH cell spectra to assess the ability of multivariate analyses of MR spectra to differentiate be-tween SV-HUC-1 and MGH cells after exposing them to urine for 6 h. The plots of the first two PCs against each other for MR spectra of stressed SV-HUC-1 and MGH cells are shown in Fig.5.
PCA comparing the MR spectra of HUC cells exposed to urine for 6 h show distinct, separate clusters for the two stressed cell types. Even after 6 h exposure sensitivity and specificity are quite high: 80% sensitivity and 87% specificity compared to the control (0 h in urine) samples (sensitivity: 98% and specificity: 95%). The reason for the decrease could be the detrimental effect of urine on the biochemistry of the cells causing a reduc-tion of the signal-to-noise ratio in the MR spectra. Exposure to urine did affect the spectra, however multivariate analyses of the MR spectra could still discriminate between urothelial cells and bladder cancer cells which support the robustness of modulated Raman spectroscopy.
To gain a deeper understanding of the effect of urine on the biochemical signatures of SV-HUC-1 and MGH cells, 40
[image:6.630.68.297.72.294.2] [image:6.630.337.555.532.730.2] [image:6.630.78.286.561.729.2]Canetta et al.: Modulated Raman spectroscopy for enhanced identification...
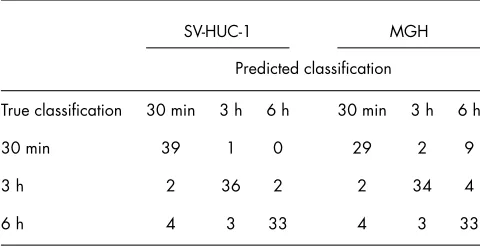
Table 1 Confusion matrix giving the classification for urine-stressed SV-HUC-1 and urine-stressed MGH.
SV-HUC-1 MGH
Predicted classification
True classification 30 min 3 h 6 h 30 min 3 h 6 h
30 min 39 1 0 29 2 9
3 h 2 36 2 2 34 4
6 h 4 3 33 4 3 33
urine-stressed SV-HUC-1 cell spectra from each time point were compared with each other to determine whether multivariate analyses can correctly predict how long the cells are exposed to urine [Fig. 6(a)]. The same analysis was carried out on 40 urine-stressed MGH cell spectra [Fig.6(b)].
PCA comparing the MR spectra of normal SV-HUC-1 cells exposed to urine for 30 min, 3 and 6 h [Fig.6(a)] shows distinct, separate clusters for each group of stressed cells. In particu-lar, the cells exposed to urine for 6 h are distinctly separated from the other clusters, probably due to larger alterations of their biochemical signatures caused by the long exposure to urine. A similar trend can be observed for urine-stressed MGH cells [Fig.6(b)] with well-separated clusters for each group of stressed cells. The separation of clusters of SV-HUC-1 cells is more pronounced than those from MGH cells, which may reflect differences in the rate of DNA breakdown and protein damage in the urine-stressed cells.
The main result of this analysis is the creation of a confusion matrix corresponding to the leave-one-out predictive classifica-tion of SV-HUC-1 after 30 min, 3 and 6 h exposure to urine (Table 1). The same confusion matrix was created for urine-stressed MGH cells (Table1). By analyzing the diagonal values of the confusion matrixes for SV-HUC-1 and MGH, we can ob-tain an overall predictive efficiency of about 90% for the urine-stressed SV-HUC-1 and of about 75% for the urine-stressed MGH. These results suggest that MGH bladder cancer cells are more sensitive to urine exposure than SV-HUC-1 urothelial cells. This is consistent with the rapid decrease in the cell viability and re-productive capacity of urine-stressed MGH cells compared to SV-HUC-1 cells.
4 Conclusions
MRS was applied to the discrimination of urothelial cells and bladder cancer cells from human cell lines exposed to urine.
The SR spectra of the control SV-HUC-1 and MGH cells were classified with an efficiency of 85%, while the corre-sponding MR spectra were identified with an efficiency of 97%, demonstrating the superiority of MRS over SRS for the charac-terization and classification of these cell types. We observed that MR spectra of urine-stressed urothelial cells and bladder can-cer cells succeeded in correctly predicting how long the cells were exposed to urine with an efficiency of 95% for normal SV-HUC-1 cells and 97% for cancer MGH cells.
The high sensitivity, specificity, and efficiency obtained from multivariate analyses on MR spectra of urothelial cells and blad-der cancer cells in urine demonstrates the great potential of MRS as a rapid, inexpensive, and accurate clinical tool to detect the presence of bladder cancer cells in urine samples.
Acknowledgments
Human urothelial (SV-HUC-1) and bladder tumor cell (MGH-U1) lines were kindly supplied by Dr. Catherine Reznikoff and Professor John Masters, respectively. The work was partly funded by the CSO and CR-UK/EPSRC/MRC/DoH (England) Imaging Programme. K. D. is a Royal Society-Wolfson Merit Award Holder. A.C.D.L. is an EPSRC research fellow.
References
1. M. Araki, A. M. Nieder, M. Manoharan, Y. Yang, and M. S. Soloway, “Lack of progress in early diagnosis of bladder cancer,”Urology69(2), 270–274 (2007).
2. F. Liedberg, H. Anderson, Å. M˚ansson, and W. M˚ansson, “Diagnostic delay and prognosis in invasive bladder cancer,”Scand. J. Urol. Nephrol.
37(5), 396–400 (2003).
3. T. J. Harvey, C. Hughes, A. D. Ward, E. Correia Faria, A. Henderson, N. W. Clarke, M. D. Brown, R. D. Snook, and P. Gardner, “Classi-fication of fixed urological cells using Raman tweezers,”J. Biophoton.
2(1–2), 47–69 (2009).
4. E. C. C. Cauberg, D. M. de Bruin, D. J. Faber, T. G. van Leeuwen, J. J. M. C. H. de la Rosette, and T. M. de Reijke, “A new generation of optical diagnostics for bladder cancer: technology, diagnostic accuracy, and future applications,”Eur. Urol.56(2), 287–297 (2009).
5. A. Z. Genack, “Fluorescence suppression by phase-resolved modula-tion Raman-scattering,”Anal. Chem.56(14), 2957–2960 (1984). 6. A. Shreve, N. Cherepy, and R. Mathies, “Effective rejection of
fluo-rescence interference in Raman spectroscopy using a shifted excitation difference technique,”Appl. Spectrosc.46(4), 707–711 (1992). 7. C. Xie and Y. Li, “Confocal micro-Raman spectroscopy of single
biological cells using optical trapping and shifted excitation difference techniques,”J. Appl. Phys.93(5), 2982–2986 (2003).
8. I. G. Cormack, M. Mazilu, K. Dholakia, and C. S. Herrington, “Fluorescence suppression within Raman spectroscopy using annular beam excitation,”Appl. Phys. Lett.91(2), 023903 (2007).
9. J. Zhao, H. Lui, D. McLean, and H. Zeng, “Automated fluorescence background subtraction algorithm for biomedical Raman spectroscopy,”
Appl. Spectroscop.61(11), 1225–1232 (2007).
10. B. Beier and A. Berger, “Method for automated background subtraction from Raman spectra containing known contaminants,”Analyst.134(6), 1198–1202 (2009).
11. G. Rusciano, A. C. De Luca, G. Pesce, and A. Sasso, “Phase-sensitive detection in Raman tweezers,”Appl. Phys. Lett.89(26), 261116 (2006). 12. F. Knorr, Z. J. Smith, and S. Wachsmann-Hogiu, “Development of a time-gated system for Raman spectroscopy of biological samples,”
Opt. Express18, 20049–20058 (2010).
13. S. M. Angel, M. K. Dearmond, K. W. Hanck, and D. W. Wertz, “Computer-controlled instrument for the recovery of a resonance Raman spectrum in the presence of strong luminescence,”Anal. Chem.
56, 3000–3001 (1984).
14. S. T. McCain, R. M. Willett, and D. J. Brady, “Multi-excitation Raman spectroscopy technique for fluorescence rejection,”Opt. Express16, 10975–10991 (2008).
15. A. C. De Luca, M. Mazilu, A. C. Riches, C. S. Herrington, and K. Dholakia, “Online fluorescence suppression in modulated Raman spectroscopy,”Anal. Chem.82(2), 738–745 (2010).
Canetta et al.: Modulated Raman spectroscopy for enhanced identification...
18. B. J. Christian, L. J. Loretz, T. D. Oberley, and C. A. Reznikoff, “Characterisation of human uroepithelial cells immortalised in vitro by simian virus 40,”Cancer Res47(22), 6066–6073 (1987).
19. J. R. W. Masters and P. J Hepburn, “Human bladder cancer in vitro drug sensitivities: Range and stability in long-term culture,”Br. J. Cancer
54, 131–135 (1986).
20. C. M. O’Toole, S. Povey, P. Hepburn, and L. M. Franks, “Identity of some human bladder cancer cell lines,”Nature (London)301(5899), 429–430 (1983).
21. J. W. Chan, D. S. Taylor, T. Zwedling, S. M. Lane, K. Ihara, and T. Huser, “Micro-Raman spectroscopy detects individual neoplas-tic and normal hematopoieneoplas-tic cells,” Biophys. J. 90(2), 648–656 (2006).
22. I. Notingher, “Raman spectroscopy cell-based biosensors,”Sensors
7(8), 1343–1358 (2007).