Anne-Marie Weijmans1on behalf of the MaNGA team
1School of Physics and Astronomy, University of St Andrews, North Haugh, St Andrews, KY16 9SS, UK;amw23@ st-andrews.ac.uk
Abstract. MaNGA (Mapping Nearby Galaxies at APO) is a galaxy integral-field spectroscopic survey within the fourth generation Sloan Digital Sky Survey (SDSS-IV). It will be mapping the composition and kinematics of gas and stars in 10,000 nearby galaxies, using 17 differently sized fiber bundles. MaNGA’s goal is to provide new insights in galaxy formation and evolution, and to deliver a local benchmark for current and future high-redshift studies.
1. Introduction
Multi-object spectroscopy plays a large role in current research on galaxy formation and evolution. The Sloan Digital Sky Survey (SDSS) has provided spectra for a million local galaxies (York et al. 2000; Strauss et al. 2002), enabling us to study large samples of galaxies, and catch galaxies in rare and short-lived phases of galaxy evolution. By measuring the integrated spectroscopic properties of galaxy centres, large spectroscopic surveys have shown how galaxy properties such as morphology, age, metallicity and star formation rates vary with mass, environment and redshift.
In addition, integral-field or spatially resolved spectroscopy has pushed our un-derstanding of galaxies further. Not limited to single fiber spectroscopy covering only the central region of the galaxy, integral-field surveys provide us with resolved spectro-scopic properties over a large galaxy field-of-view. The SAURON survey (de Zeeuw et al. 2002) mapped the gas, stellar populations and kinematics of 72 local (z ≤ 0.01) early-type galaxies, and with the ATLAS3D survey (Cappellari et al. 2011) of 260 early-type galaxies, introduced a new kinematical classification scheme (Emsellem et al. 2007, 2011). The currently on-going CALIFA survey (Sánchez et al. 2012) includes both early- and late-type galaxies, with a total sample size of 600 galaxies.
To make larger (∼thousands of galaxies) integral-field surveys possible, multi-object integral-field spectroscopy is the way forward. The SAMI survey (Croom et al. 2012) uses a multiplexed fiber integral-field unit (IFU) to observe a total of 3400 galaxies (see also Bryant et al. 2015). With MaNGA (Bundy et al. 2015) we will be measuring resolved stellar and gas properties for a total of 10,000 galaxies. Apart from collecting millions of spectra to study galaxy evolution in local galaxies, MaNGA will also provide a much-needed local benchmark for current and future high-redshift stud-ies, such as with MUSE (Bacon et al. 2010) and MIRI (Wright et al. 2004). MaNGA is
required gas for this growth come from? What different processes are at play in the present growth of bulges and elliptical galaxies? How does quenching of star formation occur, and what role do internal and external processes play, including the environment? How are mass and angular momentum distributed in the different galaxy components, and how were these components affected during galaxy assembly processes over time? These science goals have been outlined in more detail in Bundy et al. (2015).
The MaNGA instrument, observing strategy and galaxy sample have been care-fully designed to provide answers to these questions. The sample size of 10,000 galax-ies has also been carefully considered: we want to study galaxgalax-ies as a function of stellar mass, environment and star formation rate. Binning our galaxy sample in these three parameters, we want a minimum of 50 galaxies in each bin, for 5σdetections (the sig-nificance of a detected difference between two bins being given as √n/2, withn the number of galaxies in each bin). If we require 6 bins in each of our three parameters, we arrive at a required sample size of 50×63 ∼10,000 galaxies.
3. Instrument design
The MaNGA instrument is a multi-object integral-field unit spectograph, consisting of 17 individual fiber IFUs. The fibers within each IFU are hexagonally packed, and the IFUs range in size from 12 arcsec diameter (19 fibers) to 32 arcsec diameter (127 fibers). These science IFUs are complemented with 12 mini-bundles consisting of just 7 fibers for the observations of standard stars for flux calibration, and 92 sky fibers associated with the science IFUs, for sky background measurements. Fig. 1 visualizes the different IFU sizes. Individual fibers have an outer diameter of 150µm and core diameter of 120µm, which translates to a diameter on sky of 2 arcsec. Deviations from a true hexagonal packing of individual fibers within the IFU have an RMS value of 3 µm, or 2 per cent of the outer diameter, and the filling factor is about 56 per cent. The IFUs and their sky fibers are integrated into plug-plate cartridges, that allow for a 3◦ field-of-view. Table 1 summarizes the MaNGA fiber hardware for each cartridge, with a total fiber budget of 1423 per cartridge, and 6 cartridges in use at Apache Point Observatory. More details on the design, production and performance of the IFUs are given in Drory et al. (2015).
The MaNGA fibers are fed into the BOSS spectrographs, which consist of an identical pair of dual beam spectrographs (Smee et al. 2013). With these spectrographs,
Figure 1. Photographs of MaNGA IFUs, ranging from the largest IFU (127 fibers, left) to the mini-bundle used for standard star observations (7 fibers, right). Individ-ual fibers deviate with an RMS of only 3µm from an ideal hexagonal packing. Image taken from Drory et al. (2015).
Table 1. Overview of the MaNGA instrument
Fiber IFU IFUs per cart Sky fibers per IFU Size on-sky (diameter) Comment (arcsec)
127 5 8 32
91 2 6 27
61 4 4 22
37 4 2 17
19 2 2 12
7 12 1 7 flux calibration mini-bundle
MaNGA has a wavelength coverage of 3600 - 10,300 Å, with a spectral resolution varying fromR∼1400 at 4000 Å toR∼2600 around 9000 Å.
4. Survey design
4.1. Galaxy sample
The MaNGA sample is constructed to have a flat distribution in stellar mass, and to have a uniform radial coverage for all galaxies. The fiber IFU distribution described above is optimized for these requirements, and a detailed discussion will be presented in Wake et al. (in prep). All MaNGA galaxies are selected from the SDSS main spectoscopic sample, using an extension of the NASA-Sloan Atlas (Blanton et al. 2011).
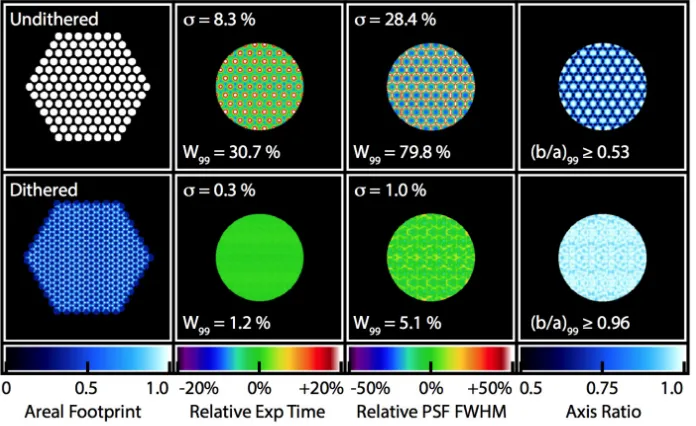
[image:3.612.106.548.345.441.2]The observing strategy for MaNGA is described in detail in Law et al. (2015). On average, the exposure time for a MaNGA plate to reach a target signal-to-noise S/N of 5 Å−1 fiber−1 is 3 hours, broken up in dithered sets of single exposures. We use a three-point dither pattern, with three 15-minute exposures producing a complete set. Dithering not only compensates for light losses between individual fibers in the IFUs, but also improves the regularity of the PSF (point-spread function) over the total area of the IFU, resulting in an improved image reconstruction in the final datacube. This is more quantatively illustrated in Fig. 2.
To ensure homogeneous quality of exposures within one set, we require that the (S/N)2 values in individual exposures within a set are within a factor of two of each other, and that the difference in atmospheric seeing within one set is less than 0.8 arcsec FWHM. The average seeing within one set must be less than 2.0 arcsec FWHM to ensure good spatial resolution. All exposures within one set must be taken within one hour of each other, to minimize irregularities caused by atmospheric refraction. Law et al. (2015) has an extensive discussion on these observing requirements, and shows detailed simulations supporting our observing strategy decision.
5. First results: P-MaNGA
To explore the instrument design and survey strategy for MaNGA we developed a proto-type instrument (P-MaNGA), for test observations at Apache Point Observatory in December 2012 and January 2013. Observing time for this test run was generously donated by the SDSS-III collaboration (Eisenstein et al. 2011). P-MaNGA used only one of the two available BOSS spectrographs, and consisted of eight IFUs (five 19-fiber IFUs, one 61-19-fiber IFU and two 127-19-fiber IFUs). The main difference between P-MaNGA and MaNGA lies in the calibration fibers: P-MaNGA had only 60 sky fibers distributed over two dedicated sky V-groove blocks, and therefore not associated with the IFUs as in the MaNGA design. P-MaNGA also did not have mini-bundles for stan-dard star observations, but instead used single fibers with larger diameters (3.0 and 5.0 arcsec) to account for aperture losses (see Yan et al. in prep). A detailed description of the P-MaNGA instrument and observing run can be found in Bundy et al. (2015).
Figure 2. The effect of dithering on PSF regularity and shape, illustrated with simulations. Top row: single exposure with 127-fiber IFU. Bottom row: dithered set of exposures with 127-fiber IFU. The first (most-left) column shows the footprint of the single fibers within the bundle. The second column illustrates the variations (in percentages) around the median exposure time within the bundle. The third column shows in percentages the deviations from the median FWHM of the PSF, while the fourth and most right colum shows the axis ratio (b/a) of the PSF. The numbers in the top corner of columns 2 and 3 indicate the RMS deviationsσ, while the numbers in the lower corner indicate the 3-σinterval that contains 99 per cent of all values W99. Dithering significantly improves the regularity of the PSF over the area of the
IFU. Figure taken from Law et al. (2015).
5.1. Emission line properties
Belfiore et al. (2015) presented emission line measurements for the galaxies observed with P-MaNGA. They constructed spatially resolved BPT (Baldwin, Phillips & Ter-levich 1981) diagrams to characterize the ionisation mechanisms responsible for the observed ratios in strong optical emission lines. They also included a comparison with stellar popuation indices such as the 4000 Å breakDn(4000) and the equivalent width (EW) of HδAto gain insight into the connection between the stellar population and ion-isation parameters. Three of the fourteen galaxies in their study harboured extended LINER-like emission in their centres, as well as highDn(4000) and low EW(HδA) val-ues, hinting at low star formation activity and an old and metal-rich stellar population. These galaxies are consistent with the so-called ’inside-out’ growth scenario. Further-more, Belfiore et al. (2015) found star formation activity in the extended discs of some galaxies that are dominated by Seyfert- and LINER-like emission in their centre, high-lighting the advantage that IFU observations have over single fiber data.
5.2. Star formation gradients
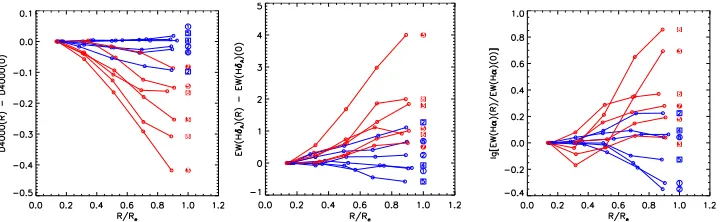
Figure 3. From left to right: Radial profiles ofDn4000, EW(HδA), and EW(Hα),
as measured in the P-MaNGA galaxy sample. The profiles are normalised to the first radial bin. The centrally star forming galaxies (blue) show mostly flat profiles, while the centrally quiescent galaxies (red) have increasingDn(4000) and increasing EW
of HδAand Hα. Figure taken from Li et al. (2015).
5.3. Stellar populations and dust
Wilkinson et al. (2015) produced detailed maps of stellar age, metallicity and mass, as well as dust extinction, for the galaxies in the P-MaNGA sample. They used their new full spectral fitting code FIREFLY (Wilkinson & Maraston, in prep) in combination with high-resolution stellar population models by Maraston & Strömbäck (2011). They recovered the dust displacement in stellar population property maps, thereby breaking the degeneracies between dust, age and metallicity. In addition to the maps, Wilkinson et al. (2015) derived radial gradients. They found negative metallicity gradients and flat age gradients for spheroidal galaxies, while in late-type galaxies the metallicity gradient is flat and the age gradient is negative, consistent with current literature (e.g. Yoachim & Dalcanton 2008; Kuntschner et al. 2010). Wilkinson et al. (2015) also provided an analysis of the effect of beam smearing on the derived maps and gradients, and found that this effect is larger for the smaller IFUs and more strongly affects light-weighted properties than mass-weighted properties. The effects of beam smearing on the different MaNGA IFU bundle sizes will be studied in more detail for the full MaNGA sample.
6. Conclusion
survey design, as well as three early science publications. All MaNGA data will be publicly available, and data releases will be announced on the SDSS website.
Acknowledgments. AW acknowledges support of a Leverhulme Trust Early Ca-reer Fellowship. Funding for the Sloan Digital Sky Survey IV has been provided by the Alfred P. Sloan Foundation and the Participating Institutions. SDSS-IV acknowledges support and resources from the Center for High-Performance Computing at the Univer-sity of Utah. The SDSS web site is www.sdss.org. SDSS-IV is managed by the Astro-physical Research Consortium for the Participating Institutions of the SDSS Collabo-ration including the Brazilian Participation Group, the Carnegie Institution for Science, Carnegie Mellon University, the Chilean Participation Group, Harvard-Smithsonian Center for Astrophysics, Instituto de Astrofísica de Canarias, The Johns Hopkins Uni-versity, Kavli Institute for the Physics and Mathematics of the Universe (IPMU)/ Uni-versity of Tokyo, Lawrence Berkeley National Laboratory, Leibniz Institut für Astro-physik Potsdam (AIP), Planck-Institut für AstroAstro-physik (MPA Garching), Max-Planck-Institut für Extraterrestrische Physik (MPE), Max-Max-Planck-Institut für Astronomie (MPIA Heidelberg), National Astronomical Observatory of China, New Mexico State University, New York University, The Ohio State University, Pennsylvania State Uni-versity, Shanghai Astronomical Observatory, United Kingdom Participation Group, Universidad Nacional Autónoma de México, University of Arizona, University of Col-orado Boulder, University of Portsmouth, University of Utah, University of Washing-ton, University of Wisconsin, Vanderbilt University, and Yale University.
References
Bacon, R., et al., 2010, SPIE, 7735, 773508
Baldwin, J.A., Phillips, M.M., & Terlevich, R., 1981, PASP, 93, 5 Belfiore, F., et al., 2015, MNRAS, 449, 867
Blanton, M., et al., 2011, AJ, 142, 31 Bryant, J.J., et al., 2015, MNRAS, 447, 2857 Bundy, K., et al., 2015, ApJ, 798, 7
Cappellari, M., et al., 2011, MNRAS, 413, 813 Croom, S.M., et al., 2012, MNRAS, 421, 872 de Zeeuw, P.T., et al., 2002, MNRAS, 329, 513 Drory, N., et al., 2015, AJ, 149, 77
Eisenstein, D.J., et al., 2011, AJ, 142, 72 Emsellem E., et al., MNRAS, 2007, 379, 401 Emsellem E., et al., MNRAS, 2011, 414, 888 Kuntschner, H., et al., 2010, MNRAS, 408, 97
Law, D.R., et al., 2015, AJ, in press (arXiv:1505.04285) Li, C., et al., 2015, ApJ, in press (arXiv:1502.07040) Maraston, C. & Strömbäck G., 2011, MNRAS, 418, 2785 Sánchez, S.F., et al., 2012, A&A, 538, A8
Smee, S.A., et al., 2013, AJ, 146, 32 Strauss, M.A., et al., 2002, AJ, 124, 1810 Wilkinson, D.M., et al., 2015, MNRAS, 449, 328 Wright, G.S., et al., 2004, SPIE, 5487, 653