Advance Access publication 2013 May 10
A new multifield determination of the galaxy luminosity function at
z
=
7–9 incorporating the 2012 Hubble Ultra-Deep Field imaging
R. J. McLure,
1‹J. S. Dunlop,
1R. A. A. Bowler,
1E. Curtis-Lake,
1M. Schenker,
2R. S. Ellis,
2B. E. Robertson,
3A. M. Koekemoer,
4A. B. Rogers,
1Y. Ono,
5M. Ouchi,
5S. Charlot,
6V. Wild,
7D. P. Stark,
3S. R. Furlanetto,
8M. Cirasuolo
1and T. A. Targett
11SUPA†, Institute for Astronomy, University of Edinburgh, Royal Observatory, Edinburgh EH9 3HJ, UK
2Department of Astrophysics, California Institute of Technology, MS 249-17, Pasadena, CA 91125, USA
3Department of Astronomy and Steward Observatory, University of Arizona, Tucson AZ 85721, USA
4Space Telescope Science Institute, 3700 San Martin Drive, Baltimore, MD 21218, USA
5Institute for Cosmic Ray Research, University of Tokyo, Kashiwa City, CHiba 277-8582, Japan
6UPMC-CNRS, UMR7095, Institut d’Astrophysique de Paris, F-75014, Paris, France
7School of Physics and Astronomy, University of St Andrews, North Haugh, St Andrews KY16 9SS, UK
8Department of Physics & Astronomy, University of California, Los Angeles, CA 90095, USA
Accepted 2013 April 10. Received 2013 April 5; in original form 2012 December 21
A B S T R A C T
We present a new determination of the ultraviolet (UV) galaxy luminosity function (LF)
at redshiftz 7 and 8, and a first estimate at z 9. An accurate determination of the
form and evolution of the galaxy LF during this era is of key importance for improving our knowledge of the earliest phases of galaxy evolution and the process of cosmic reionization. Our analysis exploits to the full the new, deepest Wide Field Camera 3/infrared imaging from ourHubble Space Telescope(HST) Ultra-Deep Field 2012 (UDF12) campaign, with dynamic range provided by including a new and consistent analysis of all appropriate, shallower/wider
areaHSTsurvey data. Our new measurement of the evolving LF atz7 to 8 is based on a
final catalogue of600 galaxies, and involves a step-wise maximum-likelihood determination
based on the photometric redshift probability distribution for each object; this approach makes full use of the 11-band imaging now available in the Hubble Ultra-Deep Field (HUDF),
including the new UDF12 F140W data, and the latestSpitzerIRAC imaging. The final result
is a determination of thez7 LF extending down to UV absolute magnitudesM1500= −16.75
(AB mag) and thez8 LF down toM1500= −17.00. Fitting a Schechter function, we find
M∗
1500= −19.90+−00..2328, logφ∗= −2.96+−00..1823 and a faint-end slopeα= −1.90+−00..1415 atz7,
andM1500∗ = −20.12−+00..3748, logφ∗= −3.35−+00..2847 andα= −2.02−+00..2223 atz8. These results
strengthen previous suggestions that the evolution atz >7 appears more akin to ‘density
evolution’ than the apparent ‘luminosity evolution’ seen atz5−7. We also provide the
first meaningful information on the LF atz9, explore alternative extrapolations to higher
redshifts, and consider the implications for the early evolution of UV luminosity density.
Finally, we provide catalogues (including derivedzphot,M1500and photometry) for the most
robustz∼6.5-11.9 galaxies used in this analysis. We briefly discuss our results in the context
of earlier work and the results derived from an independent analysis of the UDF12 data based on colour–colour selection.
Key words: galaxies: evolution – galaxies: formation – galaxies: high-redshift.
E-mail: [email protected]
†Scottish Universities Physics Alliance
1 I N T R O D U C T I O N
The advent of deep near-infrared (IR) imaging, in particular with Wide Field Camera 3 (WFC3/IR) on theHubble Space Telescope
(HST) has now enabled the discovery and study of galaxies to be
C
2013 The Authors Published by Oxford University Press on behalf of the Royal Astronomical Society
at University of St Andrews on August 13, 2014
http://mnras.oxfordjournals.org/
extended to redshiftsz 6.5–10, into the first billion years of cosmic history (see Dunlop 2012 for a review). This work is of fundamental importance for improving our understanding of the formation and growth of the early generations of galaxies, and test-ing the predictions of the latest galaxy formation simulations. It is also of interest for establishing whether these galaxies reionized the Universe (e.g. Robertson et al. 2010; Finkelstein et al. 2012; Kuhlen & Faucher-Gigu´ere 2012), and, if so, providing more de-tailed information on how reionization proceeded (as compared to the integrated constraints on ‘instantaneous’ reionization provided by current measurements of microwave background polarization –
zreion10.6±1.2; Komatsu et al. 2011).
Because galaxies atz7 are so faint, it is hard to gain detailed physical information on the properties of individual objects, and indeed only a handful of spectroscopic redshifts have been estab-lished on the basis of Lymanα(Lyα) emission atz7 (the current record holder is atz=7.213; Ono et al. 20121). Attention has thus (sensibly) focused on population statistics, helped by the fact that significant samples of photometrically selected galaxies can now be assembled at these redshifts due to the presence of a strong Lyman break atλrest1216 Å in their spectral energy distributions (SEDs). This is caused by near-complete absorption by neutral hydrogen gas along the line of sight atz >6.5 (Fan et al. 2006; Mortlock et al. 2011), making ‘Lyman-break’ galaxy (LBG) selection in principle straightforward at these redshifts, given adequate data.
The first and most important population measurement which is usually attempted once a significant sample of galaxies is available at a given redshift is a determination of the luminosity function (LF); i.e. the comoving number density of galaxies as a function of luminosity (≡absolute magnitude). Prior to the 2009 installation of WFC3/IR the availability of deepz850andi775imaging from the Advanced Camera for Surveys (ACS) onHSTenabled the ultraviolet (UV) (λrest1500 Å) LF to be established for faint galaxies out to
z6 by Bouwens et al. (2007). In a complementary effort based on the new availability of degree-scale red/IR imaging from ground-based telescopes, the bright end of the UV LF was also measured out toz 6 by McLure et al. (2009), who demonstrated that a combined analysis yielded a consistent result. Both of these studies exploited the available photometry to establish the presence/location of the aforementioned Lyman break, but whereas Bouwens et al. (2007) continued with the simple and well-established two colour selection technique, McLure et al. (2009) used SED fitting with evolutionary synthesis models (e.g. Bruzual & Charlot 2003) to derive photometric redshifts based onallof the available multiband photometry.
These two alternative approaches to galaxy selection have now both been exploited to explore the form of the LF at higher redshifts. Specifically, with the new first epoch deep WFC3/IR data provided by the Ultra-Deep Field 2009 (UDF09) programme (GO 11563, PI: Illingworth), Oesch et al. (2010a) and McLure et al. (2010) pro-duced alternative (but again consistent) determinations of thez 7 galaxy UV LF. The SED fitting approach was also exploited by Finkelstein et al. (2010), while colour–colour selection has since been re-applied by Bouwens et al. (2011b) atz7 and 8, to the fi-nal UDF09 data set. Colour–colour selection has also recently been applied in attempts to constrain the brighter end of the LF atz8 by Bradley et al. (2012) and Oesch et al. (2012b), to the Brightest of the Reionizing Galaxies survey (BoRG)2and Cosmic
Assem-1We note that the claimed detection of a Lyαemitter atz=8.55 (Lehnert et al. 2010) now appears spurious (Bunker et al. 2013).
2https://wolf359.colorado.edu/
bly Near-Infrared Deep Extragalactic Legacy Survey (CANDELS; Grogin et al. 2011)3data sets, respectively. Meanwhile, SED fitting has been applied to the UDF09 and CANDELS Great Observatories Origins Deep Survey South (GOODS-S) data by Finkelstein et al. (2012) in order to derive a new estimate of the evolving UV lumi-nosity density, and by Bowler et al. (2012) in the search for brighter
z 7 galaxies in the early UltraVISTA data (McCracken et al. 2012).4
It is important to note that, given only three filter data (i.e. two wavebands above a putative Lyman break and one below), colour– colour selection and SED fitting are essentially equivalent. However, as the number of useful wavebands expands, it is clear that SED fit-ting makes more complete and consistent use of the available data. This has, to some extent, been recognized by the adoption of addi-tional criteria to colour–colour selection, in an attempt to ‘factor-in’ the extra information provided through other filters (e.g. the rejec-tion of objects which shows more than one>1.5σdetection in bluer bands and the computation of a separateχ2
opticalby Bouwens et al. 2011b). However, SED fitting clearly deals with all detections and non-detections in a more straightforward and consistent manner, and has the additional benefit of providing actual redshift estimates with confidence intervals (and indeed can provide a redshift proba-bility distribution for each object, albeit this depends somewhat on adopted priors; McLure et al. 2011). Finally, SED fitting also more clearly exposes the nature of potential interlopers (such as dusty red galaxies, post-starburst objects with strong Balmer breaks, and dwarf stars in our own galaxy) and provides clearer information on which data need to be improved to eliminate them (e.g. Dunlop 2012). Nevertheless, SED fitting and colour–colour selection both fundamentally rely on the Lyman break and, whatever the selection technique, careful simulation work is required to quantify selection bias, completeness and contamination in any determination of the evolving galaxy LF in the young universe.
In an attempt to make further progress, and in particular to extend the study of galaxies both to higher redshifts (z >8) and lower lumi-nosities (atz7–8) we have recently completed a new programme of even deeper near-IR imaging in the Hubble Ultra-Deep Field (HUDF; Beckwith et al. 2006) with WFC3/IR onHST. This new imaging campaign was completed in 2012 September (GO 12498, PI: Ellis, hereafter UDF12) and when combined with the existing UDF09 data provides the deepest ever near-IR images of the sky. The data have now been reduced and released to the public (Koeke-moer et al. 2013) through the team website.5Key elements of our observing strategy were the delivery of extremely deepY105data to more robustly identify galaxies atz8 and higher redshifts, and the addition of imaging through a new filter previously unexploited in the HUDF,J140, both to enable reliable galaxy discovery to be pushed beyondz 8.5 (with two filters longward of the Lyman break), and to enable more accurate SEDs to be determined for galaxies atz7 and 8. The final UDF12+UDF09 combined data set reaches the planned 5σ detection limits ofY105=30.0,J125= 29.5,J140=29.5 andH160=29.5 (in apertures of diameter 0.40, 0.44, 0.47, 0.50 arcsec, respectively, sampling 70 per cent of point source flux density in each waveband). The results of our search for galaxies atz >8.5 have already been reported by Ellis et al. (2013), while the new deep multiband data have now also been exploited by Dunlop et al. (2013) in a new determination of the UV spectral slopes of galaxies atz7−9 (with consequent implications for
3http://candels.ucolick.org 4http://www.ultravista.org 5http://udf12.arizona.edu
at University of St Andrews on August 13, 2014
http://mnras.oxfordjournals.org/
their stellar populations). Most recently, a new determination of galaxy sizes based on the UDF12 data set has been completed by Ono et al. (2013).
In this paper, we focus on utilizing the UDF12 data set, along with the ever growing shallower WFC3/IR imaging over wider areas, to undertake a new determination of the galaxy UV LF atz7 and 8. Crucially, the new ultra-deep imaging in the HUDF improves our ability to probe the faint end of the LF, better sampling the population of numerous faint galaxies (M1500>−18) which likely dominate the UV luminosity density and hence drive reionization. A key goal, therefore, is to better establish the faint-end slope,α, on which extrapolations to even fainter (as yet unobservable) luminosi-ties have to be based. However, simply increasing the depth of the deepest field does not yield significantly better estimates ofαunless the degeneracies between the Schechter function parameters (M∗,
φ∗andα) can be minimized (e.g. Bouwens et al. 2011b; Dunlop 2012). This requires maximizing the usable dynamic range in UV luminosity, to properly constrain the shape of the LF. Thus, to best determine thez7 and 8 LF, we have analysed the new HUDF12 data in combination with the progressively shallower WFC3/IR sur-vey data provided by the UDF09 parallel fields, the Early Release Science (ERS) data in GOODS-S, the CANDELS data in the re-mainder of GOODS-S and the UKIDSS Ultra-Deep Survey (UDS) field, and all of the parallel BoRG data obtained by 2012 September. In each of these fields, (including the HUDF) we have also utilized the associatedHSTACS imaging,SpitzerIRAC data (deconfused with the WFC3/IRH160imaging) and ground-based near-IR/optical data where appropriate.
Given that the selection functions and associated simulations are different, and to facilitate comparison with other work, our team has also undertaken a parallel, and completely independent determina-tion of the LF atz7 and 8 based on ‘traditional’ dropout colour– colour selection. The results from this are presented in Schenker et al. (2013) but are also summarized in this paper for ease of comparison with the SED fitting technique results derived here.
The remainder of this paper is structured as follows. In Sec-tion 2, we give full details of the data sets utilized in this new study, and explain how we selected galaxy catalogues before re-fining the samples to contain only plausible high-redshift galaxy candidates. We also describe the simulations undertaken to estab-lish completeness and contamination corrections in each of the individual survey fields, simulations which are crucial for a robust determination of the LF from such a complex multifield data set. Next, in Section 3, we describe how we chose to determine the LF, adopting as our primary technique the non-parametric step-wise maximum-likelihood (SWML) method, but also applying paramet-ric maximum-likelihood fitting to explore Schechter function rep-resentations of the LF. We then present the results of our analysis in Section 4, providing our best measurements of the LF atz 7, 8 and 9, and briefly exploring the implied evolution of the LF with redshift. Here, we also compare our results with the indepen-dent UDF12 analysis of Schenker et al. (2013), and discuss our derived LF parameters (with associated improved confidence in-tervals) in the context of the results deduced by Bouwens et al. (2011b), Bradley et al. (2012) and Oesch et al. (2012b) prior to UDF12. In Section 5, we proceed to explore the implications of our results for the evolution of the LF out to even higher redshifts, and derive the implied evolution of UV luminosity density as a function of redshift (a key measurement for tracking the likely progress of reionization). Finally, we present a summary of our conclusions in Section 6. Throughout the paper we will refer to the follow-ingHSTACS+WFC3/IR filters: F435W, F600LP, F606W, F775W,
F814W, F850LP, F098M, F105W, F125W, F140W and F160W as
B435, V600, V606, i775, i814, z850, Y098, Y105, J125, J140 and H160, re-spectively. All magnitudes are quoted in the AB system (Oke 1974; Oke & Gunn 1983) and all cosmological calculations assume
0=0.3, =0.7 andH0=70 km s−1Mpc−1.
2 DATA
In this section, we provide a summary of the basic properties of the data sets which we have utilized in this study to measure the high-redshift galaxy LF. In addition, we also provide details of the methods adopted to derive accurate image depth information, object photometry and reliable catalogues of high-redshift galaxy candidates.
2.1 Survey fields
The data sets analysed in this paper form a ‘wedding-cake’ structure ranging from the ultra-deep UDF12 observations covering an area of only4.5 arcmin2to wider area WFC3/IR survey data covering several hundred arcmin2. Below we provide the basic observational details of each data set in turn.
2.1.1 The UDF12
The data set which plays the pivotal role in constraining the faint end of the galaxy LF atz≥7 and provides the primary motiva-tion for this paper is the new UDF12 WFC3/IR multiband imaging of the HUDF (GO 12498, P.I. Ellis). The UDF12 observing cam-paign acquired 128 orbits of WFC3/IR integration time targeting the HUDF, all of which were obtained between 2012 August 4 and September 16.6As discussed in Section 1, the primary motivation for the UDF12 observing campaign was to improve our knowledge of number densities and spectral properties of the ultra-faint galaxy population atz=7 to 8 and to provide the first robust census of the
z≥8.5 galaxy population.
In order to achieve these aims the bulk of the UDF12 orbits were invested in quadrupling the HUDF integration time in the crucial
Y105filter and providing ultra-deep imaging in theJ140filter, which had not been employed in previous HUDF imaging campaigns. The 128 orbits awarded to UDF12 were allocated as follows: 72 orbits in theY105filter, 30 orbits in theJ140filter and 26 orbits inH160. In combination with the data provided by the previous UDF09 observing campaign (GO 11563, P.I. Illingworth), the total orbit allocation of dedicated WFC3/IR data in the HUDF now stands at: 96 orbits inY105, 34 orbits inJ125, 30 orbits inJ140and 79 orbits in
H160. The depths of the available data in the HUDF (and the other survey fields analysed in this study) are provided inTable 1. It should be noted that the depths quoted in Table 1 have been corrected to total magnitudes assuming a point source and that the raw aperture depths are 0.2−0.4 mag deeper, depending on the adopted aperture (see Section 2.3).
2.1.2 The HUDF09 parallel fields
To increase our ability to constrain the faint end of the high-redshift LF we have also utilized the WFC3/IR imaging available in the two parallel fields of the HUDF09 imaging campaign, hereafter HUDF09-1 and HUDF09-2. Although substantially shallower than
6The entire reduced UDF12 data set is publicly available at the following website: http://archive.stsci.edu/prepds/hudf12/
at University of St Andrews on August 13, 2014
http://mnras.oxfordjournals.org/
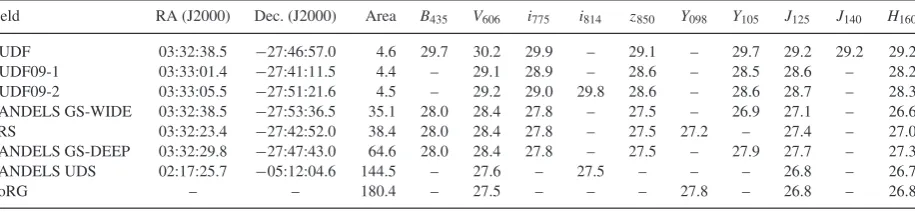
Table 1. The basic observational properties of the different WFC3/IR survey fields analysed in this work. Column 1 lists the adopted field name, columns 2 and 3 list the coordinates of the centre of the field and column 4 lists the survey area in arcmin2. Columns 5–14 list the global average 5σdepths, which have been corrected to total magnitudes assuming a point source (a typical correction of0.2 mag for ACS and0.4 mag for WFC3/IR; see Section 2.3 for a discussion of the apertures adopted in each filter). It should be noted that the depths within a given field can vary significantly (e.g. CANDELS GS-DEEP and BoRG). There are no coordinates listed for BoRG simply because it consists of a large number of widely separated pointings.
Field RA (J2000) Dec. (J2000) Area B435 V606 i775 i814 z850 Y098 Y105 J125 J140 H160
HUDF 03:32:38.5 −27:46:57.0 4.6 29.7 30.2 29.9 – 29.1 – 29.7 29.2 29.2 29.2
HUDF09-1 03:33:01.4 −27:41:11.5 4.4 – 29.1 28.9 – 28.6 – 28.5 28.6 – 28.2
HUDF09-2 03:33:05.5 −27:51:21.6 4.5 – 29.2 29.0 29.8 28.6 – 28.6 28.7 – 28.3
CANDELS GS-WIDE 03:32:38.5 −27:53:36.5 35.1 28.0 28.4 27.8 – 27.5 – 26.9 27.1 – 26.6
ERS 03:32:23.4 −27:42:52.0 38.4 28.0 28.4 27.8 – 27.5 27.2 – 27.4 – 27.0
CANDELS GS-DEEP 03:32:29.8 −27:47:43.0 64.6 28.0 28.4 27.8 – 27.5 – 27.9 27.7 – 27.3
CANDELS UDS 02:17:25.7 −05:12:04.6 144.5 – 27.6 – 27.5 – – – 26.8 – 26.7
BoRG – – 180.4 – 27.5 – – – 27.8 – 26.8 – 26.8
the data available in the HUDF itself, the HUDF09 parallel fields consist of 33 and 48 WFC3/IR orbits, respectively (spread between theY105, J125andH160filters), and provide crucial leverage for con-straining thez≥7 galaxy LF1.5 mag brighter than the ultimate depth achieved by UDF12. For the purposes of this analysis, we have utilized our own reduction of the HUDF09 WFC3/IR imaging in both parallel fields (drizzled on to a 30 mas pixel scale) and have also used our own reduction of the ACS imaging covering HUDF09-2 originally obtained as part of the HUDF05 campaign (GO 1063HUDF09-2, P.I. Stiavelli). For the HUDF and HUDF09-1 we have made use of the publicly available reductions of the original HUDF ACS imaging (Beckwith et al. 2006) and the HUDF05 ACS imaging, re-spectively. Finally, we have also made use of the new ultra-deepi814 ACS imaging (128 orbits) obtained as parallel observations during the UDF12 campaign, which provides a60 per cent overlap with HUDF09-2.
2.1.3 GOODS-S
In addition to the HUDF and parallel fields, we have made extensive use of the publicly available WFC3/IR imaging of the GOODS-S field provided by CANDELS (Grogin et al. 2011; Koekemoer et al. 2011). The CANDELS WFC3/IR data in GOODS-S cover a total of 24 WFC3/IR pointings which are divided into DEEP and WIDE subregions. The DEEP subregion consists of 15 WFC3/IR pointings each consisting of three orbits ofY105imaging and five orbits in bothJ125andH160. The WIDE subregion consists of nine WFC3/IR pointings each consisting of a single orbit of integration in theY105,
J125and H160 filters. In addition to the CANDELS imaging, we have also analysed the ERS data in GOODS-S, which consist of 10 WFC3/IR pointings, each of which was observed for two orbits in theY098,J125andH160filters (Windhorst et al. 2011).
The optical data we have employed in GOODS-S are the publicly available v2.0 reduction of the original GOOD-S ACS imaging in the B435, V606, i775 and z850 filters (Giavalisco et al. 2004). The total area of the overlapping WFC3/IR+ACS coverage we have analysed in GOODS-S is 138 arcmin2(excluding the HUDF and parallel fields). A summary of the available filters and depths is provided in Table 1.
2.1.4 The UKIDSS Ultra-Deep Survey Field
In order to significantly increase the total areal coverage of our data set, crucial for constraining the bright end of the z ≥ 7 galaxy LF, we have also analysed the publicly available CANDELS
WFC3/IR+ACS imaging in the UDS (Lawrence et al. 2007). The full CANDELS data set in the UDS consists of 44 WFC3/IR point-ings, each featuring 4/3 of an orbit ofH160imaging and 2/3 of an orbit inJ125. Along with the primary WFC3/IR observations, the CANDELS campaign in the UDS also obtained ACS parallels with each pixel typically receiving three orbits of integration ini814and one orbit inV606. However, due to the focal plane separation of the WFC3/IR and ACS cameras, only 32/44 of the WFC3/IR pointings are fully covered by the parallel ACS imaging. It is from these 32 WFC3/IR pointings, covering a total area of150 arcmin2, that we have selected our sample of high-redshift candidates in the UDS.
In addition to the primary HSTimaging data, in refining our high-redshift sample in the UDS we have also made extensive use of a variety of ground-based data sets. Amongst these the three most important are new ultra-deepz-band imaging obtained with Suprime-Cam onSubaruwhich reaches a depth ofz=26.5 (5σ; 1.8 arcsec diameter apertures), new ultra-deep VLT+HAWK-IY -band observations of the UDS CANDELS region obtained as part of the HUGS programme (P.I. A. Fontana) which reach a depth of
Y=26.5 (5σ; 1.25 arcsec diameter apertures) and the latest DR10 release of the UDSK-band imaging which reaches a depth ofK=
25.1 (5σ; 1.8 arcsec diameter apertures). Moreover, in order to clean the sample of low-redshift interlopers, we have utilized a stack of theBVRiSubaruimaging of the UDS described in Furusawa et al. (2008), which reaches a depth of≥29 (2σ; 1.8 arcsec diameter apertures). Finally, in order to further refine our photometric redshift solutions we have exploited narrow-band (NB921,λC= 9210Å)
imaging of the UDS (Sobral et al. 2011) which reaches a depth of
z921=26.0 (5σ; 1.8 arcsec diameter apertures).
2.1.5 BoRG
In order to increase our ability to constrain the bright end of thez= 8 LF, we have performed our own reduction and analysis (Bowler et al., in preparation) of the data taken by the BoRG survey (Trenti et al. 2011, 2012). BoRG is aHSTpure parallel programme, con-sisting of imaging in four filters from WFC3, designed to detect
z∼ 8 LBGs as Y098 dropouts. Details of the BoRG observation strategy can be found in Trenti et al. (2011), however briefly, pure parallel observations were obtained at multiple sightlines in the
Y098,J125,H160filters from WFC3/IR and one or both ofV606and
V600 with WFC3/UVIS. The exposure times are chosen to allow the detection ofY098 dropout galaxies atz∼ 8 based on a large
Y098−J125colour and relatively flat rest-frame spectral slope in-ferred from theJ125−H160colour.
at University of St Andrews on August 13, 2014
http://mnras.oxfordjournals.org/
At the time of writing, the complete BoRG data set consisted of 69 independent fields with a variety of different exposure times. How-ever, to homogenize the data set somewhat, we have restricted our analysis to the 41 BoRG fields with 5σdetection limits in the range
J125≥27.2−27.9 (0.44 arcsec diameter aperture), and which lie at high galactic latitude. The calibrated FLT files were obtained from theHSTarchive and background subtracted before being combined withASTRODRIZZLE(Gonzaga et al. 2012). The final pixel size was set to 80 mas to match the BoRG09 public reductions, using a large pix_frac (pix_frac=0.9 for multiple exposures and pix_frac=1.0 for single exposures) to account for the lack of dithering in the observations where the primary was often spectroscopic.
Based on these 41 fields (total area 180 arcmin2) an initial candi-date list was constructed using the colour cuts employed by Bradley et al. (2012), but based on our own photometry and depth analy-sis (see below). As with all the other survey fields analysed here, these candidates were then analysed with our photometric redshift code before being included in the LF analysis. To mitigate the in-creased photometric redshift uncertainties introduced by the small number of available filters, in our final analysis of the z=8 LF we include only those candidates selected from BoRG brighter than
M1500≤ −20.5.
2.2 Catalogue production
Given that the primary focus of this paper is the evolution of the galaxy LF atz≥6.5, by which point the Lyman break has been redshifted to an observed wavelengthλobs≥0.9µm, high-redshift galaxy candidate selection was performed exclusively in the near-IR using the WFC3/IR imaging available in each field.
In order to provide a master catalogue which was as complete as possible, objects were initially selected using each individual near-IR image and from every possible wavelength-contiguous stack of near-IR images. For example, based on the UDF12 data, four object catalogues were generated with SEXTRACTORv2.8.6 (Bertin & Arnouts 1996) using the individualY105,J125,J140andH160images for object detection and a further six catalogues were generated using the following near-IR stacks as the detection image:Y105+
J125 +J140+H160,Y105+J125 +J140,Y105+J125,J125+J140,
J125+J140+H160andJ140+H160.
From this initial set of 10 object catalogues, a master catalogue was constructed containing everyuniqueobject which was detected at≥5σ significance in any of the detection images. For those ob-jects which were present in multiple catalogues, the positional infor-mation and photometry based on the highest signal-to-noise ratio detection was propagated to the master catalogue. Although this specific example is within the context of the UDF12 data set in the HUDF, the general selection process was identical in each field, notwithstanding differences enforced by the number of available filters.
2.3 Photometry
When selecting samples of high-redshift galaxies, the choice of photometric apertures is inevitably a balance between optimizing depth and ensuring that it is possible to derive well-defined and stable aperture corrections. The photometry adopted in this study is all based on circular apertures, where the choice of aperture in each band is tuned to enclose≥70 per cent of the flux of the filter-specific point spread function (PSF). For those fields with data drizzled on to a 0.03 arcsec pix−1 grid, the photometry is based on 0.3 arcsec diameter apertures in the optical ACS bands
and 0.40, 0.44, 0.47 and 0.50 arcsec diameter apertures in theY105,
J125, J140 and H160 bands. For those data sets where the data is drizzled on to a 0.06 arcsec pix−1grid, we have adopted 0.40 arcsec diameter apertures in the optical ACS andY098/Y105WFC3/IR bands, together with 0.44 and 0.50 arcsec diameter apertures in theJ125 andH160 bands. For the purposes of the subsequent photometric redshift analysis (see below), the measured photometry inz850and the WFC3/IR filters was corrected to the same enclosed flux level as theB435, V606, i775 and i814photometry (typically 82–84 per cent) using the curve of growth of the observed PSFs in each band/field.
2.4 Depth analysis
A crucial element of reliable high-redshift candidate selection is the derivation of accurate information regarding the photometric depth of each available image. This information is clearly vital for the reliable exclusion of low-redshift contaminants, but is also required in order to provide the robust flux measurement errors necessary for accurate photometric redshift results.
For each survey field in turn, accurate maps of which pix-els contained significant object flux were constructed by stacking SEXTRACTORsegmentation maps for each available filter. Before stacking, the individual segmentation maps were dilated in order to better capture the extended wings of bright low-redshift objects. Based on these image maps, a large number of photometric aper-tures (typically 10–200 thousand) were located amongst the fraction of each image that had been determined to be dominated by ‘sky’. A robust estimator was then used to measure the sigma of the distribution of the fluxes measured within these sky apertures and thereby determine the empirical depth of the image for a given aper-ture diameter. This aperaper-ture-to-aperaper-ture rms depth measurement is a robust method of determining the actual significance of any aper-ture flux measurement and capaper-tures the true noise properties of a given image, which are typically underestimated by a simple mea-surement of the pixel rms due to small-scale noise correlations introduced by the reduction procedure (Koekemoer et al. 2013). Once the true depth of each image was determined in this fashion, the corresponding weight maps were scaled to match the empirical depth measurement. By including the scaled weight maps in the dual-mode catalogue production process, it was thereby possible to provide accurate, position dependent, flux measurement errors for each source.
2.5 High-redshift galaxy selection
In order to study thez≥ 7 LF it is necessary to derive reliable catalogues ofz≥6.5 galaxy candidates. Consequently, the mas-ter object catalogues for each survey field were initially cleaned of low-redshift contaminants by insisting that each object remained undetected at the 2σlevel in each filter shortward of thez850 wave-band. In addition, to exclude the small number of objects with 1.5−2σ detections in multiple blue optical filters, each high-redshift candidate was also required to be undetected at the 2σlevel in an inverse-variance-weighted stack of all filters shortward ofz850.
2.5.1 Photometric redshift analysis
After the initial exclusion of low-redshift contaminants, the mas-ter catalogues for each field were processed using our photometric redshift code. For a full description of the photometric redshift code the reader is referred to McLure et al. (2011), but we pro-vide a brief outline here for completeness. The photometry for
at University of St Andrews on August 13, 2014
http://mnras.oxfordjournals.org/
each galaxy is fitted with a range of galaxy templates, either em-pirical spectra or evolving synthetic galaxy-evolution models, with the best-fitting galaxy parameters determined viaχ2minimization. To ensure a proper treatment of the photometric uncertainties, the model fitting is performed in flux–wavelength space, rather than magnitude–wavelength space, and negative fluxes are included.
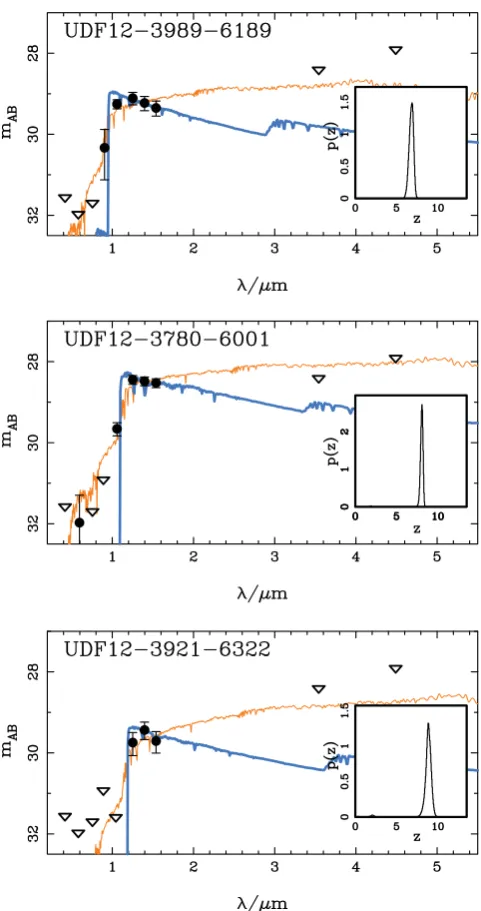
The code fits a wide range of reddening, based on the Calzetti et al. (2000) dust attenuation law, and accounts for IGM absorp-tion according to the Madau (1995) prescripabsorp-tion. If necessary, the code can also fit each high-redshift candidate including additional Lyα emission within a plausible range of rest-frame equivalent widths (chosen to be EW0≤240 Å; Charlot & Fall 1993). The best-fitting photometric redshifts and redshift probability density functions adopted here are based on Bruzual & Charlot (2003) stel-lar population models with metallicities of 0.2 or Z, although the exact choice of stellar population model has little impact on the derivedp(z) in most cases. Three examples of the results of our photometric redshift analysis are shown in Fig. 1; the three ob-jects illustrated have derived redshifts ofz6.9, 8.1 and 8.8 (see Table A1).
Based on the photometric redshift results, objects were excluded if it was impossible to obtain a statistically acceptable solution atz≥ 6.5 (typicallyχ2
best≥20), or if the photometric redshift probability density function indicated a very low probability that the object is atz≥6.5 [i.e.zz=6=∞.5p(z)dz≤0.05].
At this point, the catalogues were visually expected in order to remove spurious contaminants such as artefacts, diffraction spikes and overdeblended low-zobjects. Following this final cleaning step, and following the procedure of McLure et al. (2011), each object was classified asrobustorinsecuredepending on whether or not the best-fitting low-redshift solution could be ruled out at the 2σ confidence level. The objects classified asrobustconstitute our most reliable high-redshift galaxy sample and are presented in the Ap-pendix for comparison with the results of other similar studies and potential spectroscopic follow-up observations. However, it should be noted that all high-redshift candidates which survived the full selection process, whetherrobustorinsecure, were included in the LF analysis (see below).
2.5.2 Dwarf star exclusion
As has been widely discussed in the literature (e.g. Dunlop 2012; Bowler et al. 2012), ultra-cool galactic dwarf stars (M, L, & T dwarfs) are a potential source of low-redshift contamination of the bright end of the galaxy LF atz >6. Within the context of the current study, the most serious source of concern is potential contamination of thez=7 galaxy LF by T dwarf stars. To deal with this problem the photometry of all brightz7 LBG candidates was analysed using a library of empirical optical-to-near-IR dwarf star spectra spanning the spectral range M0 to T9, taken from the SpeX archive.7All bright candidates which returned a high-quality fit with a dwarf star template and had a measured WFC3/IR half-light radius which was consistent with being spatially unresolved were removed from the final sample.
2.6 Final galaxy sample
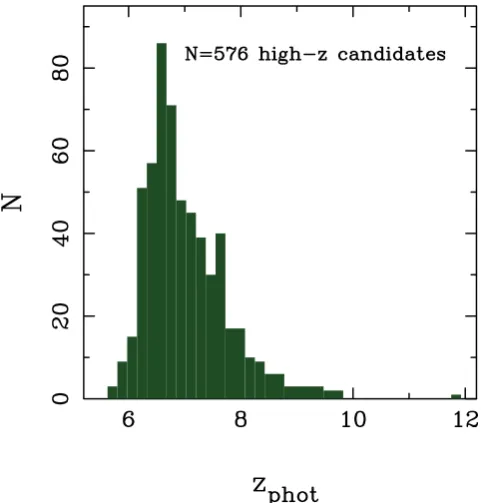
The final high-redshift galaxy sample utilized in this analysis com-prises a total of N = 576 galaxy candidates (robust+insecure) selected from a total survey area of 477 arcmin2. The
[image:6.595.308.549.52.508.2]photomet-7http://pono.ucsd.edu/ adam/browndwarfs/spexprism/
Figure 1. Examples of our photometric redshift analysis for three objects in the HUDF at redshiftsz=6.9, 8.1 and 8.8 (top to bottom). In each plot, the blue curve shows the best-fitting high-redshift solution, while the orange curve shows the best-fitting alternative low-redshift solution. In each case, the inset shows the photometric redshift probability density function,p(z), which is incorporated into our LF analysis. The upper limits at 3.6 and 4.5µm have been derived via our own deconfusion analysis of the ultra-deep IRAC imaging obtained by Labb´e et al. (2012), using the technique described in McLure et al. (2011). All upper limits are 1σ.
ric redshift distribution of this sample is shown in Fig. 2. The individual redshift probability distributions,p(z), of all these galax-ies were used in the LF determination. In Tables A1 and A2 in the Appendix, we provide a catalogue of the 100 most robust
z6.5−12.0 galaxies uncovered within the HUDF itself (i.e. from the UDF12 data), with positions, photometry, photometric red-shifts (including uncertainties), total absolute magnitudes (M1500) and cross-referencing to previous studies as appropriate. The cor-responding information for the robust objects in the other seven survey fields analysed here is provided in Tables A3–A9.
at University of St Andrews on August 13, 2014
http://mnras.oxfordjournals.org/
Figure 2. The photometric redshift distribution of the full sample of high-redshift galaxy candidates (robust+insecure) derived from our analysis of the eight survey fields listed in Table 1. The full sample consists ofN=576 high-redshift candidates selected from a total area of 477 arcmin2.
We note that the advance at faint magnitudes offered by the UDF12 data set is clear, because 50 of the 100 robustz > 6.5 HUDF galaxies tabulated in Table A1 have not been reported in any previous study. Of these additional 50, colour–colour selection (as described by Schenker et al. 2013) finds 23 sources. The remaining 27 galaxy candidates are only revealed by our photometric redshift analysis which exploits all of the 4-band WFC3/IR imaging. Note that, for simplicity, we have decided to report onlyH160magnitudes in Table A1, and so somerobustobjects may appear to be surpris-ingly faint inH160because they are better detected in the shorter wavelength WFC3/IR filters.
2.7 Simulations
The final result of the object selection process is a catalogue of can-didate high-redshift galaxies, each with an associated photometric redshift probability density function. However, in order to accu-rately derive the galaxy LF, it is then necessary to employ detailed simulations to map between the derived and intrinsic properties of each candidate.
Following the methodology of McLure et al. (2009), we adopt a parametric model of the evolving high-redshift galaxy LF in or-der to generate a realistic synthetic population of high-redshift galaxies. The model adopted here is a Schechter function with the three parameters (φ∗, MUV∗ , α) evolving linearly with redshift, changing from (9.8 ×10⁻⁴Mpc−3, −20.7,−1.65) atz=4.5 to (2.3×10⁻⁴Mpc−3,−20.1,−2.1) atz=9.0. Although simple, this parametrization successfully reproduces the observed evolution of the UV-selected galaxy LF within the redshift interval 5< z <8 (e.g. Bouwens et al. 2007, 2011b; McLure et al. 2009, 2010; Bradley et al. 2012).
For each survey field, the evolving LF model is used to populate an input apparent magnitude–redshift grid (m1500-z, wherem1500
is the apparent magnitude at 1500 Å), which is divided into cells of widthδz=0.05 andδm1500 =0.1. For each simulated object, synthetic photometry is generated using Bruzual & Charlot (2003) galaxy templates with a range of reddening designed to produce a population of objects whose distribution of UV slopes is centred onβ= −2 with a small dispersion (cf. Dunlop et al. 2012, 2013; Rogers, McLure & Dunlop 2013). The synthetic galaxies were then injected into the real data, using the empirical measurement of the WFC3/IR and ACS PSF appropriate for each individual filter. It should be noted that simulations were also conducted in which the synthetic galaxies were modelled as spatially resolved, with half-light radii drawn from the distribution measured forz=7 to 8 LBGs by Oesch et al. (2010b). However, these simulations were not adopted because they were found to provide results virtually identi-cal to the injection of PSFs and in the regime where the simulation results are most crucial for the LF determination (i.e.M1500≥ −19) several studies indicate that the UV-selected galaxy population is virtually unresolved at the resolution of WFC3/IR (i.e. Oesch et al. 2010b; Grazian et al. 2012; Ono et al. 2013).
The simulated galaxy population was then selected and processed through our photometric redshift analysis in an identical fashion to the real sample of high-redshift galaxy candidates. The resulting
p(z) distribution for each synthetic galaxy was then used to populate an outputm1500-zgrid. Under the assumption that the simulation provides a reasonable description of the actual high-redshift galaxy population, the ratio of the output and inputm1500-zgrids provides a mapping between the observed and intrinsic properties of the high-redshift galaxy population, which automatically accounts for selection efficiency, photometric redshift errors and flux boosting.
3 L U M I N O S I T Y F U N C T I O N E S T I M AT I O N
For each survey field, thep(z) distributions for each high-redshift galaxy candidate were used to populate anobservedm1500-zplane, which was then corrected using the results of the corresponding simulation to provide our best estimate of the distribution of the observed high-redshift population on theintrinsicm1500-zplane. After aperture correcting the object magnitudes to total, it is this information that is then used to estimate the galaxy LF using two different techniques.
The primary method is an implementation of the non-parametric SWML method of Efstathiou et al. (1988). It is the results of this method which provide our basic determination ofφ(M1500,z), with-out relying on the assumption that the LF obeys a particular func-tional form. However, in order to compare with previous results and to study the redshift evolution of the galaxy LF, it is also desirable to derive parametric fits to the galaxy LF. Therefore, in order to derive Schechter function fits to the galaxy LF, we have also imple-mented a version of the parametric maximum-likelihood technique of Sandage, Tammann & Yahil (1979, hereafter STY).
When defining the likelihood, both techniques rely on the as-sumption that, at a given redshift, the probability of observing a galaxy of a given luminosity can be defined as follows:
pi∝ Llimφ(Li) ∞ φ(L)dL
, (1)
whereLlim is the limiting luminosity of the survey. Ideally, this should be implemented in the situation where each galaxy has a unique spectroscopic redshift and luminosity. In the absence of this information, our implementation does the next best thing and adopts the normalized probability density function for each high-redshift
at University of St Andrews on August 13, 2014
http://mnras.oxfordjournals.org/
candidate, with the absolute UV magnitude (M1500), calculated us-ing a top-hat filter at 1500 Å in the rest frame of the best-fittus-ing SED template, re-calculated at each step within thep(z). The overall best fit is determined by maximizing the following likelihood:
L=
j
i
pi, (2)
where the outer product symbol indicates that the maximum likeli-hood is calculated overjseparate survey fields, each with its own limiting luminosity.
One of the key strengths of both techniques is that they take no account of the absolute number density of objects and should therefore be relatively insensitive to the effects of cosmic structure. However, as a result, it is necessary to determine the overall normal-ization of the resulting galaxy LF estimates independently. In each case, we have derived the LF normalization by requiring that the maximum-likelihood LF estimates reproduce the cumulative num-ber counts of observed galaxies within the appropriate redshift and absolute magnitude intervals.
4 T H E G A L A X Y L U M I N O S I T Y F U N C T I O N R E S U LT S
In Fig. 3, we show our new determinations of the UV-selected galaxy LFs atz=7 and 8. In each panel, the data points have been derived using the SWML technique, and include error estimates which have been derived via bootstrap re-sampling of the underlying high-redshift galaxy sample. In Table 2, we provide the individual, step by step, SWML determinations of thez=7 and 8 LFs and their corresponding uncertainties.
[image:8.595.317.540.102.228.2]In each panel of Fig. 3, the thick red line shows our best-fitting Schechter function as derived via our implementation of the STY
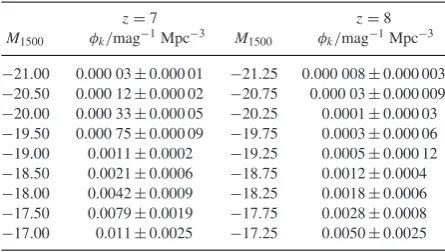
Table 2. The results of our SWML determination of thez=7 and 8 galaxy LFs. Columns 1 and 3 list the LF bins adopted atz=7 and 8, respectively (all bins are 0.5 mag wide). Columns 2 and 4 list the individual values ofφkand their corresponding uncertainties.
z=7 z=8
M1500 φk/mag−1Mpc−3 M1500 φk/mag−1Mpc−3
−21.00 0.000 03±0.000 01 −21.25 0.000 008±0.000 003 −20.50 0.000 12±0.000 02 −20.75 0.000 03±0.000 009 −20.00 0.000 33±0.000 05 −20.25 0.0001±0.000 03 −19.50 0.000 75±0.000 09 −19.75 0.0003±0.000 06 −19.00 0.0011±0.0002 −19.25 0.0005±0.000 12 −18.50 0.0021±0.0006 −18.75 0.0012±0.0004 −18.00 0.0042±0.0009 −18.25 0.0018±0.0006 −17.50 0.0079±0.0019 −17.75 0.0028±0.0008 −17.00 0.011±0.0025 −17.25 0.0050±0.0025
maximum-likelihood technique, which is constrained via a simul-taneous fit to all relevant survey fields (as listed in Table 1). The confidence intervals on the derived faint-end slope and character-istic magnitude from our STY fits atz =7 and 8 are shown in Fig. 4 and the best-fitting Schechter function parameters are listed in Table 3.
As can be seen from the results presented in Fig. 3, the addi-tional dynamic range in luminosity provided by combining the new UDF12 data set with the wider area GOODS-S, CANDELS-UDS and BoRG data sets has allowed an accurate determination of the
z=7 and 8 LFs spanning a factor≥50 in UV luminosity. In partic-ular, the new UDF12 data set has allowed us to constrain the form of the LF as faint asL≤0.1L∗for the first time. As can be seen from the results presented in Table 3, our new analysis has confirmed that the LF remains extremely steep atM1500≥ −18 at bothz=7 and 8, being consistent withα= −2.0 in both cases. Moreover, our new
Figure 3. The left-hand panel shows our new determination of the UV-selected galaxy LF at redshiftz=7. The data points have been derived using a combination of our photometric redshift analysis and an implementation of the SWML method of Efstathiou, Ellis & Peterson (1988); see the text for details. The thick solid red line shows the best-fitting Schechter function derived using the parametric STY maximum-likelihood technique applied simultaneously to the first seven survey fields listed in Table 1. For comparison, we also show a straightforwardχ2fit to the binned SWML data (thick black line). The right-hand plot shows the same information for our new determination of thez=8 LF. To derive thez=8 LF we have also incorporated the information derived from our own reduction and analysis of the BoRG data set.
at University of St Andrews on August 13, 2014
http://mnras.oxfordjournals.org/
[image:8.595.51.545.425.671.2]Figure 4. The confidence intervals for the faint-end slope (α) and char-acteristic absolute magnitude (M1500∗ ) derived from our STY maximum-likelihood fits to the galaxy LF atz= 7 (top) andz =8 (bottom). In each plot the 1σ and 2σ confidence intervals are illustrated by the dark and light-blue shaded areas, respectively. It should be noted that the con-fidence intervals plotted are based on likelihood ratios and correspond to
χ2=1 and 4 from the best overall fit (shown by the filled circle in each case). These specific confidence intervals have been chosen in order that the corresponding one parameter uncertainties can be calculated by projecting the contours on to the relevant axis.
analysis confirms and strengthens previous results which suggested that there is little evolution inM1500∗ betweenz=7 and 8. In the next section, we briefly compare our results with other relevant results in the literature, before proceeding to consider the evolution of the LF fromz6 to 10 and its implications for cosmic reionization.
Table 3. The Schechter function parameters for thez=7 and 8 galaxy LF derived by various recentHSTstudies. The first column lists the name of the study and columns 2 to 4 list the Schechter function parameters and their quoted uncertainties. The units ofφ∗are Mpc−3.
Study M1500∗ log (φ∗) α
z=7
This work −19.90+−00..2328 −2.96−+00..1823 −1.90+−00.15.14 Schenker et al. (2013) −20.14−+00..3648 −3.19−+00..2724 −1.87+−00..1817 Bouwens et al. (2011b) −20.14−+00..2626 −3.07−+00..2626 −2.01+−00..2121
z=8
This work −20.12+−0.370.48 −3.35+−0.280.47 −2.02+−0.220.23 Schenker et al. (2013) −20.44+−0.470.35 −3.50+−0.350.32 −1.94+−0.210.24 Bouwens et al. (2011b) −20.10+−00..5252 −3.23+−00.43.43 −1.91+−00.32.32 Oesch et al. (2012b) −20.04−+00..4448 −3.30−+00..3846 −2.06+−00..3528 Bradley et al. (2012) −20.26+−0.290.34 −3.37+−0.260.29 −1.98+−0.230.22
4.1 Comparison with previous results
Although an exhaustive comparison with previous high-redshift LF work in the literature is beyond the scope of this paper, it is instructive to compare the results derived here with those of other recent studies. Consequently, we will concentrate on a comparison between our new results and those of other recentHST studies which have attempted to fit all three Schechter function parameters and their corresponding uncertainties. The details of the Schechter function fits derived by the various different studies are provided in Table 3.
Given that it also includes the new UDF12 data, it is obviously of interest to compare our results to those of the companion dropout analysis of thez=7 and 8 LFs performed by our team (Schenker et al. 2013). It can be seen from Table 3 that atz=7 our results are in good agreement, with the extra luminosity leverage provided by UDF12 leading both studies to conclude that the faint-end slope isα= −1.9, with a small uncertainty. The overall uncertainties on the Schechter function parameters derived in this work are slightly tighter than in Schenker et al. (2013), which is expected given that we have analysed a larger survey area. Atz= 8 our results are again consistent with those published in Schenker et al. (2013), particularly in terms of the faint-end slope, although the value of
M∗
1500derived by Schenker et al. is somewhat brighter than found here.
Before the start of the UDF12 imaging campaign, the most com-prehensive study of thez=7 and 8 LFs was performed by Bouwens et al. (2011b), who combined a dropout analysis of the WFC3/IR imaging in the HUDF09 and ERS (total area 53 arcmin2) with con-straints provided by various wider area data sets. It can be seen from Table 3 that, in terms of derived LF parameters, there is actu-ally very good agreement between the new results derived here and those of Bouwens et al. (2011b). At some level this may be slightly fortuitous, given that the agreement between the Schechter function parameters is better than that between our respective binned SWML results and, as noted by Bouwens et al. (2011b), the small area of their study meant that theirz=8 faint-end slope could have been as shallow asα= −1.67±0.40 depending on the inclusion/exclusion of two bright candidates in HUDF09-2. However, irrespective of this, it is clear that the fundamental advantage of our new analysis is the ability to better constrain the faint-end slope at both redshifts, using the deeper UDF12 imaging.
at University of St Andrews on August 13, 2014
http://mnras.oxfordjournals.org/
[image:9.595.314.539.102.251.2]Much of the recent work in the literature has been focused on trying to improve our knowledge of the z = 8 LF. Within this context, two recent studies by Oesch et al. (2012b) and Bradley et al. (2012) have investigated the form of thez=8 LF by combining the faint-end results of Bouwens et al. (2011b), with improved constraints at the bright end. In the case of Bradley et al. (2012), the bright-end information is provided by their dropout analysis of the BoRG WFC3/IR parallel observations, whereas in Oesch et al. (2012b) the bright-end constraints are provided by a dropout
analysis of the CANDELS DEEP+WIDE imaging in GOODS-S
(total area 95 arcmin2). It can be seen from the results presented in Table 3 that, in terms of derived LF parameters, there is very good agreement between the new results derived here and those of Oesch et al. (2012b) and Bradley et al. (2012), with all studies seemingly converging on a steep faint-end slope ofα −2.0 and
M∗
1500 −20.1.
Overall, the comparison between derived LF parameters shown in Table 3 is therefore highly encouraging, especially given the different data sets, reductions and analysis techniques adopted by the various different studies. However, due to the fact that the cur-rent study (together with Schenker et al. 2013) exploits the deeper imaging provided by UDF12 and, uniquely, incorporates WFC3/IR imaging covering a wider area than all previous studies (includ-ing GOODS-S, CANDELS-UDS and BoRG) we are confident that the LF determination provided here is the most accurate currently available at these redshifts.
4.2 The evolution of the luminosity function
Several previous studies have concluded that the evolution of the galaxy LF over the redshift range 5< z <7 can be well described as pure luminosity evolution (e.g. Bouwens et al. 2007; McLure et al. 2009; Bouwens et al. 2011b). It is clearly of some interest to investigate whether or not the evolution of the LF fromz=7 to 8 remains consistent with this apparently simple picture.
Some insight into this question can be gained by examining the confidence intervals on the faint-end slope and characteristic mag-nitude atz=7 and 8 shown in Fig. 4. It can immediately be seen from Fig. 4 that our new analysis provides little evidence for a sig-nificant change inM1500∗ orαover the redshift intervalz=7 to 8 and in fact, the best-fitting Schechter function parameters (see Ta-ble 3) suggest that the dominant change is a factor of2.5 drop in
φ∗betweenz=7 and 8. We note here that Bouwens et al. (2011b) also commented that some of thez=7−8 evolution may be ex-plained by a change inφ∗, but concluded that the uncertainties were too large to be confident. Although our improved determinations of thez=7 and 8 LFs strengthen the suggestion thatφ∗is changing within the redshift range 7< z <8, the results presented in Fig. 5 indicate that the available data are still insufficient to rule out pure luminosity evolution.
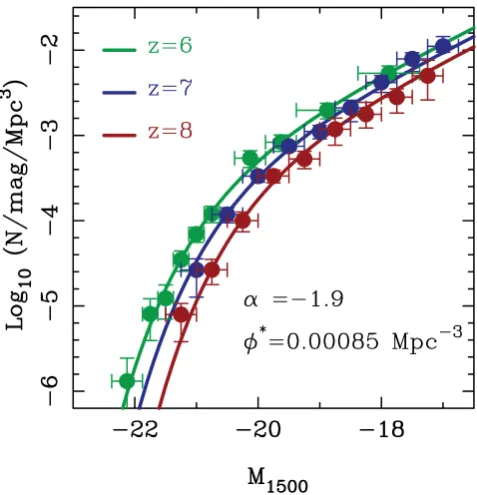
Given that pure luminosity evolution provides such a good de-scription of the LF evolution over the redshift interval 4< z < 7 (Bouwens et al. 2011b), in Fig. 5 we explore whether a simple luminosity evolution parametrization can continue to provide an ad-equate description of the observed evolution atz≥6. To investigate this issue we simply fit Schechter functions to the binned SWML LF data atz=6,7 and 8, allowingM1500∗ to float as a free parameter, but keepingφ∗andαfixed at representative values (α= −1.9 and
[image:10.595.310.549.55.303.2]φ∗=0.00085 Mpc−3, respectively). In this simplified scenario, we find thatM1500∗ evolves by0.3 mag perz=1 interval, chang-ing fromM1500∗ −20.3 atz= 6 toM1500∗ −19.7 atz=8. It is immediately clear from Fig. 5 that, within the constraints of the
Figure 5. An illustration that pure luminosity evolution can provide an acceptable fit to the observed evolution of the galaxy LF over the redshift interval 6< z <8. The blue and red data points show the SWML determi-nation of the galaxy LF atz=7 and 8 from this work, while the green data points show the determination of thez=6 LF from McLure et al. (2009). The corresponding curves show the results of fitting the binned LF data with Schechter functions where the faint-end slope and overall normaliza-tion have been held constant at representative values (α= −1.9 andφ∗= 0.00085 Mpc−3, respectively) but the characteristic magnitude (M∗
1500) has been allowed to float. In this scenario,M1500∗ evolves by0.3 mag perz= 1 interval, changing fromM1500∗ −20.3 atz=6 toM1500∗ −19.7 atz= 8. It can be seen that this simple parametrization is capable of satisfactorily reproducing the observed data.
current data, it is still perfectly possible to reproduce the observed LF data in the redshift interval 6< z <8 with pure luminosity evolution alone.
4.3 The galaxy luminosity function atz=9
In addition to the quadrupling of the availableY105imaging in the HUDF, the key advantage provided by the new UDF12 data set is the addition of ultra-deep imaging in the previously unexploited
J140filter. The availability of the newJ140imaging provides the first real opportunity to constrain the faint end of thez9 LF, simply because, in the redshift interval 8.5< z <9.5, theJ140 andH160 imaging still provide two filters longward of the redshifted Lyman break. Although there is significant overlap (2/3) between theJ140 andH160filters, the availability of two images with different noise properties is invaluable for ruling out spurious sources and avoid-ing the notorious problems associated with savoid-ingle-band detections longward of the Lyman break.
In Fig. 6, we show our SWML determination of thez=9 galaxy LF, which is derived entirely from the data available in the HUDF itself. For comparison, we also show in Fig. 6 our SWML determi-nation of thez=8 LF, which is identical to that shown in Fig. 3. Although it is clearly not sensible to draw strong conclusions from two low signal-to-noise ratio LF bins, thez=9 data points shown in Fig. 6 (and listed in Table 4) immediately suggest that there is no dramatic fall in the volume density ofM1500 −18 galaxies
at University of St Andrews on August 13, 2014
http://mnras.oxfordjournals.org/
Figure 6. The large purple data points show our SWML estimate of thez 9 LF derived from the UDF12 data set. For context, in grey we also show our estimate of thez=8 LF. The solid and dashed lines show fits to the
z=9 data points under the assumption that the LF evolves fromz=8 to 9 via pure luminosity (solid) or pure density (dashed) evolution, respectively (both assume the faint-end slope remains fixed at thez=8 value). Although it is currently impossible to differentiate between them, it is clear that both scenarios would lead to very similar integrated UV luminosity densities (see the text for a discussion).
Table 4. The results of our SWML determination of two luminosity bins on thez=9 galaxy LF. Column 1 lists the adopted LF bins (both are 0.5 mag wide) and column 2 lists the individual values ofφkand their corresponding
uncertainties.
M1500 φk/mag−1Mpc−3
−18.00 0.0016±0.0007 −17.50 0.0021±0.0009
betweenz=8 and 9. The solid and dashed lines in Fig. 6 show the result of Schechter function fits to the two z= 9 data points under the assumption that the evolution fromz=8 to 9 is either purely luminosity evolution (solid line) or purely density evolution (dashed line). In both cases, it is assumed that the LF faint-end slope remains unchanged atα= −2.02.
It can clearly be seen from Fig. 6 that it is impossible to say anything meaningful about theformof any evolution of the galaxy LF betweenz=8 and 9. However, the two alternative Schechter function fits do demonstrate that, provided the faint-end slope does not change substantially betweenz=8 and 9, irrespective of the form of the evolution the resulting integrated UV luminosity density is likely to be very similar.
5 E VO LV I N G L U M I N O S I T Y D E N S I T Y A N D C O S M I C S TA R F O R M AT I O N H I S T O RY
Given our improved knowledge of the evolving galaxy LF, it is clearly of interest to briefly explore the implications for the evolution of the observed UV luminosity density, which has a direct impact on determining whether the observed high-redshift galaxy population can reionize the Universe. For a thorough review of the constraints which could be placed on reionization pre-UDF12, the reader is referred to Robertson et al. (2010) and Finkelstein et al. (2012).
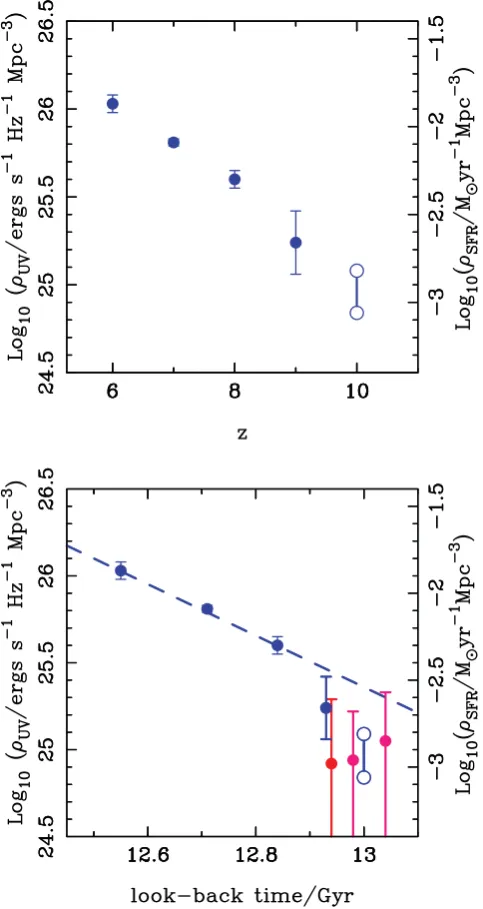
In Fig. 7, we provide a new calculation of the evolution of the observed UV luminosity density based on the McLure et al. (2009) determination of the z = 6 LF and the new LF determinations derived in this work atz=7–9. In all cases, the data points show the results of integrating the appropriate LF down to an absolute magnitude ofM1500 = −17.7, in order to allow straightforward comparison with previous work. In both panels, the right-hand axis shows how the UV luminosity density converts into a star formation rate (SFR) density under the assumption of a Salpeter initial mass function (IMF) and the conversion between UV luminosity and SFR prescribed by Madau et al. (1998). In the top panel, we show the evolution in UV luminosity density as a function of redshift, whereas in the bottom panel, we show the evolution as a function of look-back time. The upper and lower data points atz=10 show how the UV luminosity density changes if the LF evolution from
z=8 to 9 continues toz= 10 as either pure luminosity (lower) or pure density evolution (upper), respectively. No dust corrections have been applied to any of the data points.
It can be seen from Fig. 7 that our data indicate that there is an order of magnitude increase in the observed UV luminosity density over the 450 Myr period betweenz=10 and 6. Moreover, from the bottom panel of Fig. 7 it can be seen that the increase in UV density is very close to linear with cosmic time betweenz=8 and 6. However, our new information atz9 from the UDF12 data set provides some evidence that the fall-off in UV density atz≥8 is steeper than a linear trend with cosmic time, particularly if the galaxy LF continues to evolve primary via luminosity evolution. We note that in this regard our results are consistent with Oesch et al. (2012a) and the recent results from the Cluster Lensing and Supernova survey with Hubble (CLASH) campaign published by Coe et al. (2013) and Bouwens et al. (2013), which are plotted in the bottom panel of Fig. 7. A full discussion of the implications of these results within the context of cosmic reionization can be found in Robertson et al. (2013).
6 C O N C L U S I O N S
By combining the extreme near-IR depth provided by the UDF12 campaign with extensive wider area WFC3/IR imaging data, it has been possible to study the high-redshift galaxy LF using galaxy samples selected from a total area of480 arcmin2, which span a factor of≥50 in luminosity and a factor of1000 in number density. Based on this unique data set it has been possible to determine the most accurate measurement to date of thez=7 and 8 galaxy LFs and the first meaningful constraints on the galaxy LF atz9. The principal results and conclusions of our study can be summarized as follows.
(i) The extra depth provided by the UDF12 data set has allowed us to demonstrate that the faint-end slope of the galaxy LF atz=7 and 8 remains extremely steep, down toM1500= −16.75 and−17.00, respectively. Based on fitting Schechter functions, our formal
at University of St Andrews on August 13, 2014
http://mnras.oxfordjournals.org/
[image:11.595.105.224.508.552.2]Figure 7. The evolution of the observed UV luminosity density as a function of redshift (top) and look-back time (bottom). The data points at 6< z < 9 show the results of integrating the galaxy LF to an absolute magnitude limit ofM1500= −17.7, where the LF parameters are taken from McLure et al. (2009) atz=6 and from this work forz=7−9. The upper and lower data points atz=10 are derived by assuming that the evolution of the LF fromz=8 to 9 continues as either pure luminosity (lower) or pure density (upper) evolution, respectively. The dashed line shown in the bottom panel is a linear fit to the evolution of the UV luminosity density between
z=6 and 8. In the bottom panel, the two pink data points are the recent UV luminosity estimates from Coe et al. (2013), while the red data point is the estimate from Bouwens et al. (2013). In each panel, the right-hand axis shows how UV luminosity density converts to star formation density assuming a Salpeter IMF and the UV-to-SFR conversion of Madau, Pozzetti & Dickinson (1998).
constraints on the faint-end slope are α= −1.90−0+0..1415 at z = 7 and−2.02+0.22
−0.23atz=8.
(ii) The results of our Schechter function fits strengthen previous suggestions that the form of the evolution of the LF betweenz=
7 and 8 is more akin to density evolution, rather than the apparent luminosity evolution observed at redshiftsz=5−7.
(iii) However, even with the extra leverage provided by the UDF12 data set, we conclude that it is not possible to differen-tiate between luminosity and density evolution betweenz=7 and 8. In fact, we demonstrate that it is perfectly possible to provide an adequate description of the observed LF data betweenz=6 and 8 under the assumption of pure luminosity evolution alone.
(iv) The unique nature of the UDF12 data set has allowed us to place the first meaningful constraints on the faint end of the galaxy LF atz=9. Taken at face value, these initial results suggest that, at least atM1500 −18, there is not a dramatic fall-off in the volume density of faint galaxies betweenz=8 and 9.
(v) Based on our determinations of the galaxy LF within the redshift interval 6< z <9, we briefly explore the evolution of the observed UV luminosity density. Our results indicate that there is an order of magnitude increase in the UV luminosity density over the redshift range 6< z <10 and that betweenz=8 and 6 the UV luminosity density increases linearly with cosmic time. However, our new results at z 9, together with recent results from the literature, suggest that the fall-off in UV luminosity density atz≥ 8 is steeper than would be expected for a linear trend with cosmic time.
AC K N OW L E D G E M E N T S
RJM acknowledges the support of the European Research Coun-cil via the award of a Consolidator Grant, and the support of the Leverhulme Trust via the award of a Philip Leverhulme research prize. JSD, RAAB, TAT and VW acknowledge the support of the European Research Council via the award of an Advanced Grant to JSD. JSD also acknowledges the support of the Royal Society via a Wolfson Research Merit award. ABR and EFCL acknowledge the support of the UK Science & Technology Facilities Council. The US authors acknowledge financial support from the Space Tele-scope Science Institute under award HST-GO-12498.01-A. SRF is partially supported by the David and Lucile Packard Foundation. SC acknowledges the support of the European Commission through the Marie Curie Initial Training Network ELIXIR. This work is based in part on observations made with the NASA/ESAHubble Space Telescope, which is operated by the Association of Universities for Research in Astronomy, Inc, under NASA contract NAS5-26555. This work is also based in part on observations made with theSpitzer
Space Telescope, which is operated by the Jet Propulsion Labora-tory, California Institute of Technology under NASA contract 1407.
R E F E R E N C E S
Beckwith S. V. W. et al., 2006, AJ, 132, 1729 Bertin E., Arnouts S., 1996, A&AS, 117, 393
Bouwens R. J., Illingworth G. D., Franx M., Ford H., 2007, ApJ, 662, 72 Bouwens R. J. et al., 2010, ApJ, 709, L133
Bouwens R. J. et al., 2011a, Nat, 469, 504 Bouwens R. J. et al., 2011b, ApJ, 737, 90 Bouwens R. J. et al., 2012, ApJ, 752, L5
Bouwens R. J. et al., 2013, ApJ, preprint (arXiv:1211.2230) Bowler R. A. A. et al., 2012, MNRAS, 426, 2772 Bradley L. D. et al., 2012, ApJ, 760, 108 Bruzual G., Charlot S., 2003, MNRAS, 344, 1000 Bunker A. J. et al., 2010, MNRAS, 409, 855
Bunker A. J., Caruana J., Wilkins S. M., Stanway E. R., Lorenzoni S., Lacy M., Jarvis M., Hickey S., 2013, MNRAS, 430, 3314
at University of St Andrews on August 13, 2014
http://mnras.oxfordjournals.org/