ISSN: 1816-949X
© Medwell Journals, 2020
Pattern Classification Technique to Assess Land Use/Cover
Changes in Granite Quarry Area of Dharmapuri and
Krishnagiri Districts of Tamil Nadu
P. Nithya and G. Arulselvi
Department of Computer Science and Engineering, Annamalai University,
608002 Annamalai Nagar, India
Abstract: The rapid phase of urbanization and infrastructure development in Krishnagiri distirct has been observed recently. The unique characteristics of the granite deposits in Krishnagiri and Dharmapuri districts of Tamil Nadu resulted in making the country a global producer of the granite rocks. This led to intensified quarrying activities between Dharmapuri and Krishnagiri. However, this surface mining method has a potential to impact the environment in a negative way causing loss in vegetation, depletion of natural resources increases the temperature, loss of scenic beauty and contamination of surface water resources. To assess the land cover changes caused by granite quarrying activities, remotely sensed data in the form of Landsat images between 2000 and 2017 were used. Pattern classification was used to create maps. Accuracy assessment using Google EarthTM as a reference data yielded an overall accuracy of 88%. The post classification change detection method was used to value the land cover changes within the granite quarries. Granite quarries increased by 2562.78 ha while formation of quarry lakes increased to 5.3 ha over the 18 year period. Vegetation cover decreased by 1521 ha in area while 18.3 ha bare land was lost during the same period. This study demonstrated the utility of remote sensing to detect changes in land cover within granite quarries.
Key words:Land Use Land Cover (LULC), Geographic Information System (GIS), Remote Sensing (RS), images classification, Phuentsholing, changes, contamination
INTRODUCTION
Mining as experienced in Krishnagiri and Dharmapuri: Mining activities started in Dharmapuri and Krishnagiri districts in the period 1980-1990. The quarries were initially using manpower and producing one or two truckloads to meet the needs of the locality. But very soon, quarry owners entered the rich rock-strewn area of Burgur Taluk of Krishnagiri distirct. Until then the quarries functioned as a resource to meet the needs of its own people. The aim of the quarry business was overexploitation of resources to cater to the increased construction activities of the land real estates (Saroglu et al., 2011).
Quarries in Burgur Taluk were initially mined using manpower and modern machinery. The smaller players using human skills were soon out of business because they were not able to compete with the bigger players using modern machinery and soon had to bring an end to their business activity.
In some cases the bigger quarry business owners who were using the latest technologies to exploit at a faster rate. They had the clout to ensure that the revenue land they needed for extracting rocks was converted to commercial property and make sure that permits were given to conduct their illegal, unscrupulous business activity (Anderson et al., 1977; Bonifazi et al., 2003).
It was the continuation of such a past that until recently paddy cultivation was still practiced in Dharmapuri and Krishnagiri districts. But this continuity was broken a few years back because of the unprecedented severe water scarcity experienced by the farmers in the above districts. To be precise, the farmlands were destroyed after the unlimited drilling and exploding of the rock formations. There is an inseparable relationship between the climate of a region and the possibility of life surviving in its environment. When this is gradually lost, a peaceful living place will become uninhabitable and its distinctive past and historical experiences will be inevitably lost.
The rock formations are responsible for micro-level climate changes in their immediate surroundings. This cannot be understood when a whole region is taken into consideration, due to the influence of other varying factors. Therefore, it has to depend on certain cross-sections of records in order to understand the influence the quarries have over a larger region and the influence mining exerts on climate (Nikolakopoulos et al., 2010). Residents of Burgur Taluk where most of the granite and other quarries in Dharmapuri and Krishnagiri exist, experience the sweeping changes that have occurred after mining’s inception.
Paddy cultivation was eventually brought to an end as the regular pattern of rain stopped and there was not
sufficient water supply to plant and harvest crops. The local farmers and environmental activists bear witness to the end of the nanja paddy cultivation which was dependent on the copious rains of November. The rain had dwindled considerably and the water flow in the streams completely disappeared.
When the rains became erratic, favourable conditions were gradually lost, the irregular climate patterns began to cast a negative influence and eventually mango and rose cultivation collapsed as well.
Burgur region had a temperate climate, a mixture of cold and mild heat. the reason for the change in the temperate climate is the dust cover formed in the atmosphere, created by the thick smoke that is mixed with rock-powder dust. This is due to the explosions in the granite and other quarries and the dust from the crusher M-sand units which prevent the penetration of sunrays and the evaporation process (Liu et al., 2005; Nitze et al., 2017; Gorelick et al., 2017).
Objectives of the study: The present study is mainly aimed at evaluating the impact of granite mining on the surrounding environment within 50 km radius of mines using remote sensing techniques. In view of publications on mining related environmental impacts, this study will form the baseline work for future comparison and assessment of environmental impacts in the study area of Krishnagiri and Dharmapuri district. The objectives of the study are:
C To map granite quarries in the Krishnagiri and Dharmapuri district
C To analyse time sequential changes of vegetation, depletion of natural resources, loss of scenic beauty and contamination of surface water resources due to mining
C To examine the impact of granite mining on land surface temperature
Study area
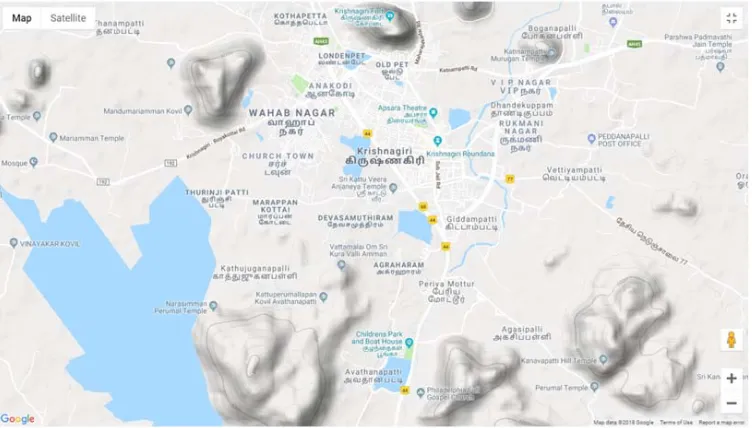
Krishnagiri district: Krishnagiri district covers an area of 5143 km2. Krishnagiri district is bound by Vellore and Thiruvannamalai districts to the East, state of Karnataka to the West, the State of Andhra Pradesh to the North and Dharmapuri district to the South. This district is elevated from 300-1400 m above the mean sea level. The important crops of Krishnagiri district are paddy, maize, ragi, banana, sugarcane, cotton, tamarind, coconut, mango, groundnut, vegetables and flowers. The district has an excellent scope for agri-business (Kaliraj et al., 2017; Kantakumar and Neelamsetti, 2015; Mahmon et al., 2015). It is located between 11°12’N and 12°49’N latitude, 77°27’E to 78°38’E longitude. The revenue block of Krishnagiri is Bargur, Hosur, Kaveripattinam, Kelamangalam, Krishnagiri, Mathur, Shoolagiri, Thally, Uthangarai and Veppanapalli. Hosur, one of the most
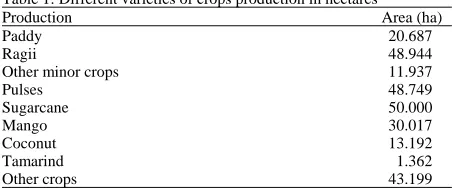
Table 1: Different varieties of crops production in hectares
Production Area (ha)
Paddy 20.687
Ragii 48.944
Other minor crops 11.937
Pulses 48.749
Sugarcane 50.000
Mango 30.017
Coconut 13.192
Tamarind 1.362
[image:2.612.314.540.101.197.2]Other crops 43.199
Table 2: Classification of irrigated, double, multiple cropped, cultivable wasteland, water land and forest
Classification Geo. Extent (ha) (%)
Forest 202409 39
Banner and uncultivable waste 24194 5
Land put to non-agricultural uses 21466 4
Cultivable waste 6341 1
Permanent pastures and other grassing lands 7378 1
industrialized places in the state is located in this district. Net cultivated, irrigated, double, multiple cropped, cultivable wasteland, water land and forest (Table 1 and 2) (Fig. 1).
Mining based activities: In Krishnagiri district, quarry leases are being granted for granite in Patta lands. Rough stone and Earth quarry leases are being granted in government and patta lands under Tamil Nadu minor mineral concession rules 1959. The Public Works Department (WRO wing) is operating sand quarry in riverbeds of the study area (Rawat and Kumar, 2015; Rwanga and Ndambuki, 2017; Lekha and Kumar, 2015; Lv et al., 2015).
A state owned corporation called Tamil Nadu metals and mineral Ltd. is also earning quarry and mining grants in government lands. It is ascertained that nearly 27,000 workers are being engaged in quarry activities.
Dharmapuri district: Krishnagiri district covers an area of 5143 km2. Krishnagiri district is bound by Vellore and Thiruvannamalai districts to the east, state of Karnataka to the West, the State of Andhra Pradesh to the North and Dharmapuri district to the South. This district is elevated from 300-1400 m above the mean sea level. It is located between latitudes N 11 47’ and 12 33’ and longitudes E 77 02’ and 78 40’. The total geographical area of Dharmapuri district is 4497.77 km2, i.e., 3.46% of Tamil Nadu (Kamarudin et al., 2017; Kaliraj et al., 2017; Toriman et al., 2015; Kamaruddin et al., 2015a, b) (Fig. 2).
Fig. 1: Geographical map of Krishnagiri
Fig. 2: Revenue map of Dharmapuri and Krishnagri districts
Literature review: Karl and Axel note that using Global Position System (GPS) to obtain vegetation data, may be spatially more precise or accurate than those acquired through satellite imageries which has their accuracy or precision limited to the resolution of the pixel (Kamarudin et al., 2015a, b). Although, there is a possibility of image pixels being compromised when vegetation types are mixed, there would still be problems with the accuracy, since, DN values for each pixel would remain single.
Campbell and Wynne discussed about the accuracy of remotely sensed images are of great concern to prospective users of LULCC maps. Information about the degree of accuracy of the data presented in a LULCC map is needed to ascertain its authenticity. Accuracy of an
image can be defined as the measure of agreement between a standard, acknowledged to be correct and an image of unknown quality. On the other hand, precision of an image is defined as the degree of sharpness or certainty of pixels in an image (Bhuiyan et al., 2016).
[image:3.612.99.512.346.524.2]Problem statement: Dharmapuri and Krishnagiri districts is endowed with vast rock formations and stone hills, making it an ideal hub for granite quarrying operations. In view of its geology, there has been an emergence of several quarrying companies and activities within the two districts and surrounding communities in recent years. Raw materials from granite quarrying sites are patronized by customers within these region and beyond for various construction activities.
Furthermore, the Dharmapuri and Krishnagiri districts is rapidly urbanizing and its accelerated sprawl is gradually leading towards conversion of forest lands into larger artificial environment. The migration of many settlers from the conventional central business district within the region to our area and its surrounding communities has put enormous pressure on land space coupled with rise in population. The upsurge in demand for land space for constructing residential or commercial facilities has made land acquisition, sole prerogative of the highest bidder. In many cases, land close to granite sites are a seriously encroached upon by desperate land seekers at the expense of environmental protection. Likewise, some of the granite companies also operate in areas close to existing human settlements posing serious environmental and health risk to the exposed communities.
The presence and activities of these granite companies gravely impact on the land cover and livelihood of residents in the various communities. One of the most obvious environmental impact in the study area is noise, generated largely from cutting the rock activities. Cutting noise impact is usually dependent on the source, topography, land use, land cover of the immediate site and climate conditions. The incessant cutting activities and exposure of residents to these noises poses serious noise related health risk. In view of these dynamics, this research study attempts to explore and demonstrate the application of remote sensing technique as a useful tool to detect LULC and evaluate noise level impact from granite quarrying operations and other activities within the catchment area using Dharmapuri and Krishnagiri district and its environs as a case study.
Data used and methodology
Sampling and data acquisition: Quarries were sampled based on their spatial coverage and the distance between them, normally the distance between the two sampling location is 1 km. Quarries with spatial coverage of more than 2.5 acres were considered for the study. This was to allow for affective comparison with remotely sensed data. A total of thirty quarries were sampled around the study area. A minimum distance of 1 km between granite quarries was specified when sampling in order to avoid an overlap of samples that may compromise independence of each sample. Granite quarries were located using
Geographical Positioning System (GPS) coordinates acquired from the minerals data base of Council for Geoscience and by using Google EarthT M (https://serc.carleton.edu/). After acquiring coordinates, Google EarthTM was used to verify the locations as well as to digitize granite quarry boundaries. Google Earth™ offers Digital Globe images at spatial resolution of 0.5 m and has been used as a source of reference data in remote sensing analysis (Lv et al., 2015). LANDSAT images were acquired from the United State Geological Survey (http://earthexplorer.usgs.gov/) given in the following table. Attempts were made to use images acquired during the wettest months (in Tamilnadu) between February and June when vegetation is denser, however, the unavailability of suitable images necessitated the use of images outside of this time window. However, both March and April are generally, known as high vegetation months in the summer rainfall regions of Krishnagiri and Dharmapuri.
MATERIALS AND METHODS
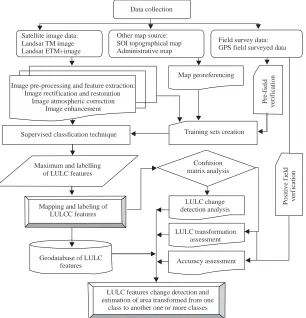
Landuse and land cover feature extraction: The present study is carried out for assessment of the decadal changes and transformations in LULC features in the Dharmapuri and Krishnagiri distrcits of Tamilnadu using remote sensing and GIS technology. The Landsat ETM+images (30 m) covering the study area are obtained from the Global Land Cover Facility (GLCF) (http://glcfapp.glcf.umd.edu:8080/esdi/) and Earth Explorer (http://Earthexplorer.usgs.gov/) online portal for the year 2000 and 2017. Figure 3 shows the functional flow of methodology used for LULC change analysis (Fig. 4). The study area covers a single scene of land.
Data collection
Satellite image data: Landsat TM image Landsat ETM+image
Other map source: SOI topographical map Administrative map
Maximum and labelling of LULC features
Mapping and labeling of LULCC features
Geodatabase of LULC features
Map georeferencing
Training sets creation
Confusion matrix analysis
LULC change detection analysis
LULC transformation assessment
Accuracy assessment
LULC features change detection and estimation of area transformed from one
class to another one or more classes Image pre-processing and feature extraction:
Image rectif ication and restoration Image atmospheric correction
Image enhancement ication and restoration
Supervised classfication technique
Pr
e
-f
i
el
d
v
e
rif
ica
tio
n
ie
ld
ic
atio
n
Field survey data: GPS field surveyed data
Po
si
ti
v
e f
i
e
ld
ver
f i
cat
io
n
ica
tio
n
ie
[image:5.612.114.477.89.359.2]ld
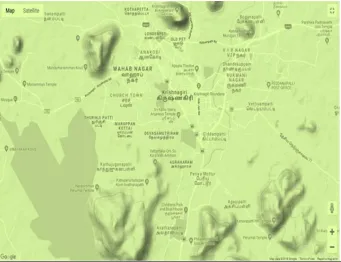
Fig. 3: LULC map of Krishnagriri in the year 2000
Fig. 4: Functional flow of methodology used for LULC change detection and transformation analysis
Dry well Forest area jungle Deep water bodies Low populated area Plantation area Cropiand Evergreen forest Legend
LULC_map Class_name
Hilly area with thick vegetation Denseiy populated areas Settlements office sector Open scrub
Agriculture land km
10 5 0 10
1
0
”0
”0
”N
’
12
”2
2’
30
’N
72”500’E 74”55’30’E
Land-use/land-cover map
W N
S E
77”500’E 74”55’ 30’E
1
3
”0
’0
’N
12
”2
2’
50
[image:5.612.141.447.390.708.2]band 4 are classified for cultivable lands, forest, scrub and other natural vegetative cover. In this analysis, the Landsat ETM+and TM images with the first five bands such as band 1(0.45-0.52 l m), band 2(0.52-0.60 l m) band 3 (0.63-0.69 l m), band 4(0.76-0.90 l m) and band 5 (1.55-1.75 l m) are combined into multispectral image for extraction of landuse and land cover feature for the periods of 2000 and 2017. The combined multispectral images of the year 2000 and 2017 are geometrically corrected using UTM-WGS84 projection and coordinate system with the help of GCPs (Ground Control Points) collected from Survey of India (SOI) (http://www.surveyofindia.gov.in/) published topographical maps (scale 1:25000) and Garmin Etrex-10 handheld GPS field surveyed data.
Furthermore, the images are atmospherically corrected to obtain the perfect spectral reflectance values using FLASSH (Fast Line-of-sight Atmospheric Analysis of Spectral Hypercubes) Model in ENVI 4.5 Software. Recently several image classification techniques and algorithms have been developed extensively for the Landuse and Land Cover( LULC) analysis throughout the world (Kamarudin et al., 2015a, b; Bhuiyan et al., 2016; Wahab et al., 2016). However, each technique is having developed and reviewed for their advantages and disadvantages based on their algorithm, iteration and processing software. For example, the algorithm based pattern classification methods like Support Vector Machine (SVM), Artificial Neural Network (ANN), Maximum Likelihood Classifier (MLC), fuzzy analysis, segmentation and clustering, etc. Among them, the MLC technique depends on a combination of ground samples and personal experience with the study area and is strictly used the field observed training samples of real ground surface (Kantakumar and Neelamsetti, 2015; Mahmon et al., 2015; Rawat and Kumar, 2015). The algorithm based classifiers like SVM, ANN, fuzzy analysis and segmentation are critically analysis multispectral images at sub-pixel level but the result comprises complexity and bias while classifying medium resolution images acquired, especially, in the hills area. Moreover, they have stated that the SVM and ANN classifier algorithms produces misclassified or overlapped features while using minimum training samples at 4th order polynomial function. Subsequently, the accuracy assessment statistics of Kappa coefficient for these algorithms are estimated in the descending order like SVM (0.765) and ANN (0.645). Though, number of advanced techniques available for LULC change analysis, the MLC classifier is used per-pixel signature files of training samples collected from the real ground using GPS based spectrometer survey and used as knowledge engine for clustering the maximum likelihood Digital Numbers (DN) of pixels in the image. Based on the view of above concepts, the MLC classification technique is selected for
analysis of medium resolution image to extract the LULC feature extraction in the study area. Moreover, the primary objective of this study is to estimate the decadal changes and their transformations of LULC features under the USGS-LULC level II classification system from the landsat ETM+and TM image for the periods of 2000 and 2017 using MLC classifier algorithm. However, many researchers have used MLC classifier of supervised classification technique for LULC feature extraction from the Landsat TM and ETM+image and achieved relatively high accurate results up to 90% (Rwanga and Ndambuki, 2017). For example, other researchers have employed the MLC classifier to analysis ETM+images and achieved highly satisfactory results in land use/land cover change studies.
In this analysis, the MLC algorithm is executed on Landsat ETM+ and TM images acquired on 2000 and 2017 for extracting the LULC features using ERDAS Imagine 2014 Software. The MLC algorithm is used the spectral signature components of the 80 training samples (10 samples from each feature class) collected from the GPS based spectrometer (HandHeld 2 hand-held spectroradiometer, ASD Inc.) survey on the real ground surface. Using the surveyed data, the training sets are prepared from the clustered pixels on the images at pixel ratio of 1:10. Before starting classification, it is significantly executed the feature space technique on training sets for correcting the misclassified or overlapped pixels and it is recoded subject to the corresponding feature class (Lekha and Kumar, 2015; Lv et al., 2015) (Fig. 5).
Fig. 5: Before classfication of study area
vector in the representative pixels and the mean vector in each signature for classifying the multiple classes based on the Euclidean distance. The clustered image consists of different feature classes is introduced to nearby neighbour resembling (kernel window size 33) analysis for replacing the disintegrated pixels to the most common pixel of feature class. The result of classified images is categorized into twelve feature classes based on the USGS-LULC classification system at level II category. The level II system is probably comprises major LULC features for compilation and mapping at regional scale. Therefore, among the four level (Level I-IV) category of this system, the level II classification system framework is considered more suitable for categorizing the LULC features from the classified image. In this level II system, the clear definition of LULC features helps to differentiate the many classes belongs to common LULC family and is intentionally provides attributes of the LULC features. For example, based on distinct LULC feature definition, the agriculture land (Level I) is classified to cropland and plantation area in the study area using level II system. The result of LULC map (1:10000) is cross verified with the state level land use and land cover map (scale 1:50000) for 2011-2012 published by Bhuvan (Indian Geoportal website) and the result shows the spatial distribution of LULC features are relatively same as the referenced map, however, statistical measurement of both maps are not cross-verified in this case. Finally, the LULC layers for the 2 years 2000 and 2017 are separately prepared for geo-database with the attributes include class name,
location, areal extent and perimeter using ArcGIS 10.2 Software. Furthermore, these classified images are involved for accuracy assessment using post field verification technique (Fig. 6).
Land use and land cover change detection analysis:
Change detection assessment of LULC features provides information sources for monitoring the trend of changes of an area over time. In this study, the change detection analysis is performed on the classified images for the year 2000 and 2017 in the Dharmapuri and Krishnagiri district of Tamilnadu. Based on the review of many researchers, the post-classification comparison method is adopted for change detection analysis because of this strictly performs pixel-to-pixel comparison of classified images of the study area acquired on two different times.
Fig. 6: After classfication of study area
differences by subtracting pixel (in rows (fr)) of the classified image in 2000 from the pixel (in column (fc)) of classified image in 2017. The change detection statistics used to compile a matrix tabulation is expressed as (final state (fr)-initial state (fc)/initial state (fc)). This statistics produce the pixel variations in a particular class corresponding to both images indicate the changes in the state of an object and phenomena over time. In addition to that the magnitude of change (K) is calculated for estimating the degree of expansion or reduction of area (in percentile) in a particular feature class and the equation is expressed as K = (f i/i) 100. Where, the K refers magnitude of change (percentile) f is classified image of initial time and i reference data (classified image of recent time). In which the outcome of negative value refers loss of area of LULC feature, while the positive value indicates gain of area of LULC feature. The vectorized layers of LULC features are intersected to determine the rate of change of a particular LULC feature to one or another more states. It is performed by assigning the values of differences in cross-tabulation assigned feature classes in rows and columns to calculate change rate over time. Hence, the results of LULC change and transformation are used as primary information source for understanding the trends in landuse and land cover changes along the granite region of Dharmapuri and Krishnagiri district.
RESULTS AND DISCUSSION
The Dharmapuri and Krishnagiri district in Tamil Nadu, India is reported to be facing serious environmental
challenges in the form of loss of landforms, decreasing of vegetation, temperature raise due to rapid changes in land use and land cover induced by climatic changes, population growth and other human encroachment activities. Assessment of LULC changes and transformation in the study area is extracted from the landsat ETM+images (30 m) for the period of 2000 and 2017 using the Maximum Likelihood Classifier (MLC) algorithm of supervised image classification technique in ERDAS Imagine Software. Thus, the result describes the different LULC feature classes based on the level-II category of USGS-LULC classification table with overall classification accuracies of 87.36 and 81.45% and overall Kappa coeffient statistical values of 0.87 and 0.82, respectively. The information of LULC changes and transformation is an essential source for quarry vulnerability assessment and quarry resources management in the granite area.
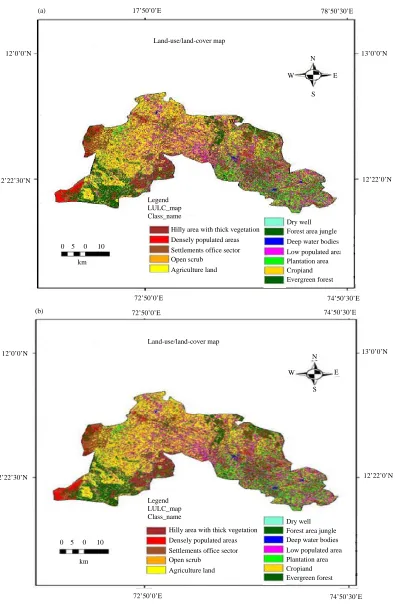
Assessment of landuse and land cover change between 2000 and 2017: Figure 3 shows the spatial distribution of the major landuse and land cover classes in the study area for the year 2000 and 2017. The area extent of these LULC features in square kilometer and area coverage in percent for the two different periods and its corresponding values of graphical representation is shown in Fig. 7a and b.
Fig. 7: (a) LULC map of Krishnagiri in the year 2000 and (b) LULC map of Krishnagiri in the year 2017
Hilly area with thick vegetation
Densely populated areas Settlements office sector Open scrub
Agriculture land Legend
LULC_map Class_name
13’0’0’N 12’0’0’N
12’22’30’N 12’22’0’N
72’50’0’E 74’50’30’E
17’50’0’E 78’50’30’E
Land-use/land-cover map
Dry well Forest area jungle Deep water bodies
Low populated area Plantation area Cropiand Evergreen forest
E N
S
W
Dry well Forest area jungle Deep water bodies Low populated area Plantation area Cropiand Evergreen forest Hilly area with thick vegetation
Densely populated areas
Settlements office sector Open scrub
Agriculture land Legend
LULC_map Class_name
Land-use/land-cover map
72’50’0’E 74’50’30’E
12’22’0’N 13’0’0’N
12’22’30’N 12’0’0’N
(b) (a)
0 5 0 10
km
W
N
E
S W
0 5 0 10
km
[image:9.612.87.482.96.702.2](or) built-ups, river, freshwater bodies are experienced significant changes during past decade in the various parts of the granite area.
Cultivable land: It is primarily used for cultivating paddy, banana, flower, sugarcane and vegetables to sustain human life. The area extent of this landuse shows a significant decreasing trend from 103.54 km2 (34.72%) to 96.87 km2 (33.17%) during 2000-2017 (Figs. 4 and 5). During these periods, there is a reduction of area of 4.50 km2 in cultivable land due to land degradation, urbanization, encroachment for settlement and real estate activities. Due to land degradation and soil infertility, the cultivable lands are vastly converted into fallow and become barren land in the granite region.
In the Dharmapuri district, villages like Jettihalli. Adagapadi, Adiyamankottai, Akkamanahalli, Andihalli, Annasagaram, Balajangamanhalli, Barigam, Boalanahalli, Budanahalli, Dhalavaihalli, Dhinnahalli, Dokkubodanahalli, Echanahalli,Elagiri, Errabaiyanahalli, Hale Dharmapuri, K Thoppur, Kadagathur, Kammampatti, Konangihalli, Konanginaickanahalli, Kondagarahalli, Kondampatti, Krishnapuram, Kukkalmalai, Kumbalapadi, Kuppur, Lakkiampatti, Laligam, Mademangalam, Maniathahalli, Mittareddihalli, Mookanur, Mookkanahalli, Mukkalnaickanahalli, Naduhalli, Nagarkoodal, Naickanahalli, Nallampalli, Nallanahalli, Nathathahalli, Nekkundhi, Neonahalli, Noolahalli, Pagalahalli, Palavadi, Palayam, Pangunatham, Pappinaickanahalli, Pulidikarai, Settikarai, Sivadi, Somenahalli, Thadangam, Thippireddihalli, Thoppur T Kanigarahalli, Ungaranhalli, Vathalamalai, Vellalapatti, Vellegoundan Palayam, Vellolai and Veppilaimuthempatti. The marginal area of cultivable
landuse are converted into settlements causes increasing of pressure on the quarry area causes increased land temperature and ground water contamination.
Settlements and built-ups: Settlements and built-ups refers to the land areas of human habitation covered by buildings, road networks, rails, infrastructures and other utilities in association with livelihood activities. The Hosur is one of the important industry spots in the Tamil Nadu state. The settlement areas are directly proportional to the growth of population in these areas and it increases predominantly due to better access of daily human needs. The aerial extent of settlements and built-ups is 17.54 km2 in 2000 and it covers 6.01% of the total study area (Fig. 7 a and b). Due to extending of settlements in rural as well as urban areas, this is increased to 39.22 km2 corresponding to 13.43% of the total area in 2011 (Table 3). This highlight the 7.42% of the area in settlements and built-ups is developed during the past decade on landforms, cultivable land, fallow land and barren land by encroachment of natural land cover features. It is noticed that the encroachment of land cover for settlements and built-ups in a large scale produce negative impact on hilly ecosystem and increases rate of vulnerability to the study area.
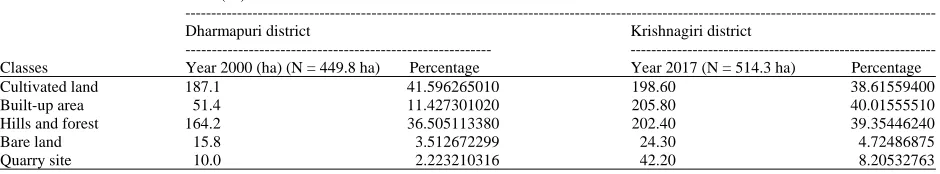
[image:10.612.72.542.514.601.2]Land use and land cover transformation between 2000 and 2017: Land use and land cover transformation refers to the process of change dynamics in land features from one form to another during periodical times due to natural or human induced transformation activities. Land features are experiencing continuous state of transformation from their existing form into another form depending on local environmental suitability and local people requirements. Table 3 and 4 shows the result of change detection matrix
Table 3: Area in ha of the different LULC classes for the years 2000 and 2017 Area (ha)
---Dharmapuri district Krishnagiri district
---
---Classes Year 2000 (ha) (N = 449.8 ha) Percentage Year 2017 (N = 514.3 ha) Percentage
Cultivated land 187.1 41.596265010 198.60 38.61559400
Built-up area 51.4 11.427301020 205.80 40.01555510
Hills and forest 164.2 36.505113380 202.40 39.35446240
Bare land 15.8 3.512672299 24.30 4.72486875
Quarry site 10.0 2.223210316 42.20 8.20532763
Table 4: Relative change in area (Acres) of the different LULC classes for the period 2000 and 2017 Area change (Acres)
---Dharmapuri district Krishnagiri district
---
---Classes Year 2000 Year 2017 Year 2000 Year 2017
Cultivated land 156.4 187.1 147.8 198.60
Built-up area 75.9 51.4 156.3 205.80
Hills 197.2 164.2 236.4 202.40
Bare area 10.4 15.8 10.5 24.30
Quarry site 4.2 10.0 12.4 42.20
[image:10.612.70.541.630.713.2]J. Eng. Applied Sci., 15 (2): 384-397, 2020
Fig. 8: (a) LULC map of Krishnagiri in the year 2000 and (b) LULC map of Krishnagiri in the year 2017 massively of LULC transformations which denotes the amount of
area in LULC features transferred from pre-existing
state to another one or more states in the study area during 2000-2017. Figure 8a and b shows the graphical
77”50’0’E 75”35’30’E
77”50’0’E 75”35’30’E
E
10 5 0 10
km
15”8’0’N 15”8’0’N
12”22’30’N 12”22’30’N
Krishnagiri district (a)
W
S N
12”22’30’N 12”22’30’N
15”8’0’N 15”8’0’N
77”50’0’E 75”35’30’E
77”50’0’E 77”50’0’E
10 5 0 10
km
W
S N
E Krishnagiri district
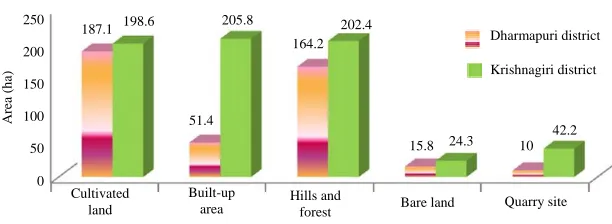
[image:11.612.107.478.77.672.2]250 200 150 100 50 0 A rea (h a) Cultivated land Built-up area
Hills Bare area Quarry site
Classes Year 2000
[image:12.612.142.448.92.204.2]Year 2017
Fig. 9: Graphical representation of LU/LC classes for the study period representation of LULC feature transformation over time.
During these periods, the total area of 45.90 km2 in various landuse and land cover are transformed or interchanged into another one or more forms. In which the major LULC features such as cultivable land (2.23 km2 ), fallow land (15.32 km2), barren land (2.14 km2) plantations and other woody vegetations (1.05 km2) are presently occupied for settlements and built-ups in large scale and hence the spatial coverage of settlement and built-ups is predominantly increased from 17.54-39.22 km2 during 2000-2017 (Fig. 9).
Accuracy assessment: Accuracy assessment is an
integral process of feature extraction from the classified images. It highlights the possible sources of errors in a classified image, thus, enhancing the quality of information derived from the data. Therefore, it is critical to ensuring the accuracy of the information used in the decision process through statistical analysis based on the pre and post-field ground truth verification and available collateral information. The standard method is used to assess the accuracy of classified image is confusion matrix or simply known as error matrix.
This method allows the comparison of pixels of classified image to the corresponding pixels of referenced image for which the class is known. The confusion matrix compiles pixels of agreement and disagreement by comparing the location and class of each ground truth pixel with the corresponding location and class in the classification image. It is a cxc matrix (c is the number of classes) assigned by columns and rows, the elements of which indicate the number of pixels in the testing data. In this matrix, the columns depict the number of pixels in a class of the reference data and the rows show the number of pixels in a class of the classified image. From this error matrix, the accuracy assessment is implemented using three different scales namely producer’s accuracy user’s accuracy and overall accuracy based on the rule of error of commission and error of omission. In which the producer’s accuracy is defined as total number of correctly classified units (pixels) in a particular class(xy) divided by total number of class (xy) units (pixels) identified in reference data. Whereas user’s accuracy is
Fig. 10: Relative change in area (Acres) of the different LULC classes for the period 2000 and 2017 defined as the correctly classified class (xy) divided by total number of units (pixels) classified as class (xy). The overall accuracy is the sum of all correctly classified units (pixels) divided by total number of units (pixels) of all classes. The Kappa coefficient is another measurement in image classification technique used to measure the extent of classification accuracy for diagonal elements as well as for all the elements. In the confusion matrix, the pixels are calculated for coefficient values based on the difference between the actual agreement in the error matrix and the chance agreement in the total row and columns.
In the ensuing 18 years to 2017, the study area undergone an unprecedented change that results in a massive shift in the land use and land cover types where some land uses massively shrank (cultivated land accounted for only 28.2% of the area which is less than half its size in 2000 and nearly less than half its size in 2017 while bare area accounted for only 10.9% which is less than half its size in 2000 and 2017 and forest cover significantly decreased to only 3.6%) while others expanded (built-up area expanded to 46.4%, nearly four times its size in 2000 and about three times its size in 2017).
[image:12.612.247.519.94.338.2]The major change in land use type in 2017, however was the massive expansion of quarrying activities to 10.7% of the area which is more than 10 fold increase from 2000 and an 8 fold increase from 2017 (Fig. 10). Cultivated land Built-up area Hills and
forest Bare land Quarry site
CONCLUSION
The experimental results obtained in this research demonstrated that remote sensing is a valuable tool in detecting land cover changes within granite quarries of Dharmapuri and Krishnagiri districts of Tamil Nadu. Pattern classification was found favourable for this research as it could better differentiate features with similar spectral properties like build-up land, quarries and other mining areas when compared to unpattern classification. There was a significant loss of vegetation, increases of temperature and increase in granite quarries between the year 2000 and 2017. It can be concluded that granite quarries like any other mining activities has the potential to impact the environment negatively.
REFERENCES
Anderson, A.T., D. Schultz, N. Buchman and H.M. Nock, 1977. Landsat imagery for surface-mine inventory. Photogramm. Eng. Remote Sens., 43: 1027-1036. Bhuiyan, A.H., C. Siwar and S.M. Ismail, 2016.
Sustainability measurement for ecotourism destination in Malaysia: A study on Lake Kenyir, Terengganu. Soc. Indic. Res., 128: 1029-1045. Bonifazi, G., L. Cutaia, P. Massacci and I. Roselli,
2003. Monitoring of abandoned quarries by remote sensing and in situ surveying. Ecol. Model., 170: 213-218.
Gorelick, N., M. Hancher, M. Dixon, S. Ilyushchenko and D. Thau et al., 2017. Google earth engine: Planetary-scale geospatial analysis for everyone. Remote Sens. Environ., 202: 18-27.
Kaliraj, S., N. Chandrasekar, K.K. Ramachandran, Y. Srinivas and S. Saravanan, 2017. Coastal landuse and land cover change and transformations of Kanyakumari coast, India using remote sensing and GIS. Egypt. J. Remote Sens. Space Sci., 20: 169-185.
Kamaruddin, A.F., M.E. Toriman, H. Juahir, S.M. Zain, M.N.A. Rahman, M.K.A. Kamarudin and A. Azid, 2015b. Spatial characterization and identification sources of pollution using multivariate analysis at Terengganu river basin, Malaysia. J. Teknol., 77: 269-273.
Kamarudin, M.K.A., M.E. Toriman, H. Juahir, A. Azid and M.B. Gasim et al., 2015a. Assessment of river plan change using rs and gis technique. Jurnal Teknologi, 76: 31-38.
Kamarudin, M.K.A., M.E. Toriman, N.A. Wahab, H. Juahir and A. Endut et al., 2017. Development of stream classification system on tropical areas with statistical approval in Pahang River basin, Malaysia. Desalin. Water Treat., 96: 237-254.
Kantakumar, L.N. and P. Neelamsetti, 2015. Multi-temporal land use classification using hybrid approach. Egypt. J. Remote Sens. Space Sci., 18: 289-295.
Lekha, S.L.S. and S.S. Kumar, 2015. Land cover change analysis of Kanyakumari district using sensor images in GIS environment. Intl. J. Appl. Eng. Res., 10: 279-287.
Liu, C.C., C.A. Wu, M.L. Shieh, J.G. Liu and C.W. Lin et al., 2005. Monitoring the illegal quarry mining of gravel on the riverbed using daily revisit FORMOSAT-2 imagery. Proceedings of the 2005 IEEE International Symposium on Geoscience and Remote Sensing (IGARSS '05), July 29, 2005, IEEE, Seoul, South Korea, ISBN:0-7803-9050-4, pp: 1777-1780.
Lv, Q., Y. Dou, X. Niu, J. Xu and J. Xu et al., 2015. Urban land use and land cover classification using remotely sensed SAR data through deep belief networks. J. Sens., 2015: 1-10.
Mahmon, N.A., N. Ya'Acob and A.L. Yusof, 2015. Differences of image classification techniques for land use and land cover classification. Proceedings of the 2015 IEEE 11th International Colloquium on Signal Processing and its Applications (CSPA), March 6-8, 2015, IEEE, Kuala Lumpur, Malaysia, ISBN:978-1-4799-8249-3, pp: 90-94.
Nikolakopoulos, K.G., P.I. Tsombos and A.D. Vaiopoulos, 2010. Monitoring a quarry using high resolution data and GIS techniques. Proceedings of the SPIE International Conference on Society for Optics and Photonics Earth Resources and Environmental Remote Sensing/GIS Applications Vol. 7831, October 25, 2010, SPIE, Toulouse, France, pp: 78310R-1-78310R-10.
Nitze, I., G. Grosse, B.M. Jones, C.D. Arp and M. Ulrich et al., 2017. Landsat-based trend analysis of lake dynamics across Northern permafrost regions. Remote Sens., 9: 1-28.
Rawat, J.S. and M. Kumar, 2015. Monitoring land use/cover change using remote sensing and GIS techniques: A case study of Hawalbagh block, district Almora, Uttarakhand, India. Egypt. J. Remote Sens. Space Sci., 18: 77-84.
Rwanga, S.S. and J.M. Ndambuki, 2017. Accuracy assessment of land use/land cover classification using remote sensing and GIS. Intl. J. Geosci., 8: 611-622.
Toriman, M.E., F.M. Ata, M.K.A. Kamarudin and M. Idris, 2013. Bed-load sediment profile and effect of river bank erosion on river cross-section. Am. J. Environ. Sci., 6: 292-300.
Toriman, M.E., S.N.F. Abdullah, I.A. Azizan, M.K.A. Kamarudin and R. Umar et al., 2015. Spatial and temporal assessment on drug addiction using multivariate analysis and GIS. Malaysian J. Anal. Sci., 19: 1361-1373.
Wahab, N.A., M.K.A. Kamarudin, A. Anuar, F.M. Ata and N.H. Sulaiman et al., 2017. Assessments of lake profiling on temperature, Total Suspended Solid (TSS) and turbidity in the Kenyir Lake, Terengganu, Malaysia. J. Fundam. Appl. Sci., 9: 256-278. Wahab, N.A., M.K.A. Kamarudin, M.B. Gasim, R. Umar,