University of Warwick institutional repository: http://go.warwick.ac.uk/wrap
A Thesis Submitted for the Degree of PhD at the University of Warwick
http://go.warwick.ac.uk/wrap/51600
This thesis is made available online and is protected by original copyright. Please scroll down to view the document itself.
by
Mohammed A. AL Ghamdi
A thesis submitted to The University of Warwick in partial fulfilment of the requirements
for admission to the degree of
Doctor of Philosophy
Department of Computer Science
THE LIBRARY Tel: +44 24 76523523 Fax: +44 24 76524211
AUTHOR:Mohammed A. Al Ghamdi DEGREE:Ph.D.
TITLE:Predictive Dynamic Resource Allocation for Web Hosting Environments
DATE OF DEPOSIT: . . . .
I agree that this thesis shall be available in accordance with the regulations governing the University of Warwick theses.
I agree that the summary of this thesis may be submitted for publication.
I agree that this thesis may be photocopied (single copies for study purposes only).
Theses with no restriction on photocopying will also be made available to the British Library for microfilming. The British Library may supply copies to individuals or libraries. subject to a statement from them that the copy is supplied for non-publishing purposes. All copies supplied by the British Library will carry the following statement:
“Attention is drawn to the fact that the copyright of this thesis rests with its author. This copy of the thesis has been supplied on the condition that anyone who con-sults it is understood to recognise that its copyright rests with its author and that no quotation from the thesis and no information derived from it may be published without the author’s written consent.”
AUTHOR’S SIGNATURE: . . . .
USER’S DECLARATION
1. I undertake not to quote or make use of any information from this thesis without making acknowledgement to the author.
2. I further undertake to allow no-one else to use this thesis while it is in my care.
DATE SIGNATURE ADDRESS
E-Business applications are subject to significant variations in workload and this can cause exceptionally long response times for users, the timing out of client requests and/or the dropping of connections. One solution is to host these applications in vir-tualised server pools, and to dynamically reassign compute servers between pools to meet the demands on the hosted applications. Switching servers between pools is not without cost, and this must therefore be weighed against possible system gain.
This work is concerned with dynamic resource allocation for multi-tiered, cluster-based web hosting environments. Dynamic resource allocation is reactive, that is, when overloading occurs in one resource pool, servers are moved from another (quieter) pool to meet this demand. Switching servers comes with some overhead, so it is important to weigh up the costs of the switch against possible system gains. In this thesis we combine the reactive behaviour of two server switching policies – the Proportional Switching Policy (PSP) and the Bottleneck Aware Switching Policy (BSP) – with the
proactiveproperties of several workload forecasting models.
Acknowledgements
I am grateful to many people for their assistance, advice, guidance and friendship during the course of this work. To my supervisor, Prof. Stephen Jarvis, who first guided me to this research area, and giving me the opportunity to work in the Performance Computing and Visualisation Group at Warwick and providing a never-ending source of optimism, good-will and guidance. I am truly grateful for his support, advice and encouragement.
I am grateful to Dr Ligang He for acting as my second supervisor, particularly for his advice during the years of my degree. A special vote of thanks should go to Dr Adam Chester for his relentless hard work, support and the many hours of discussion during our research collaboration. It is a pleasure to acknowledge the many mem-bers and colleagues of the Performance and Visualisation Group both past and present including, Dr Simon Hammond (Sandia National Laboratories, USA), Dr Gihan Mu-dalige (Oxford University, UK), Dr Matthew Leeke, Dr Nathan Griffiths, Dr Arshad Jhumka, Malik Awan, James Davis, Henry Franks, John Pennycook, Oliver Perks, Jes-sica Smith, Steven Wright (University of Warwick, UK) and last but by no means least, Dr James Xue (Northampton University, UK), who have helped in countless ways over the course, particularly for his advice during the early years of my degree.
Declarations
This thesis is presented in accordance with the regulations for the degree of Doctor of Philosophy. It has been composed by myself and has not been submitted in any previ-ous application for any degree. The work described in this thesis has been undertaken by myself except where otherwise stated. Portions of this work have been published in the following publications:
• M. Al-Ghamdi, A.P. Chester, J.W.J. Xue, S.A. Jarvis, The Effect of Server Re-allocation Time in Dynamic Resource Allocation, UK Performance Engineering Workshop 2009, 6-7th July, 2009, Leeds, UK.
• M. Al-Ghamdi, A.P. Chester, S.A. Jarvis, Predictive and Dynamic Resource Al-location for Enterprise Applications, IEEE International Conference on Scalable Computing and Communications, 29 June - 01 July 2010, Bradford, UK.
• M. Al-Ghamdi, A.P. Chester, L. He, S.A. Jarvis, Dynamic Resource Alloca-tion and Active Predictive Models for Enterprise ApplicaAlloca-tions. In Proceedings of the 1st International Conference on Cloud Computing and Services Science (CLOSER 2011), 7-9th May, 2011, Noordwijkerhout, The Netherlands.
• A.P. Chester, M. Leeke,M. Al-Ghamdi, A. Jumka, S.A. Jarvis, A Framework for Data Center Scale Dynamic Resource Allocation Algorithms. 11th IEEE In-ternational Conference on Scalable Computing and Communications, 30 August - 2 September 2011, Pafos (Paphos), Cyprus.
• M. Al-Ghamdi, A.P. Chester, L. He, S.A. Jarvis, Dynamic Active Window Man-agement: A method for improving revenue generation in Dynamic Enterprise Systems. 11th IEEE International Conference on Scalable Computing and Com-munications, 30 August - 2 September 2011, Pafos (Paphos), Cyprus.
Sponsorship and Grants
This work is supported in part by the UK Engineering and Physical Science Research Council (EPSRC) contract number EP/C538277/1, “Dynamic Operating Policies for Commercial Hosting Environments”. This project involved collaboration with IBM, HP Labs, the University of Newcastle and the National Business to Business Centre.
PDRAS- Pre-defined resource allocation system
DRAS- Dynamic resource allocation system
QNM- Queuing network model
QoS- Quality of service
SLA- Service level agreement
QNM- Queuing network model
CA- Convolution algorithms
MVA- Mean value analysis
AMVA- Approximate mean value analysis
PSP- Proportional switching policy
BSP- Bottleneck-aware switching policy
AC- Admission control
LO- Last Observation
SA- Simple Algorithm
SMA- Sample Moving Average
EMA- Exponential Moving Average
LPF- Low Pass Filter
MSE- Mean Square Error
MAPE- Mean Average Percentage Error
MAD- Mean Absolute Deviation
CFE- Cumulative sum of Forecast Error
AWM- Active Window Model
VM- Voting Model
SM- Selective Model
DAWM- Dynamic Active Window Model
Abstract i
Dedication iii
Acknowledgements iv
Declarations vi
Sponsorship and Grants viii
Abbreviations ix
List of Figures xix
List of Tables xxii
1 Introduction 1
1.1 Motivation and Problem Statement . . . 2
1.2 Thesis Contributions . . . 3
1.3 Thesis Limitations . . . 5
CONTENTS
2 Background Research 8
2.1 Service Level Agreements (SLAs) . . . 10
2.2 Resource Management . . . 10
2.2.1 Pre-defined resource allocation system (PRAS) . . . 11
2.2.2 Dynamic resource allocation system (DRAS) . . . 11
2.2.3 Proportional Switching Policy . . . 13
2.2.4 Bottleneck-aware Switching Policy . . . 13
2.3 Performance Modelling . . . 17
2.3.1 Queuing Network Models . . . 18
2.4 Bottleneck and Admission Control . . . 22
2.5 Fundamental Laws . . . 26
2.5.1 Utilization Law . . . 27
2.5.2 Forced Flow Law . . . 28
2.5.3 Service Demand Law . . . 28
2.5.4 Little’s Law . . . 29
2.5.5 Response Time Law . . . 29
2.6 Solving Multi-Class Closed Queueing Networks . . . 31
2.6.1 Mean Value Analysis . . . 32
3 Impact of Server Allocation Time on Dynamic Server Switching 34 3.1 Introduction . . . 34
3.1.1 Chapter Contributions . . . 35
3.1.2 Chapter Structure . . . 36
3.2 Additional Related Work . . . 36
3.3.1 The System Model . . . 37
3.3.2 Modelling the Revenue Function . . . 40
3.4 Experimental Setup and The Workload . . . 42
3.4.1 Experimental Setup . . . 42
3.4.2 The Workload . . . 44
3.5 Experimental Results . . . 46
3.5.1 Experiment One . . . 48
3.5.2 Experiment Two . . . 50
3.5.3 Experiment Three . . . 52
3.5.4 Experiment Four . . . 54
3.5.5 Experiment Five . . . 57
3.5.6 Experimental Results Analysis . . . 59
3.6 Summary . . . 60
4 Predictive and Dynamic Resource Application for Enterprise Applications 62 4.1 Introduction . . . 62
4.1.1 Chapter Contributions . . . 64
4.2 Additional Related Work . . . 65
4.3 Modelling of Multi-tiered Internet Services and Server Switching Poli-cies . . . 65
4.4 The Workload and Predictive Algorithms . . . 66
4.4.1 The Workload . . . 66
4.4.1.1 Workload Characterization . . . 67
4.4.2 Predictive Algorithms . . . 68
CONTENTS
4.4.2.2 ii) Simple Algorithm (SA) . . . 69
4.4.2.3 iii) Sample Moving Algorithm (SMA) . . . 69
4.4.2.4 iv) Exponential Moving Algorithm (EMA) . . . 70
4.4.2.5 v) Low Pass Filter (LPF) . . . 70
4.4.2.6 vi) Autoregressive Integrated Moving Average Model (ARIMA) . . . 71
4.5 Experimental Setup and Results . . . 71
4.5.1 Experimental Setup . . . 71
4.5.2 Accuracy Forecasting Results . . . 72
4.5.3 Accuracy of the Forecasting Analysis . . . 74
4.5.4 Combining Forecasting and Dynamic Server Switching . . . . 76
4.5.5 Experiment One . . . 76
4.5.6 Experiment Two . . . 77
4.5.7 Experiment Three . . . 77
4.5.8 Experiments Results Analysis . . . 78
4.6 Summary . . . 88
5 The Development and Application of Meta-forecasting 89 5.1 Introduction . . . 89
5.1.1 Chapter Contributions . . . 90
5.2 Additional Related Work . . . 90
5.3 The Workload and Predictive Models . . . 91
5.3.1 Active Window Model (AWM) . . . 92
5.3.2 Voting Model (VM) . . . 93
5.4 Experimental Setup, Results, and Analysis . . . 94
5.4.1 Experimental Setup . . . 94
5.4.2 Experimental Results . . . 95
5.4.2.1 i) Experiment One . . . 95
5.4.2.2 ii) Experiment Two . . . 97
5.4.2.3 iii) Experiment Three . . . 98
5.4.3 Analysis . . . 100
5.5 Summary . . . 107
6 Dynamic Active Windows, Workload Pattern Analysis and Extreme Work-loads 109 6.1 Introduction . . . 109
6.1.1 Chapter Contributions . . . 110
6.2 Additional Related Work . . . 111
6.3 Predictive Models . . . 112
6.3.1 Dynamic Active Window Model (DAWM) . . . 112
6.3.1.1 i) Burstiness Technique and Monitoring Window Size113 6.3.1.2 ii) Arrival Rate Technique . . . 115
6.3.2 Workload Pattern Analysis (WPA) . . . 115
6.4 Experimental Results and Analysis . . . 116
6.4.1 Experiment One . . . 116
6.4.2 Experiment Two . . . 118
6.4.3 Experiment Three . . . 123
6.4.4 Analysis . . . 124
CONTENTS
7 Conclusions and Future Research 131
2.1 Multiple (3-tier) application architecture [10] . . . 9
2.2 Dynamic Resource Allocation over Increased Demand . . . 12
2.3 A model of a single-server queue [46] . . . 19
2.4 A model of a multi-server queue [46] . . . 20
2.5 Service demands of matrix Land the set of its projections pro j(L) in the loadings space [8] . . . 23
2.6 Characteristic polytopeTLof the two-class loading matrixL[8] . . . 24
2.7 Bottleneck identification using convex polytopes [54] . . . 25
3.1 A model of a typical configuration of a cluster based multi-tiered In-ternet service. C represents customer machines; WS, AS and DS rep-resent web servers, application servers and database servers, respectively. 38 3.2 The First Inversely Proportional Workload . . . 43
3.3 The Second Inversely Proportional Workload . . . 44
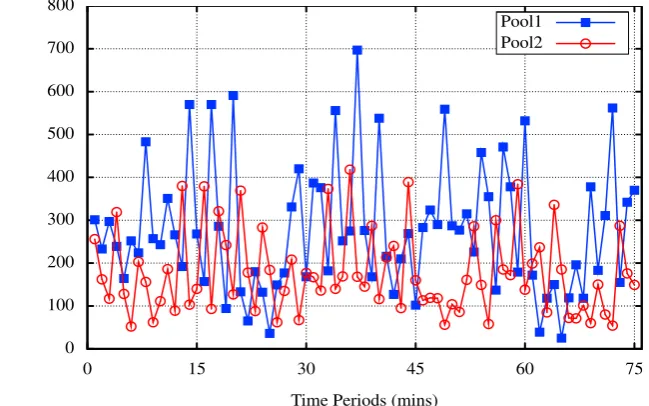
3.4 A sample of the total requests in the real-world workload for both ap-plication pools . . . 46
LIST OF FIGURES
3.6 Revenue Generated by the Bottleneck Aware Switching Policy (BSP) Over Workload One at Different Reallocation Times . . . 49
3.7 Revenue Generated by the Proportional Switching Policy (PSP) Over Workload Two at Different Reallocation Times . . . 51
3.8 Revenue Generated by the Bottleneck Aware Switching Policy (BSP) Over Workload Two at Different Reallocation Times . . . 51
3.9 Revenue Generated by the Proportional Switching Policy (PSP) Over Workload Three at Different Reallocation Times . . . 52
3.10 Revenue Generated by the Bottleneck Aware Switching Policy (BSP) Over Workload Three at Different Reallocation Times . . . 53
3.11 Revenue Generated by the Proportional Switching Policy (PSP) Over Workload Four at Different Reallocation Times . . . 55
3.12 Revenue Generated by the Proportional Switching Policy (BSP) Over Workload Four at Different Reallocation Times . . . 56
3.13 Revenue Generated by the Proportional Switching Policy (PSP) Over Workload Five at Different Reallocation Times . . . 57
3.14 Revenue Generated by the Proportional Switching Policy (BSP) Over Workload Five at Different Reallocation Times . . . 59
4.1 A sample of the total requests in the real-world workload for both ap-plication pools . . . 66
5.1 Revenue samples from applying the seven predictors (NASA work-load, PSP switching policy) . . . 92
5.3 Revenue using Active Window Model (AWM), Voting Model (VM), and Selective Model (SM) over the second workload . . . 98
5.4 Revenue using Active Window Model (AWM), Voting Model (VM), and Selective Model (SM) over the third workload . . . 99
6.1 A sample of the total requests in the synthetic workload for both appli-cation pools . . . 119
6.2 Revenue using Active Window Model (AWM), Dynamic Active Win-dow Model (DAWM), Voting Model (VM), and Selective Model (SM) over the fourth workload . . . 120
6.3 The total requests in the first real-world workload for both application pools . . . 121
6.4 The total requests in the second real-world workload for both applica-tion pools . . . 122
List of Tables
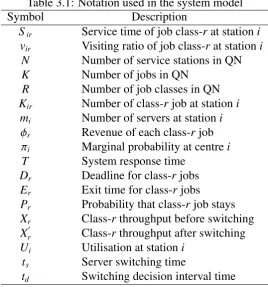
2.1 Notation used in the system model . . . 13
2.2 Fundamental Performance Laws . . . 30
3.1 Notation used in the system model . . . 39
3.2 The main experimental parameters. . . 43
4.1 Notation used in the predictors . . . 69
4.2 Forecasting accuracy measures . . . 73
4.3 Forecast accuracy, against four different criteria, for the seven forecast algorithms over the first workload . . . 80
4.4 Forecast accuracy, against four different criteria, for the seven forecast algorithms over the second workload . . . 81
4.5 Forecast accuracy, against four different criteria, for the seven forecast algorithms over the third workload . . . 82
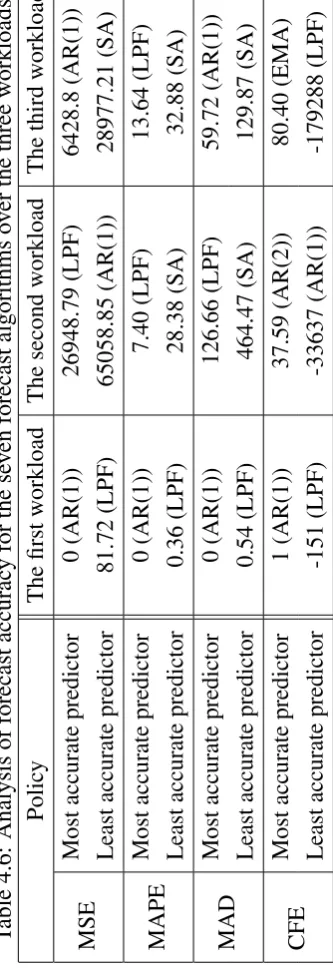
4.6 Analysis of forecast accuracy for the seven forecast algorithms over the three workloads . . . 83
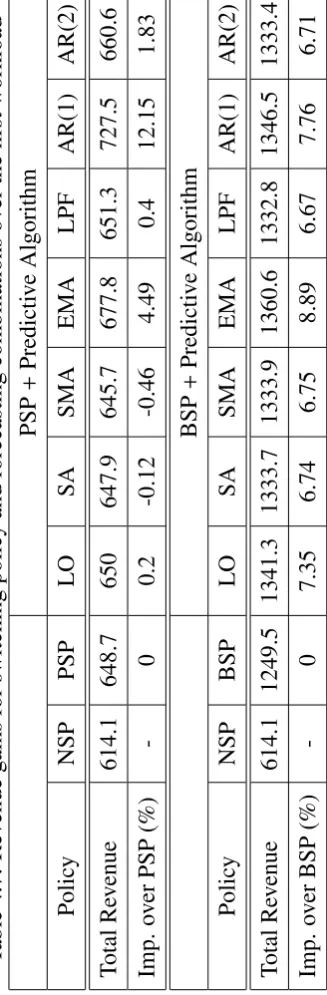
4.8 Revenue gains for switching policy and forecasting combinations over the second workload . . . 85
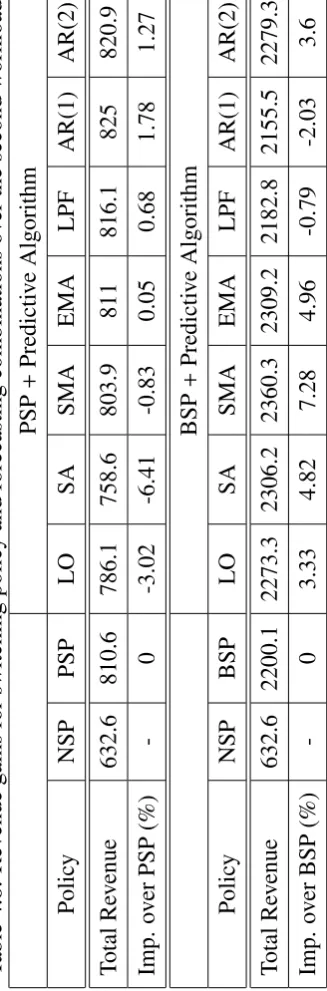
4.9 Revenue gains for switching policy and forecasting combinations over the third workload . . . 86
4.10 Analysis of the forecast algorithms over the three workloads using the two switching policies (PSP and BSP) . . . 87
5.1 Revenue gains for switching policy and forecasting combinations over the first workload . . . 101
5.2 Revenue gains for switching policy and forecasting combinations over the second workload . . . 102
5.3 Revenue gains for switching policy and forecasting combinations over the third workload . . . 103
5.4 Analysis of the first workload . . . 104
5.5 Analysis of the second workload . . . 105
5.6 Analysis of the third workload . . . 106
6.1 Analysis of applying the forecasting models (DAWM) and (AWM) alongside PSP over the three real-world workloads . . . 125
6.2 Analysis of applying the forecasting models (DAWM) and (AWM) alongside BSP over the three real-world workloads . . . 126
6.3 Revenue gains for the switching policy and forecasting combinations over the fourth workload . . . 127
LIST OF TABLES
Introduction
The rapid expansion of the Internet and its applications has forced both industrial and academic researchers to focus their attention on ensuring that these applications deliver appropriate levels of service to their customers without delay or errors. E-Business applications for on-line banking or on-line retail are examples of such Internet appli-cations which are attracting people in their millions to use on-line services of this kind. Internet workload has been shown to increase significantly with this huge expan-sion in Internet applications and their uses. Dynamic resource allocation systems (DRAS) play a crucial role in such environments.
Hosting these application is a difficult task. Internet hosting organisations must balance the amount of hardware that they purchase: too few servers may mean that cus-tomers requests are dropped or responded to with significant delay; too many servers may mean that during quieter periods, many of the servers go unused.
1.1 Motivation and Problem Statement
during the reconfiguration process until the new configuration is again successfully deployed. The up-side is that dynamic resource allocation systems can deal with huge variations in application demands, as the available resources are always re-allocated between different applications depending on the demand on these resources from the different applications.
The online applications of interest in this thesis usually employ multi-tiered archi-tectures (web tier, application tier, anddata-persistence tier) and are typically hosted on Internet hosting platforms. Each of these online applications usually have separate service level agreements (SLA). These agreements specify the level of service that will be delivered to the customer by the application, based on a specific target for perfor-mance (e.g. response time for a given application) and availability (e.g. whether a request is serviced). SLAs also define the penalties that should be paid if such tar-gets are not met or if the level of the delivered service is not that agreed between the application provider and the customer.
1.1
Motivation and Problem Statement
Internet hosting centres host multiple Internet applications and require multiple re-sources to be shared between these different applications. It has been shown that pre-allocating resources at the design stage may affect the system performance, as resources will be wasted in the situation where the demand is low and may the re-sources requirements exceed the capacity of the system when the demand is high. As a result, dynamic resource allocation systems may be applied in order to improve the total system revenue (for the provider) and to enhance the performance of the whole system (for the customer).
unnecessary delay which may occur as a result of increasing the number of accesses to that application. In other words, expanding the popularity of an Internet application is not cost free, as more expense is necessary for upgrading and developing the appli-cation to maintain the continuing requirements. Improving the appliappli-cation in order to meet the customers’ requirements needs to be considered.
Improving service delivery can be done either by studying similar applications that offer similar services or by monitoring the application for a specific period in order to observe the application’s behaviour, which usually gives a clear picture as to how the application is used and how it can be developed in the future. Thus, capacity planning and workload forecasting play a crucial role in mitigating such issues [53].
1.2
Thesis Contributions
The principal contributions of this thesis are as follows:
• We study the impact of server switching time in distributed and dynamic en-terprise systems. The switching time is defined as the time taken to reallocate servers between applications. Our aim is to investigate the link between switch-ing time and total system performance, as well as how the switchswitch-ing policies themselves behave with changeable switching times. For this purpose, we in-tegrate two well known switching policies – the Proportional Switching Policy (PSP) and the Bottleneck-aware Switching Policy (BSP) – with variable switch-ing times in a test system. Experiments are conducted on synthetic workloads and we draw conclusions as to the suitability of the switching policies in different practical settings (see Chapter3).
work-1.2 Thesis Contributions
load prediction and dynamic server switching can be explored. A multi-tiered, cluster-based, multi-server solution is modelled, which provides bottleneck iden-tification through the use of convex polytopes and also employes admission con-trol. A workload model is also constructed from the characterisation of real data from several different sources. Several schemes for workload prediction have been introduced including: Last Observation (LO), Simple Algorithm (SA), Sample Moving Average (SMA), Exponential Moving Average (EMA), Low Pass Filter (LPF), and Autoregressive Integrated Moving Average (ARIMA). A comparison between the forecast accuracy of these schemesin combination with dynamic server switchingis conducted using several metrics – Mean Square Er-ror (MSE), Mean Average Percentage ErEr-ror (MAPE), Mean Absolute Deviation (MAD) and the Cumulative sum of Forecast Error (CFE) (see Chapter4).
• We extend our models in order to address issues that arise when a single forecast-ing model is used, as each of the forecastforecast-ing schemes is shown to have its own bias. As a result, three different meta-forecasting algorithms are developed – Ac-tive Window Model (AWM), Voting Model (VM), and SelecAc-tive Model (SM). In the first model (AWM), data points are collected during an active window, and a predictor which deliveries the best revenue for the last active window, is em-ployed. All predictors are used in the voting model (VM) and a server switch is enacted if the majority vote requires. The selective model (SM) applies the best predictor from the last time period to the next time period (see Chapter5).
either a burstiness factor – the window size decreases when the workload be-comes more bursty or based on the correlation between the requests arrival rate and the mean arrival rate for incoming requests to the system. In addition to this, we introduce a historical prediction model – the Workload Pattern Analysis (WPA) model which exploits the periodicity of web traffic to predict workload where the predicted number of requests in this model is related to the previous number of requests found at the same time of day (e.g. the number of requests at mid-night for a specific day is related to the number of requests at midnight recorded during the previous week). All schemes are tested on real-world work-loads and also workwork-loads containing extreme events (see Chapter6).
1.3
Thesis Limitations
There are number of important factors – system performance, resource reallocation mechanisms, fault tolerance, and quality of service – that play a crucial role in ensur-ing that the highest level of success in dynamic resource allocation systems are met. Performance of the system is a significant issue that should be considered in such envi-ronments as the ideal target for providing such model is to improve the overall system performance.
How and when to reallocate resources between different applications hosted in an Internet hosting centre is also important and should be studied in such environments. This thesis focus on these two factors through the construction of theoretical models and simulations, where the resources are reassigned between the hosted applications in order to improve the total performance of the system.
1.4 Thesis Overview
rate of resources could also be considering when developing new dynamic resource allocation policies.
In this thesis, switching servers are considered only between the same tier (e.g. servers from the application tier can be only moved to the application tier of another resource pool). Therefore switching servers between different tiers (e.g. servers from a web tier on a quieter pool are moved to the application tier of another pool) is work to be considered in further research.
1.4
Thesis Overview
This chapter detailed the underlying goals, open questions and motivations for the research presented in this dissertation. The remainder of this thesis is organised as follows:
In Chapter2, background research is presented. This includes different techniques that are applied to improve system performance such as bottleneck and admission control. Dynamic server switching polices are also introduced in order to frame the subsequent research.
Chapter 3presents the system model that is used in this thesis, where a multi-tiered, cluster-based, multi-server solution is modelled, which contains bottleneck identifica-tion through the use of convex polytopes and admission control. The impact of the switching time on such an environment is detailed in this chapter. Experiments are conducted using two inversely proportional workloads.
dynamic resources allocation. The predictors that are applied here include: Last Ob-servation (LO), Simple Algorithm (SA), Sample Moving Average (SMA), Exponential Moving Average (EMA), Low Pass Filter (LPF), and Autoregressive Integrated Mov-ing Average (ARIMA). As each of these forecastMov-ing schemes has its own bias, three different meta-forecasting models – Active Window Model (AWM), Voting Model (VM), and Selective Model (SM) – are developed. This is documented in Chapter
5.
A new adaptive predictive model and a historical prediction model are developed in Chapter6. Experiments are conducted based on both real-world, highly-variable work-load traces, and also synthetic workwork-loads with extreme events.
Chapter 2
Background Research
An Internet application is defined as an application that is delivered to an Internet-based user from a server over the Internet. An Internet application is often named based on the services that are provided e.g. when the provided services to the user are related to education or learning purposes, then the Internet application is commonly defined as an e-learning application. When the service is related to financial services e.g. bank transactions, then the system is called e-Banking or e-Business application. Internet hosting centres are often used for the cost-effective hosting of such applications. In this thesis we focus on e-Business applications and how to maximise their performance (specifically revenue generation).
a back-end data-persistence tier. This third tier is usually comprised of a relational database management system (RDBMS).
This three-tier architecture (see Figure2.1[10]) improves the performance of web applications by separating the roles between the different tiers. This means that modi-fication of each tier can be conducted independently and they can be hosted indepen-dently on different server architectures. Scalability is also enhanced using such archi-tectures as more application servers can be added without affecting the performance of the system. Further, maintaing the components of the systems can be performed separately without adversely effecting the systems performance.
2.1 Service Level Agreements (SLAs)
2.1
Service Level Agreements (SLAs)
IT companies usually use a third party service provider in order to manage and control the Internet resources that are provided to their customers. The relationship between the customers and the service providers is based on a contract that explains the costs of using the services and the penalties that should be paid when the service provider fails to provide sufficient service to their customer. This contract is known as the Service Level Agreement (SLA).
In other words, a SLA is defined as the level of service agreed between the client and the hosting centre and may include performance and availability targets, with penalties to be paid if such targets are not met. It is in the interests of the service hosting centre to ensure that its SLAs are met so as to maximise its revenue, whilst at the same time ensuring that its resources are well utilised and that extra capacity is not provided without need.
2.2
Resource Management
e-Businesses are usually hosted through multiple applications and systems, each of which is allocated with a sufficient amount of resources which are usually prescribed during the design phase.
With the significant expansion of the Internet and its applications, organisations are all too aware of increasing server’s capacity frequently [56]. Constantly upgrading resources in this way is a naive solution, as increasing the server’s capacity requires time and is costly, it is also the case that the server itself will be unavailable until the upgrading process is done.
collection of servers may be connected via a LAN to serve such an environment [55]. The enterprise applications described in this thesis are distributed on high-availability, high-performance clusters of servers.
In such environment when a single server is down the whole application will con-tinue providing its services (since it is hosted on more than one server); maintenance can be conducted on the faulty server in order to resolve this issue, while the remaining servers continue to host application requests. Therefore, the operation of the applica-tion will not be affected by the dropping of a single server; the performance of the application may be impacted however.
2.2.1
Pre-defined resource allocation system (PRAS)
As stated above, the resources for different applications are usually allocated during the design phase through the process of system capacity planning. Because of the volatile nature of the Internet demand e.g. the visits to Internet applications may vary dramati-cally over a specific period. In such an environment it is difficult to meet the huge and sudden variation in Internet demand as the configuration (resources) is constant and will never change during the deployment phase.
It has been shown that assigning a fixed number of servers to a resource pool is sub-optimal: in many cases resources lay unused and during peak demand there are insufficient resources to service all requests [10].
2.2.2
Dynamic resource allocation system (DRAS)
2.2 Resource Management
overloading occurs in one resource pool, servers are moved from another (quieter) pool to meet the increased demand (see Figure2.2).
Increase demand
Figure 2.2: Dynamic Resource Allocation over Increased Demand
The switching process between the resource pools can be conducted using different policies to ensure that the resources are reallocated into the most favourable configu-ration. The most beneficial policy can be determined by comparing the total revenue achieved from reassigning the new resources. In this thesis two main switching poli-cies – the Proportional Switching Policy (PSP) and the Bottleneck-aware Switching Policy(BSP) – are used, which were developed in [54].
Table 2.1: Notation used in the system model Symbol Description
N Number of service stations in QN
mi Number of servers at stationi
R Number of job classes in QN
Kir Number of class-rjob at stationi
Sir Service time of job class-rat stationi
vir Visiting ratio of job class-rat stationi φr Revenue of each class-rjob
ts Server switching time
td Switching decision interval time
2.1.
2.2.3
Proportional Switching Policy
The proportional switching policy used here is shown in Algorithm 1 and was first presented in [54]. This policy works by allocating servers at each tier proportionally according to workload, subject to an improvement in revenue. The policy is based on the workload as serves are reallocated between the two applications according to the workload. After that, the obtained and lost revenue regarding to the new configurations are computed for both applications; the servers are switched between the applications if the obtained revenue is greater than the lost revenue, otherwise the configuration remains the same.
2.2.4
Bottleneck-aware Switching Policy
2.2 Resource Management
Algorithm 1Proportional switching policy
Input: N,mi,R,Kir,Sir,vir,φr,ts,td
Output: Server configuration
foreachiinNdo m1
i/m 2 i = K
1/K2
end for
calculateVlossandVgainusing eq. 3.9and eq.3.10(see Chapter3).
if Vgain >Vlossthen
do switching according to the calculations
Sir ← S
0
ir
else
server configuration remains the same
end if
return current configuration
Algorithm2). This is a best-effort algorithm [54].
This policy works by check whether tiers in any pool is saturated or not. If so the servers are switched from the saturated pools to the other. Switching the servers can not solve the problem of the saturation if the both pools are saturated [54].
Algorithm 2The bottleneck-aware switching policy
Input: Nr,mi,R,Kir,Sir,vir,φr ,ts,td
Output: new configuration
whilebottleneck saturation found in one pooldo iffound at same tier in the other poolthen
return
else
switch servers to the bottleneck tier
mi ← m
0
i andSir ←S
0
ir
end if end while
search configurations using Algorithm3
return current configuration
tier will not remove the bottleneck. If a bottleneck exists within a single pool, servers are migrated to remove the bottleneck, subject to revenue improvement.
The local search algorithm (see Algorithm 3) works when there is no bottleneck saturation in either pool. The algorithm uses a nested loop to evaluate server migrations starting from the web tier to the application tier before finally evaluating the database tier. The revenue gain is computed at each stage, with the highest revenue state being chosen.
The input of the algorithm (Nr, mi,R, Kir,Sir,vir, φr, ts,td) are presented in table 2.1. The aim of the proposed algorithm is to find the best configuration that can be obtained from using the nested loop technique. The algorithm starts by calculating the utilisation of the web tier (U01andU02), the application tier (U11 andU12), the data base tier (U21 andU22) for both pools. The first while loop in the algorithm completes when the utilisation of the web tier in the first pool is greater than the utilisation of the web tier in the second pool. If so, the number of web servers in the second pool is greater than 1, in order to ensure that there are enough servers switched between the pools. After checking that the number of switched servers that reallocated between the pools are more than 1, the number of the web server of the first pool is increased and the number of web server of the second pool is decreased by one. At the same time the service time for both pools are calculated for future process.
2.2 Resource Management
tier of the first pool is greater than that of the second pool, and also where the number of application servers in the second pool is more than one, the number of servers in the application tier in the first pool is increased by one and at the same time the number of the application servers is decreased by one. Added to this, the new service time is calculated for both pools for future processing. After dealing with application tier, the algorithm moves to the web tier, as the servers are switched from pool two to pool one where i) the utilisation of the web tier in the first pool is greater than that in the second pool and ii) the number of servers in the second pool is more than one server. In such a situation the new services times are computed for both pools. After that the system revenues are computed using the Equation3.9and3.10(see Chapter3for more details) and the current configuration is stored only when the gained revenue is greater than the lost revenue.
Algorithm 3The configuration search algorithm
Input: Nr,mi,R,Kir,Sir,vir,φr ,ts,td
Output: best configuration
Initialisation: computeUi1,Ui2 whileU1
0 > U 2 0 do
ifm20 >1then
m20 ↓,m10 ↑;S20r← S20r0 whileU1
1 >U 2 1 do
ifm21 >1then
m21 ↓,m11 ↑;S21r← S21r0 whileU1
2 >U 2 2 do
ifm22 > 1then
m22↓,m12 ↑;S22r ←S2r20; computeVlossusing eq.3.9(see Chapter3).
S1 2r ←S
10
2r; computeVgain using eq.3.10(see Chapter3).
ifVgain >Vlossthen
store current configuration
end if
compute newUi1,U2i end if
end while
similar steps forU21< U22 S11r ←S11r0; compute newUi1,Ui2 end if
end while
similar steps forU11< U12 S1
0r ←S 10
0r; compute newU 1 i,U
2 i
end if end while
similar steps forU1 0 < U
2 0
return best configuration
2.3
Performance Modelling
fi-2.3 Performance Modelling
nally modelling are the ways that may used in order to understand the behaviour of these computer systems. The first approach is rapid and also flexible, but it is not accurate as it based on using the experience and insight that are difficult to acquire and verify. The second approach which is experimental yields, excellent accuracy, but is not easy to be implemented and is inflexible compared with the first method [26]. Finally, modelling is very flexible compared with theses two approaches, as it is an abstraction of the system where more detail is not needed, and it is less laborious and more flexible than experimentation. The modelling approach is also more methodi-cal, which means that it is a more reliable approach than intuition. Modelling, then, provides a framework for gathering, organising, evaluating, and understanding infor-mation about a computer system [26].
2.3.1
Queuing Network Models
Queueing network models (QNM) are a tool that is used for system modelling, sys-tem performance evaluation and syssys-tem prediction, including production and manu-facturing systems [24] and [26]. In such environments, system resources, users, and transactions are represented by collections of service centres.
A system where multiple customers receive services simultaneously, using multiple service centres and multiple queues and customers may move between the queues, is widely known as queuing network [13]. In such a system, the customer moves from one service centre to the tail of another queue or even to the same service for further transactions. The customer may revisit a queue that has been already visited earlier.
which the customer was served and the time that had been spent until the customer has been served by the service centre respectively. The services are often provided to the customer as a first-in first-out approach, a last-in first-out approach, a piecemeal approach, or a random order approach [13]. In the first case, the customer at the head of the queue receives the service and any new customer is allocated to the tail of the queue. Where the upcoming customer is served first, the queue is known as stack in such approach. The customer’s needs in the third approach are divided between the waiting mode and service mode as the customer job need not to be serviced immedi-ately. In the random approach customers will be served in a random.
Single-class Queuing Networks vs. Multi-class Queueing Networks:
Figure 2.3: A model of a single-server queue [46]
In single-server queues, customers arrive at the service centre and then wait in the queue to be served if required. If the queue is empty the job will be processed immediately. After being served by the service centre, the customer may leave the service centre (see Figure2.3[46]). Single server queues can be found every where in the real-world e.g. airports, banks, and public transport.
2.3 Performance Modelling
Figure 2.4: A model of a multi-server queue [46]
busy, the customer will be queued until a service centre is free (see Figure 2.4 [46]). Various dispatching techniques can be employed in such situation, e.g. round-robin.
Round-robin is one of the simplest algorithms that can be applied in such envi-ronments where a fixed service time is assigned to each process in circular (modulo) order without priority. An example of using the Round-robin algorithm is when the service time given to each job equals 100 milliseconds, and job1, for example, takes 250 milliseconds to complete. In such a situation, the round-robin scheduler suspends
job1 after 100 ms and assigns the next job the same period (100 milliseconds). job1
will be allocated service time only when the other jobs in the queue have themselves been serviced. In other words, job1will complete with the following allocations (first allocation=100 ms, second allocation=100 ms, and the third allocation=50 ms) in order to complete the required job.
Open Queueing Networks vs. Closed Queuing Netwrok:
model or a closed model. The model of queuing network used is determined based on the limit to the number of requests in the system [40]. That is, if the maximum number of system requests are conserved the queuing network is a closed queuing network. While in an open queuing network, there is no limit to the maximum number of requests present in the system model.
In this thesis we use a multi-class closed queueing network to represent our system of interest. The application is modelled using both /M/1/first-come-first-served and
/M/m/first-come-first-served in each station, and it is assumed that servers are clustered at each of the three system tiers.
There are several techniques that can be used in order to solve multi-class closed queuing networks. The first technique used to solve the closed queuing network models is the convolution algorithms [6]. A convolution algorithm works by first computing a set of normalisation constants and then computing the performance measures in terms of these normalisation constants. It relates to this work as it is one of the major al-gorithms for the solution of closed, product-form queueing networks [25]. However, this thesis uses an alternative technique, Mean Value Analysis (MVA), which is now one of the most popular techniques that can be used to solve closed products-form queuing networks. In MVA the performance measure processes are computed directly without computing the normalisation constant (which improves the efficiency of the technique). The simplicity of MVA (developed firstly in [43]) and the accuracy of its results are the main reasons for using MVA in this thesis (see [9] and [54] respectively). Nowadays MVA is applied in a wide range of applications such as computer systems and networks, financial systems, and medical applications. The MVA in this thesis is solved based on based on Little’s law [30] and the Arrival Theorem [45] (see Section
2.4 Bottleneck and Admission Control
2.4
Bottleneck and Admission Control
It is known that the resources that limit the overall performance of the system are the congested ones, referred to as the bottlenecks [8]. A bottleneck in the system may be shifted between tiers according to changes in the workload mix and the number of jobs in the system [3]. It is clear that bottleneck identification should be one of the first steps in any performance study; any system upgrade which does not remove the bottleneck(s) will have no impact on the system performance at high loads [35].
A significant amount of research has been done trying to solve the problem of bottlenecks [3] [15] [27] [8] [22]. The work in [3] [15] [27] studies bottleneck identifi-cation for multi-class closed product-form queuing networks for an infinite population, while [8] and [22] study a large population.
The work in [54] uses the convex polytopes approach to identify the bottleneck in two different pools for their chosen configuration using two classes of jobs (gold and silver). The work uses the convex polytopes approach where the set of potential bottlenecks in a network with one thousand servers, two different server pools and fifty customer classes, can be computed in just a few seconds.
The work in [8] presents a technique for identifying the bottlenecks of multi-class queueing networks. This technique is based on the theory of convex polyhedra. The technique assumes that R = 1,2,3, ...,R are the set of customer classes and M = 1,2,3,...,M the set of stations in the proposed system. In such a situationLir =Vir×Sir,
where the station, class, average loading, visits to the station, and service requirements are represented byi,r,Lir,Vir,andSir respectively. This can be collected in the loading
L= 20 80 65 60 90 30 25 65 40 45 .
L21=65 and L22=60 are the loadings imposed on station 2 by class 1 and class 2
customers, respectively. The technique also assumes that theLiralways considers
pos-itive quantities, and Lis non-singular [8]. Figure2.5illustrates the projectionpro j(L) of matrixL, where the projection of station 3 for example can be described as follow;
[image:48.595.189.437.408.614.2]pro j(L3)=(0,30),(90,0),(0,0).
Figure 2.5: Service demands of matrix Land the set of its projections pro j(L) in the loadings space [8]
2.4 Bottleneck and Admission Control
[image:49.595.213.411.176.351.2]matrix is shown in Figure2.6.
Figure 2.6: Characteristic polytopeTLof the two-class loading matrixL[8]
It has been proved in [8], that all potential bottlenecks are to be found onϑT L(see Figure2.6).
Figure2.7shows example bottleneck identification results using convex polytopes for a chosen server pool configuration. We see that when the percentage of gold class jobs is less than 46.2%, the web server tier is the bottleneck; when it is between 46.2% and 61.5%, the system enters a crossover region, where the bottleneck changes; when the percentage of gold class jobs in pool 1 exceeds 61.5%, the application server tier becomes the bottleneck. Thus it is clear that bottleneck identification should be one of the first steps in any performance study; any system upgrade which does not remove the bottleneck(s) will have no impact on the system performance at high loads, see [35].
Figure 2.7: Bottleneck identification using convex polytopes [54]
than the average traffic and the server capacity is failed in serving the active customers [41].
System overloading can cause exceptionally long response times for requests or even errors, caused by the timing out of client requests and connections being dropped by the overloaded application. At the same time, the throughput of the system would decrease significantly [12]. A classic example of this was when the normally well-provisioned Amazon.com site suffered a forty minute downtime due to an overload during the popular holiday season in November 2000 (see [51]). Another example was the failure of the CNN.com website after the terrorist attacks on the United States on September 11, 2001 [16]. As a result of these (and other) case studies, and subsequent research, admission control is applied in order to deal with system overloading.
2.5 Fundamental Laws
the resources should be reassigned based on the importance of the customer, that is the customer who is about to buy from the sites should be given more priority than the customer who is still browsing through the sites. Added to this, customers’ priorities change dynamically based on the following aspects; i) the customer profiles, ii) the length of the current session length, iii) the amount of money accumulated in the cus-tomers shopping cart, and iv) the states visited in the customer behaviour model graph (CBMG) using three priority classes – high, medium, and low – where the customers transition between these three priority classes based on the previous proposed aspects. A simple admission control policy has been developed by [54]. It works by drop-ping less valuable requests when the response time exceeds a threshold, and therefore maintaining the number of concurrent jobs in the system at an appropriate level. This policy has been applied in this thesis in order to maintain the number of requests access to the proposed system.
The scheme that used in this thesis is based on assigning priorities to requests and ensuring that less important requests are rejected when the system is overloaded .
2.5
Fundamental Laws
De-mand Law, Little’s Law, and Response Time Law. In these definitions:
T: is the length of time the system is monitored;
B: is the length of time that the resource is busy;
C: is the total number of completed requests.
2.5.1
Utilization Law
The utilization U in a single resource i is defined as the fraction of the time that the resource is busy (Ui = Bi/T); the throughput X of the resource i can be obtained
after calculating the total number of completed jobsC during a specific period (Xi =
C/T). The average service time S is computed by dividing the length of time that the resource is busy (B) and the number of requests that are already completed by the selected resource (C). After computing the previous three parameters (the throughput, the utilization, and the service time), the first fundamental law, which is known as the
UtilizationLaw, can be computed by multiplying the throughput Xi of the resource i
and the average service time at that resource.
Ui = Xi×Si (2.1)
2.5 Fundamental Laws
2.5.2
Forced Flow Law
The ForceFlowLaw focuses on the average number of visits by a request to the re-source i, which is known as Vi, and the average number of requests that have been
completed within a given periodX0. Based on these two parameters the throughputXi
of the resourceican be obtained.
Xi = Vi×X0 (2.2)
Suppose that there 3,600 transactions were executed within half an hour and each of these transaction perform 2 I/O operations on average on the database server.
The utilization of the disk can be calculated based on the Force Flow Law and the Utilization Law respectively. First of all the Force Flow Law is applied in order to compute the total throughput, Xi = Vi × X0, where (X0 = 3600/1800 = 2t ps) and
Vi is given (it is equal to 2). Therefore by using the Force Flow Law, the throughput
(Xi = 2× 2 = 4t ps). After that the Utilization Law can be used to calculated the
utilization of the database disk as follows;Ui = Xi×Si =4×0.02= 0.08= 8%, where
each disk I/O takes on average 20 milliseconds to be executed.
2.5.3
Service Demand Law
The third fundamental law is the Service Demand LawDi, which is defined as the total
time that the request spends in service at resourcei. It is can be computed by using the system throughputViand the utilizationUi. The Service Demand Law is related to the
Force Flow Law and Utilization Law.
The Service Demand Law can be applied to compute the service demand of the data base disk that is used in the previous example, asDi =(Ui/X0)=(0.08/2)=0.04
sec.
2.5.4
Little’s Law
Little’s Law focuses on the relationship between the average time spent in the system
Rand the throughput of that systemX, which produces the average number of requests in the systemN.
N = X×R (2.4)
By applying Little’s Law, the average response time R can be calculated for the server that was monitored. For example, suppose that in 1 hour where there were 14,400 I/O operations executed during the monitoring period. As the throughput of the server X is equal to 4 request per second (14400/3600 =4), Little’s Law can be applied in order to compute the response time of the servers where the average number of active requests was found to be 1 request;R=N/X =1/4= 0.25.
2.5.5
Response Time Law
The simple relationship between the parameters – the average response time (R), the number of requests from the sources (M), the throughput of the requests processing (X0), and the average time elapsed between the reply from the request and the
sub-mission of the new requests by the same source (Z) – is called the Response Time Law.
2.5 Fundamental Laws
requests in the system (M), by adding the average number of requests being processed (N) and the average number of requests in the (think state) M, (M = N+ M). Based on this and also Little’s Law, M = N+ M = (R×X0)+(Z×X0) = (R+Z)× X0, the
Response Time Law can be obtained using the following equations;
R= (M/X0)−(Z). (2.5)
An example of using the Response Time Law is when the average think time of a web service needs to be computed. Consider a web service receives on average 7,200 requests each hour, from 200 different customers, and the average response time was measured as 2.5 seconds. In such situations and in order to calculate the average think time (Z), the Response Time Law can be applied here to compute such a parameter as follows; (Z = M/X0−R=(200/(7200/3600))−2.5= (200/2)−2.5 =97.5seconds).
This means that the average time since any response to a reply is received and a new request is submitted by the customer is equal to 97.5 seconds.
Table2.2summarises all the fundamental performance laws relevant to this thesis.
Table 2.2: Fundamental Performance Laws
Law Equation
Utilization Law Ui =Xi×Si
Forced Flow Law Xi =Vi×X0
Service Demand Law Di =Vi×Si =Ui/X0
Little’s Law N =X×R
2.6
Solving Multi-Class Closed Queueing Networks
Queuing networks can be used to model typical multi-tiered enterprise systems. In such situations, multi-class queuing networks are the ideal solution. A closed queuing network is applied in order to represent the enterprise system, as there is a limit to the number of simultaneous customers logged into the enterprise system at any one time [39]. The ability to compute performance metrics, identify potential bottlenecks and, importantly, investigate a wide variety of hypothetical scenarios, without running the actual system are considerable benefits of applying the analytical models. As a result, in this thesis the applications that have been modelling using these analytical models. One should thus envisage such a model running alongside a real system, where the model can react to parameter changes as the application is running (e.g. from monitoring tools or system logs) and making dynamic configuration decisions to optimise pre-defined performance metrics [54].
We use a multi-class closed queueing network to represent our system of interest, where C, WS, AS, and DS represent the Client, Web Server, Application Server, and Database Server respectively. The application is modelled using both -/M/1 first-come-first-served and -/M/m- first-come-first-served in each station, and it is assumed that servers are clustered at each tier.
2.6 Solving Multi-Class Closed Queueing Networks
2.6.1
Mean Value Analysis
The traditional technique that used in order to solve the queuing networks (QN) was developed to formulate a system of algebraic equations for the joint probability dis-tribution of the vector-valued system state by normalizing the product terms to form a proper probability distribution [43]. This process which is based on the normali-sation to product terms (e.g. mean queue sizes, meaning waiting times, utilizations, and throughputs) has been proved to be computationally limited in the case of net-works with closed routing chains. The mean value analysis (MVA) (it was developed by [43]) on the other hand is defined as a tool used to measure the mean performance measures in closed queueing models is based on the relation between the mean waiting time and the mean queue size of a system with one customer less. This mean-value equations, augmented by Little’s equation can be easily solved numerically with no need to compute normalization constants.
The developed algorithms (MVA) which is used in this work is simple and avoid overflow/underflow problems which may arise with the other algorithms [43]. Added to this the MVA is considerably faster in the case of multi-servers. The accuracy of the MVA results [54] and its simplicity compared with convolution algorithms [9] plus the previous reasons are the main reasons for using MVA in this thesis.
It is possible to solve the queuing networks using Approximation Mean Value Analysis (AMVA), which can solve the queueing network faster than MVA. The ac-curacy of such algorithm however has lots of concerns. Because of this, the MVA approach has been applied in this thesis to solve the multi-class closed queuing net-works.
The description of the system model that applied in this thesis based on the mean value analysis (MVA) is explained in details including its equations in Chapter 3 in section3.3.1.
Chapter 3
Impact of Server Allocation Time on
Dynamic Server Switching
3.1
Introduction
Internet hosting centres are often used for the cost-effective hosting of enterprise ap-plications. Typically, these enterprise applications employ a multi-tier architecture, which provides a clear separation of roles between the tiers. Commonly a multi-tier architecture consists of three tiers; a client-facing web tier, an application tier for the application logic and a data persistence tier that is usually comprised of a relational database management system (RDBMS). At each tier servers may be clustered to pro-vide high-availability and improve performance. An Internet hosting centre may host many multi-tier applications for its clients, each of which will have a separate service level agreement (SLA).
more profitable configuration [54].
There are several considerations in a dynamic resource allocation system including the decision interval, which is the time taken between evaluations of the policy, and the server reallocation time, which is the time taken to reallocate servers. In this chapter the impact of the time taken to reallocate servers between applications (switching time) on the system’s performance is considered alongside the different switching servers policies.
3.1.1
Chapter Contributions
The specific contributions of this chapter can be summarised as follows:
• Evaluating the effects of switching time on dynamic resource allocation in order to discover mechanisms for selecting system configurations which best match the switching interval;
• Examining the impact of the combination of switching policies and switching time on the total performance of the system used in this work;
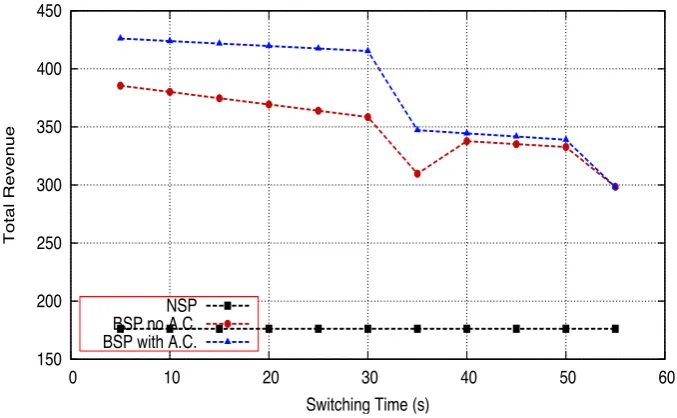
• Studying the impact of applying the admission control technique (see chapter2
section2.4for more details about the admission control technique) on the devel-oped system and to compare its performance with that obtained from applying no admission control.
3.2 Additional Related Work
Center web-server in Florida, and the rest of the workloads are generated from two synthetic workloads in order to ensure consistent and improved results.
3.1.2
Chapter Structure
This chapter is structured as follows; Section 3.2reviews the additional related work for this chapter, Section 3.3 describes the model of the system and the revenue func-tion used in order to compute the system performance. Secfunc-tions 3.4 and 3.5 present the description of the experimental setup and results respectively. Finally Section3.6
summarises the chapter.
3.2
Additional Related Work
Revenue maximisation is a key goal of many dynamic resource allocation systems. In [41] the authors use priority queues to offer differentiated services to different classes of request to optimise company revenue. Different priorities are assigned to differed requests based upon their contributions to the revenue.
The work in [31] focussed on maximising profits of best-effort requests when com-bined with requests requiring a specific quality of service (QoS) in a web farm. In [31] it is assumed that arrival rates of requests are static, whilst the arrival rates in our work are dynamic. The authors attempt in [21] to maximise revenue by partitioning servers into logical pools and switching servers at runtime. We consider switching in a multi-tier (3 tiers) environment, where the work in [21] just consider the switching on the first tier (Web Server).
system.
A number of researchers have studied bottleneck identification (e.g. [29]) for multi-class closed product-form queueing networks where there is no limit to growth. We employ the work found in [8] and [54] (as part of our collaboration with HP Labs, IBM and the UK National Business to Business Centre), where convex polytopes are used for bottleneck identification.
Admission control is applied in order to deal with system overloading. This scheme is based on assigning priorities to requests and ensuring that less important requests are rejected when the system is overloaded (see chapter2).
3.3
Modelling of Multi-tiered Internet Services and
Rev-enue Functions
3.3.1
The System Model
A multi-tiered Internet service can be modelled using a multi-class closed queuing network [57][44]. The closed queuing network model used here is illustrated in Figure
3.1, as commonly found, a multi-tier architecture consists of three servers (tiers); a client-facing web server (WS), which is responsible for receiving the requests from the client (C) and sending the response back, an application server (AS) used for the application logic, and a data-persistence tier that is usually comprised of a relational database management system (DS).
In a multi-class closed queuing network Sir represents the service time which is
defined as the average time spent by a class-rjob during a single visit to stationiand
vir symbolizes the visiting ratio of class-r jobs to station i (the notation used in the
system model is summarised in Table4.1).
3.3 Modelling of Multi-tiered Internet Services and Revenue Functions
Figure 3.1: A model of a typical configuration of a cluster based multi-tiered Internet service. C represents customer machines; WS, AS and DS represent web servers, application servers and database servers, respectively.
all visits to that resource during the execution of a transaction or request (Dir = Sir·
vir) [29]. The total population of the network (K) is defined as the total of the total
population of customers of classr(Kr):
K =
R X
r=1
Kr (3.1)
In modern enterprise systems, servers are often clustered together so both -/M/ 1-FCFS and -/M/m-FCFS in each station should be measured as a consequence of using a cluster of servers in each tier in our model. The response time of a class-r job at stationican be computed as follows [5],
Tir(k)= Dir h
1+PR
r=1Kir(k−1r) i
, mi=1
Dir mi
h
1+PR
r=1Kir(k−1r)
+Pmi−2
j=0 (mi− j−1)πi(j|k−1r) i
, mi>1
(3.2)
Table 3.1: Notation used in the system model Symbol Description
Sir Service time of job class-rat stationi
vir Visiting ratio of job class-rat stationi
N Number of service stations in QN
K Number of jobs in QN
R Number of job classes in QN
Kir Number of class-rjob at stationi
mi Number of servers at stationi φr Revenue of each class-rjob πi Marginal probability at centrei
T System response time
Dr Deadline for class-rjobs
Er Exit time for class-rjobs
Pr Probability that class-rjob stays
Xr Class-rthroughput before switching
Xr0 Class-rthroughput after switching
Ui Utilisation at stationi
ts Server switching time
td Switching decision interval time
• there arekjobs in the queuing network, fori=1, . . . ,Nandr=1, . . . ,R.
• (k- 1r)=(k1, . . . ,kr- 1, . . . ,KR) is the population vector with one class-rjob
less in the system.
The total system response time for the systemTi(k) is the sum of response time for
each tier:
Ti(k)= R X
r=1
Tir(k) (3.3)
For the case of multi-server nodes (mi > 1), it is necessary to compute the marginal
3.3 Modelling of Multi-tiered Internet Services and Revenue Functions
stationi, given that the network is in statek, is given by [5],
πi(j|k)=
1 j R X
r=1 vir Sir
Xr(k)πi(j−1|k−1r) (3.4)
The throughput of class-rjobs can be calculated using Little’s law [29] by dividing the total population of customers of class-r Kr by the sum of the visiting ratio vir
multiplied by the sum of the mean response time of each tier,
Xr(k)=
kr
PN
i=1virTir(k)
(3.5)
By applying the Little’s Law again with the Force Flow Law [29], the mean queue length Kir is obtained by multiplying the throughput Xr(k), the mean response time
Tir(k), and the visiting ratiovir.
Kir(k)=Xr(k)·Tir(k)·vir (3.6)
Where,Kir(0, 0 . . . , 0) =0,πi (0 — 0)=1, andπi (j— 0)=0. Then the system
response time, throughput and mean queue length in each tier can be calculated after
Kiterations.
In multi-class product form queuing networks, per-class station utilisation can be computed using the following equation [32],
Uir(k)=
krDir
P
iDir[1+Ki(k−1r)]
(3.7)
The total station utilisationUi(k) is the sum of per-class station utilisation, (Ui(k)= PR
r=1Uir(k)).
3.3.2
Modelling the Revenue Function
multi-tier applications for its clients, each of which will have separate service level agreements (SLAs) as introduced in Chapter 2. The SLA defines the level of service agreed between the client and the hosting centre and may include performance and availability targets, with penalties to be paid if such targets are not met. It is in the interests of the service hosting centre to ensure that its SLAs are met so that it can maximise its revenue, whilst ensuring that its resources are well utilised. In other words, the maximum revenue is obtained when a client request is met within the dead-line, while revenue obtained from requests which are not served within the deadline decrease linearly to zero, at which point the request exits the system.
Equation3.8 explains how the probability function of the request execution in the system (which is donated by P(Tr)) works in our model wherer, Dr, Tr, and Er
rep-resent the request and its deadline, response time, and dropped time from the system respectively.
P(Tr)=
1, Tr<Dr Tr−Dr
Er−Dr
, Dr≤Tr≤ Er
0, Tr>Er
(3.8)
The first part of Equation3.8states that the full revenue will be contributed by the request if it is processed before the deadline Dr. It is clear from the second part of the
equation that the gained revenue by the request is calculated by dividing the difference between the request response time Tr and its deadline Dr by the difference between
request dropped time from the system Er and its deadline Dr. The request gains no
revenue when its response time Tr is greater than the time at which the request exits
the systemEr.
With respect to the probability of the request execution, the lostVlossi and gained
![Figure 2.5: Service demands of matrix L and the set of its projections proj(L) in theloadings space [8]](https://thumb-us.123doks.com/thumbv2/123dok_us/9643770.466658/48.595.189.437.408.614/figure-service-demands-matrix-projections-proj-theloadings-space.webp)
![Figure 2.6: Characteristic polytope TL of the two-class loading matrix L [8]](https://thumb-us.123doks.com/thumbv2/123dok_us/9643770.466658/49.595.213.411.176.351/figure-characteristic-polytope-tl-class-loading-matrix-l.webp)