warwick.ac.uk/lib-publications
Original citation:
Kolotkov, D. Y., Nakariakov, V. M., Kupriyanova, E. G., Ratcliffe, Heather and Shibasaki, K..
(2015) Multi-mode quasi-periodic pulsations in a solar flare. Astronomy & Astrophysics, 574 .
A53.
Permanent WRAP URL:
http://wrap.warwick.ac.uk/78676
Copyright and reuse:
The Warwick Research Archive Portal (WRAP) makes this work by researchers of the
University of Warwick available open access under the following conditions. Copyright ©
and all moral rights to the version of the paper presented here belong to the individual
author(s) and/or other copyright owners. To the extent reasonable and practicable the
material made available in WRAP has been checked for eligibility before being made
available.
Copies of full items can be used for personal research or study, educational, or not-for-profit
purposes without prior permission or charge. Provided that the authors, title and full
bibliographic details are credited, a hyperlink and/or URL is given for the original metadata
page and the content is not changed in any way.
Publisher’s statement:
Reproduced with permission from Astronomy & Astrophysics, © ESO
Published version:
http://dx.doi.org/10.1051/0004-6361/201424988
A note on versions:
The version presented here may differ from the published version or, version of record, if
you wish to cite this item you are advised to consult the publisher’s version. Please see the
‘permanent WRAP URL’ above for details on accessing the published version and note that
access may require a subscription.
Astronomy&Astrophysicsmanuscript no. kolotkov_nakariakov_revision_2 cESO 2014 December 23, 2014
Multi-mode quasi-periodic pulsations in a solar flare
D. Y. Kolotkov
1, V. M. Nakariakov
1,2,3?, E. G. Kupriyanova
3, H. Ratcli
ff
e
1, and K. Shibasaki
41 Centre for Fusion, Space and Astrophysics, Department of Physics, University of Warwick, CV4 7AL, UK
e-mail:[email protected]
2 School of Space Research, Kyung Hee University, Yongin, 446-701, Gyeonggi, Korea
3 Central Astronomical Observatory at Pulkovo of the Russian Academy of Sciences, St Petersburg 196140, Russia 4 Nobeyama Solar Radio Observatory, Minamimaki, Minamisaku, Nagano 384-1305, Japan
Received December 23, 2014/Accepted dd mm yyyy
ABSTRACT
Context. Quasi-periodic pulsations (QPP) of the electromagnetic radiation emitted in solar and stellar flares are often detected in microwave, white light, X-ray, and gamma-ray bands. Mechanisms for QPP are intensively debated in the literature. Previous studies revealed that QPP may manifest non-linear, non-stationary and, perhaps, multi-modal processes operating in flares.
Aims.We study QPP of the microwave emission generated in an X3.2-class solar flare on 14 May, 2013, observed with the Nobeyama Radioheliograph (NoRH), aiming to reveal signatures of the non-linear, non-stationary, and multi-modal processes in the signal. Methods. The NoRH correlation signal obtained at the 17 GHz intensity has a clear QPP pattern. The signal was analysed with the Hilbert–Huang transform (HHT) that allows one to determine its instant amplitude and frequency, and their time variation.
Results.It was established that the QPP consists of at least three well-defined intrinsic modes, with the mean periods of 15, 45, and 100 seconds. All the modes have quasi-harmonic behaviour with different modulation patterns. The 100-second intrinsic mode is a decaying oscillation, with the decay time of 250 seconds. The 15-second intrinsic mode shows a similar behaviour, with the decay time of 90 seconds. The 45-s mode has a wave-train behaviour.
Conclusions.Dynamical properties of detected intrinsic modes indicate that the 100-s and 15-s modes are likely to be associated with fundamental kink and sausage modes of the flaring loop, respectively. The 100-s oscillation could also be caused by the fundamental longitudinal mode, while this interpretation requires the plasma temperature of about 30 million K and hence is not likely. The 45-s mode could be the second standing harmonics of the kink mode.
Key words. Sun: flares - Sun: oscillations - waves - Sun: corona - magnetohydrodynamics (MHD)
1. Introduction
Quasi-periodic pulsations (QPP) in solar and stellar flares are widely discussed in the literature (see, e.g. Nakariakov 2007; Za-itsev & Stepanov 2008; Nakariakov & Melnikov 2009; Nakari-akov et al. 2010b, for recent comprehensive reviews). These oscillatory variations of emission generated in energy releases are detected in the radio band, white light, soft and hard X-rays, and gamma-rays, and usually have periods from a fraction of a second to several minutes (e.g. Fleishman et al. 2008; Sych et al. 2009; Jakimiec & Tomczak 2010; Nakariakov et al. 2010a; Kupriyanova et al. 2010; Van Doorsselaere et al. 2011; Ning 2014). Flaring QPP are often observed in the emission associ-ated with non-thermal electrons, e.g. the gyrosynchrotron emis-sion in the microwave band and bremsstrahlung in the hard X-ray. However QPP are also detected in thermal emission, which is not associated with the presence of non-thermal charged par-ticles. For example, QPP are detected in the thermal free-free microwave emission of chromospheric plasma that was heated during a flare and filling in the flaring loop (e.g. Kupriyanova et al. 2014).
It is commonly accepted that QPP can be produced by sev-eral exclusive mechanisms, such as modulation of the non-thermal electron dynamics by magnetohydrodynamic (MHD) oscillations (Zaitsev & Stepanov 1982), periodic triggering of
? Corresponding author: V. M.
Nakari-akov, [email protected]
energy releases by external MHD waves or oscillations (Nakari-akov et al. 2006; Chen & Priest 2006), MHD flow over-stability (Ofman & Sui 2006), and oscillatory regimes of magnetic re-connection (e.g. Kliem et al. 2000; Murray et al. 2009). Shorter-period QPPs, in the sub-second Shorter-period range, could be associ-ated with wave-particle interaction (Aschwanden 1987). Well-pronounced QPPs have also been detected in flares on Sun-type stars and dwarfs (see e.g. Mathioudakis et al. 2003; Mitra-Kraev et al. 2005; Anfinogentov et al. 2013, and references therein). The need to explain the appearance of QPP puts an important constraint on any model of a flare. Revealing the nature of QPP is necessary for full understanding of the mechanisms operating in solar and stellar flares.
2003; Kupriyanova et al. 2010), but it also has some disadvan-tages generated by the limited length of the wavelet mother func-tion. Another method available for processing non-stationary data is the Wigner–Ville analysis. It has been applied for ex-amination of solar QPPs e.g. in Khodachenko et al. (2011); Kislyakov et al. (2006). By definition, the Wigner–Ville anal-ysis is the Fourier transform of the central covariance function, hence, it has all of the constraints described above too. Most importantly, however all these methods are based on the decom-position of the signal in a set of prescribed harmonic functions or their wavelets. Thus, these methods cannot address the non-linear, anharmonic nature of QPP. In particular, there is a ques-tion whether the observed symmetric triangular shape of the os-cillations indicates the non-linear nature of the QPP, or it appears because of a superposition of several harmonic signals of diff er-ent frequencies. If the anharmonic QPP is a manifestation of a non-linear oscillation it may be connected to non-linear quasi-periodic process (e.g. Kliem et al. 2000; Murray et al. 2009) or to the non-oscillatory “dripping” mechanism (Nakariakov et al. 2010b). On the other hand, if the observed anharmonicity ap-pears because of a superposition of several independent harmon-ics, it can be created by a co-existence of different linear oscil-lations, e.g. different longitudinal, radial, or azimuthal spatial MHD harmonics of the flaring plasma configuration (e.g. Inglis & Nakariakov 2009; Kupriyanova et al. 2013).
[image:3.595.311.555.56.298.2]In this paper we present the analysis of a solar flare with the Hilbert–Huang transform (HHT) technique. This technique combines the empirical mode decomposition (EMD) method and the Hilbert transform analysis (Huang et al. 1998; Wu & Huang 2009). The technique of HHT was developed essentially for analysing non-linear and non-stationary signals. The HHT and EMD have already been used in solar physics. In particular, fundamental timescales, such as the 22-year cycle and quasi-biennial oscillations of the solar magnetic field variability were identified with EMD in Vecchio et al. (2012). Terradas et al. (2004) applied EMD to obtain detailed two-dimensional infor-mation about propagating and standing waves in a coronal ac-tive region. Long-period oscillations of the gyroresonant emis-sion from sunspot atmospheres with periods in the range of sev-eral tens of minutes were found in Chorley et al. (2010), and the presence of the oscillations was confirmed by EMD. Komm et al. (2001) used the HHT analysis to determine whether the rotation rate in the convection zone shows any other systematic temporal variation besides the so-called torsional oscillation pat-tern in the upper convection zone, a new long-term period of six years was detected. Long-term sunspot records were also analysed with EMD, revealing a set of periodic components of 1.3-1.4 years, quasi-biennial oscillations, and the 11-year solar cycle component, as well as the 22-year cycle of solar activity (Li et al. 2007). Intrinsic modes were found in the north-south sunspot time series (Zolotova & Ponyavin 2007). Acceleration and deceleration trends in the temporal variations of the rota-tional cycle length of the Sun were established (Li et al. 2011). The first successful use of EMD in the analysis of QPPs in a solar flare was made in Nakariakov et al. (2010b), where the technique was applied to the extraction of the high-frequency noise and low-frequency trend from the initial data set. Also, in solar data analysis, a method for studying a stationary weakly non-linear oscillatory processes, similar to HHT was developed. It is a so-called Krylov–Bogolyubov’s “averaging method”, based on the expansion of the original signal on a set of harmonic func-tions with time-dependent amplitude and frequency (Nagovitsyn 1997). This tool was applied for analysing weakly non-linear, non-stationary large timescale solar cyclicity.
Fig. 1. Spatial distribution of the radio emission intensity (R+L) in the 17 GHz band obtained with the Nobeyama Radioheliograph for an X3.2-class solar flare on 14 May, 2013 at 01:06 UT. The darker colours indicate the regions of enhanced emission intensity. White dashed con-tours show the levels 0.9, 0.7, 0.59, 0.5, 0.3, 0.1, and 0.02 of maximal brightness.
The paper is structured as follows: the observations are de-scribed in Section 2; a short description of HHT is given in Sec-tion 3; the details of data analysis are presented in Sec. 4; and a discussion of results is given in Section 5.
2. Observations
The examined QPP occurred in an X3.2-class solar flare on 14 May, 2013 that was situated on the north-east limb of the Sun at the position N08E77 in the active region NOAA 11748. The flare had a duration of two hours (23:59-02:00 UT) with the peak time at 01:11 UT. The impulsive phase lasted approximately from 01:00 UT to 01:30 UT. The event was observed with the Nobeyama Radioheliograph (NoRH, see Nakajima et al. 1994) and Radio Polarimeters (NoRP, see Nakajima et al. 1985). The maximum radio emission reached 1,985 sfu at 17 GHz, with the maximum radio brightness of 1.3×10⁸K. In the impulsive phase (approximately since 01:05 UT), observations in the radio band show quasi-periodic pulsations that are most pronounced in the 17 GHz band. The impulsive phase of this flare was not ob-served by Reuven Ramaty High Energy Solar Spectroscopic Im-ager (RHESSI).
south-Kolotkov et al.: Multimode quasi-periodic pulsations in a solar flare
ern footpoints, considering the plane of the loop to be parallel to the image plane.
In the EUV band, in this active region we detected with SDO/AIA rapidly-decaying kink oscillations of coronal loops, with periods of several minutes. These kink oscillation are seen at 01:11 UT, after the impulsive phase of the flare, when the os-cillations discussed in this paper have already not ceased. Kink oscillations of neighbouring loops were excited simultaneously, but got rapidly out of phase. In the following we do not consider these oscillations in detail.
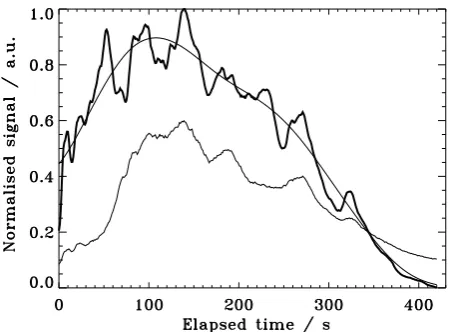
In Fig. 2 the correlation curve obtained with the Nobeyama Radioheliograph at 17 GHz, and the integrated R+L intensity (the total flux at 17 GHz) obtained with Nobeyama Radiopo-larimeters, are shown. The correlation curve gives the time vari-ation of the averaged values of correlvari-ation coefficients of antenna pairs, after removing the short base-line pairs, of NoRH. The correlation curve magnifies the strong microwave signal com-ing from small-scale sources on the Sun, with sizes up to 2400.
For the study of QPP in the discussed flare, the NoRH correla-tion curve is more suitable than the imaging data cube, as the flare site is located near the limb. Signals of these flares are af-fected both by instrumental phase effects (e.g. the jitter) and by background emission from the Sun, the Earth’s atmosphere, and other objects. This corrupts the imaging information. Hence, it is non-trivial to synthesise a reliable imaging data cube for this flare, and we did not do it in this study. The NoRP total flux signal is obtained by integrating over the whole disk of the Sun. Therefore the total flux signal contains the contribution of large scale sources together with the fine sources of interest. Thus, for the purposes of our study, the integral signal is less suitable in comparison with the correlation amplitude curve.
The impulsive phase of the flare, presented in Fig. 2, corre-sponds to the appearance and subsequent development of a com-pact radio source near the northern footpoint of the extended loop-like structure, shown in Fig. 1. We associate this source with a magnetic loop with a strong magnetic field, emitting ra-diation primarily by the gyrosynchrotron mechanism. Accord-ing to NoRP data, the power spectrum of the radiation looks like non-monotonic function with the peak frequency between 9.4 GHz and 17 GHz. Therefore the combination of the de-scribed above properties, such as the presence of the peak fre-quency in the radiation power spectrum and sufficiently high ra-dio brightness of the signal, indicates the gyrosynchrotron nature of the signal1. The degree of polarisation of the studied signal at 17 GHz is about 6%.
Both the NoRH correlation curve and NoRP total flux signals are found to correlate well with each other. The cross-correlation coefficient is equal to 0.8 at the zero time lag. In both these signals the QPP are clearly pronounced and have a symmetric triangular shape. The instant period of pulsations, determined by eye, is about 40 s. It varies approximately from 20 to 100 seconds during the flare development. The clear non-stationarity and anharmonicity of the QPP suggests the application of the HHT method to their analysis.
3. Empirical mode decomposition and Hilbert transform
The main idea of the combination of the empirical mode de-composition (EMD) with the Hilbert transform, known as HHT (Huang et al. 1998), is the decomposition of the initial data
1 See paragraph 4.6.7. of the NoRH manual, http://solar.nro.
[image:4.595.321.547.66.232.2]nao.ac.jp/norh/doc/manuale.pdf
Fig. 2. Upper thick line: Correlation curve obtained with the Nobeyama Radioheliograph at 17 GHz. Upper thin line: the trend of the signal defined as the last EMD mode. Bottom thin line: Integrated intensity R+L at 17 GHz, obtained with the Nobeyama Radiopolarime-ter. The horizontal axis shows the time elapsed since 01:05:22 UT. Both the signals are normalised to their highest values. The integrated inten-sity signal is shifted downward for a better separation of the curves.
set into a number of intrinsic mode functions (IMF). In other words the initial signal is decomposed over the basis functions derived from the data. The subsequent Hilbert transformation of the identified IMFs shows the frequency-time distribution, des-ignated as the Hilbert power spectrum. This approach is not based upon the prescribed choice of the basis functions, is self-adaptive, and hence is suitable to analysing non-stationary and non-linear signals, such as QPPs in flares.
The first step of that scheme, EMD of a given signal of in-terest, is made iteratively with a so-called sifting process. The method works as follows. After having identified all local ex-trema in the signal of interest, upper and lower envelopes of the signal are defined. The mean of the upper and lower envelopes is subtracted from the signal. This procedure must be repeated several times until the number of extrema differs from the num-ber of zero crossings by not more than 1 and a true IMF is hence reached. An additional stopping criterion is introduced by lim-iting the standard deviation calculated from consecutive sifting results to a value between about 0.2 and 0.3. The first IMF con-tains the shortest timescale component of the signal. Then this IMF is subtracted from the data set, and the procedure repeats, treating the residue as the input signal. This process is repeated until the last IMF becomes monotonic. For detailed description of the EMD technique see, e.g. Huang et al. (1998).
the combined signal is decomposed via EMD and the results are saved. In any individual trial, the added noise may lead to greater mode-mixing. However, the noise in separate trials is indepen-dent. Thus, if the procedure is repeated many times and the re-sults are averaged, the effect of the added noise is cancelled, and the results approach the real set of IMFs. We disregard the occa-sional trials in which the number of the IMF found in the signals with the added noise becomes different from the number of IMF found in the original signal.
After obtaining the set of IMFs the Hilbert transform is ap-plied to each of the IMF to calculate the power and the instant frequency as a function of time for each IMF. The Hilbert power spectrum, showing the power as a function of the frequency and time, is then calculated by combining the results of all IMFs or a partial set of them.
4. Analysis
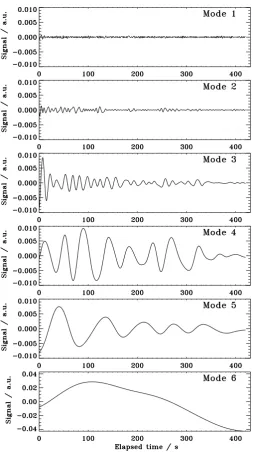
Results of applying EEMD to the NoRH correlation signal shown in Fig. 2 are presented in Fig. 3. We took the white noise amplitude as 0.2 of the standard deviation of the original signal, according to Wu & Huang (2009). We found the results obtained with slightly lower or higher amplitudes of white noise, for ex-ample 0.15 and 0.3, to be similar. The decomposition gives six intrinsic modes. The first two modes, 1 and 2, are likely to be high-frequency noise. These signals are too weak, and we ne-glect them in the following analysis. The last mode, 6, displays an aperiodic trend of the original signal shown in Fig. 2. Thus, modes 3, 4, 5 are found to be of interest for further investigation. Mode 5 has a well-pronounced decaying oscillatory pattern with an apparent frequency modulation. The instant period of the oscillation decreases with time from 95 to 61 seconds. The decrease in the period is accompanied by the decrease in the amplitude. The dependence of the amplitude on the period was fitted by an empirical linear law,Amplitude/max(Amplitude)=
a ×Period[s]−b form, where a = 2.9×10⁻⁴ s−1, and b =
1.45×10⁻². The damping time, 250 seconds, equals three instant
periods of the oscillation.
The amplitude of mode 3 shows similar behaviour. The aver-age period is about 15 seconds. The damping time is 90 seconds, which is about six periods of the oscillation. Also, the amplitude of mode 3 has a noisy modulation. The behaviour of mode 4 is different from modes 3 and 5; it can be described as a sequence of oscillation trains with the average period about 45 seconds.
The upper panel of Fig. 4 shows the Hilbert spectrum of the set of intrinsic modes 3, 4, and 5. It is evident that the modes occupy three distinct spectral bands. The values of instant fre-quencies of different modes are seen to vary around a certain mean value. More specifically, the frequency of mode 3 varies about 0.065 Hz (15 seconds). The instant frequency of mode 4 is localised in the vicinity of 0.022 Hz (45 seconds). Mode 5 has the average instant frequency about 0.01 Hz (100 seconds). The scattering of the instant frequency of mode 3 is an intrinsic feature of HHT of noisy signals (see, e.g. Huang et al. 1998) and is similar to the appearance of side lobes in e.g. periodograms of noisy signals. The apparent small split of the lowest-frequency curve into two curves is an artefact. Each instant of time there is a single value of the frequency in this mode, which jumps between two extreme, sufficiently close values in certain time intervals.
[image:5.595.305.559.57.510.2]Composing the signal as the sum of modes 3, 4, 5, we made the Fourier power spectrum of the composed signal (see Fig. 4 bottom panel). It also gives well-pronounced peaks approxi-mately at 0.067 Hz, 0.022 Hz and 0.01 Hz, which is in a good
Fig. 3. Intrinsic mode functions detected with the ensemble empirical mode decomposition (EEMD) technique in the NoRH correlation sig-nal, presented in Fig. 2. All modes are normalised to the highest value of the correlation signal. The elapsed time on the horizontal axis starts at 01:05:22 UT.
agreement with the results obtained by HHT. Thus, the EMD technique works as an adaptive filter for subtracting the noise and trend from the initial data set. The secondary peaks at 0.013 and 0.017 Hz, and 0.029 and 0.033 Hz are attributed to the am-plitude modulation of the 45-s mode, evident in Fig. 3.
Kolotkov et al.: Multimode quasi-periodic pulsations in a solar flare
Fig. 4. Upper panel: Hilbert spectrum (the instant frequency-time dis-tribution) of empirically determined intrinsic modes 3, 4, 5. Darker pix-els correspond to higher instant spectral power,Bottom panel: Fourier power spectrum of the signal obtained as the sum of intrinsic modes 3, 4, 5. The Fourier power is normalised to the highest value. The elapsed time on the horizontal axis starts at 01:05:22 UT. The narrow-band Gaussian filters at 0.005–0.015 Hz, 0.015–0.03 Hz, 0.04–0.08 Hz are shown by the dotted curves.
the 45-s mode with its four sidelobes, determined by EMD, con-firms its amplitude modulation.
5. Discussion and conclusions
We applied the HHT technique to the analyses of anharmonic quasi-periodic pulsations in a microwave correlation signal of a solar flare, obtained with the Nobeyama Radioheliograph at 17 GHz. The analysed signal has a pronounced symmetric-triangular quasi-periodic pattern. The method of ensemble em-pirical mode decomposition revealed that the signal consists of three intrinsic quasi-periodic modes. The Hilbert transforma-tion showed that instant frequencies of these intrinsic modes are localised in certain spectral intervals, with the mean periods of about 15, 45, and 100 seconds.
[image:6.595.40.286.56.340.2]The longest-period, 100-s intrinsic mode is a decaying oscil-lation, with the decay time of 250 seconds. The shortest-period, 15-s intrinsic mode shows a similar behaviour, with the decay time of 90 seconds. The quality of the 15-s mode is higher than of the 100-s mode, as the ratio of the decay time to the mean period in this mode is six. These decaying oscillations are often seen in light curves of solar and stellar flares (see e.g. Wang 2011; Anfinogentov et al. 2013), including the microwave band (Kim et al. 2012). Those oscillations have been interpreted as standing linear slow magnetoacoustic waves. Damping of these waves is associated with thermal conduction (e.g. Ofman & Wang 2002). Our finding shows that the quality of the 15-s
Fig. 5. Empirical intrinsic modes 3, 4, 5 (solid lines) and the narrow-band signals obtained from the Fourier power spectrum (dashed lines) (see Fig. 4). All lines are normalised to the highest value of the NoRH correlation signal (see Fig. 2). The elapsed time on the horizontal axis starts at 01:05:22 UT.
mode is higher than that of the 100-s mode. The decrease in the efficiency of the damping with increase of the frequency is con-sistent with the interpretation of the damping in terms of thermal conduction (e.g. De Moortel & Hood 2003). However, the damp-ing oscillations detected by our analysis also have properties that make them different from the standing slow waves revealed be-fore. The decaying oscillations we detected have periods that are much shorter (15 and 100 seconds) than the known examples of standing slow magnetoacoustic oscillations (at least several min-utes or longer, see Wang 2011). Perhaps the short periods of the observed oscillations can be attributed to the short length of the oscillating loop. However, even for the 100-s mode the phase speed of a fundamental standing mode, estimated as the ratio of the double length of the oscillating loop, 2×40 Mm and the os-cillation period, 100 s, is 800 km/s. For this phase speed to be the sound speed, the plasma temperature should be about 30 MK. A plasma with such a temperature should be filling in the flaring loop for the duration of the oscillation, about 5 min. For the 15-s mode, with the phase speed of 5.3 Mm/s, to be a standing acous-tic oscillation, the plasma temperature should be unrealisacous-tically much higher, 1,230 MK. Therefore, if the detected 100-s and 15-s periodicitie15-s are cau15-sed by 15-standing acou15-stic o15-scillation15-s, their wavelength should be much shorter than the length of the ob-served microwave loop, giving lower phase speeds. Otherwise it would require an unrealistically high temperature. Thus, we do not disregard this interpretation entirely for the 100-s mode, but do not consider it as the most favourable one.
Another MHD mode of coronal plasma structures is the standing kink oscillation (see De Moortel & Nakariakov 2012, for recent review). The phase speed of the kink mode is deter-mined by the kink speed,CK≈21/2CA0, whereCA0is the Alfvén
speed of the 15-s mode, 5.3 Mm/s, is possibly too high for this mode too. An option is that the 15-s mode is a higher longitu-dinal harmonics of the kink mode (e.g. Andries et al. 2009, for the discussion of the higher harmonics of the kink mode). But, in this case it should be the 6th or 7th harmonics, provided the 100-s mode is the fundamental mode, and the question is why only the fundamental and the 6th or 7th harmonics are excited in the loop.
A more realistic assumption is that the 15-s mode is of a dif-ferent azimuthal symmetry, e.g. the sausage mode. In favour of this interpretation is that the previous identification of the funda-mental sausage modes of flaring loops had a similar period, e.g. 16 s (Nakariakov et al. 2003). In the leaky regime characterised by the decay of the wave amplitude, the period is prescribed by the transverse travel time at the internal fast magnetoacoustic speed,Psaus≈2.62a/CA0, whereais the width of the loop (e.g.
Nakariakov et al. 2012). Assuming that the 100-s oscillations is caused by the fundamental kink mode and the 15-s oscillation is the fundamental sausage mode of the same loop, we use the expressions given above to find thatL/a≈12, whoch is consis-tent by the order of magnitude with the observed aspect ratio (see Fig. 1). The ratio of the average periods of long-period and short-period modes we estimated is consistent with the result found by Van Doorsselaere et al. (2011).
The 45-s mode is found to have a wave-train behaviour. However, as we see only two trains of oscillations, the latter conclusion does not seem to be sufficiently justified. The na-ture of this oscillation is not clear, while by its period it can be the second harmonics of the kink mode
The decrease in the amplitude of the 100-s oscillation is ac-companied by the decrease in the period, from 100 to 61 sec-onds. This behaviour has been found in other physical systems and may be associated with super-non-linear oscillations: a fi-nite amplitude regime of a dynamical system with the period determined by its amplitude (Dubinov et al. 2012a,b). This phe-nomenon has not been studied in the context of flaring QPP yet, and needs to be addressed in a future study.
Thus, the HHT analysis reveals that the apparent anharmonic shape of the QPP in the analysed flare results from a superpo-sition of three intrinsic modes. The simultaneous presence of several different modes has been found in QPPs before (e.g. In-glis & Nakariakov 2009; Kupriyanova et al. 2013). However those studies mainly emphasised the superposition of harmonic modes, while our study demonstrated that QPP may be a super-position of decaying or modulated modes.
Our study demonstrated that the HHT analysis is a useful tool that can provide us with unique information about quasi-oscillatory processes in solar and stellar flares. This information may be important for revealing physical processes operating in flares.
Acknowledgements. This work is supported by the Marie Curie
PIRSES-GA-2011-295272RadioSunproject (DYK, VMN, EGK), the Royal Society – Daiwa Anglo Japanese Foundation International Exchanges Scheme (DYK, VMN, KS); the European Research Council research project 321141 SeismoSun(VMN, HR), STFC consolidated grant ST/L000733/1, BK21 plus program through the National Research Foundation funded by the Ministry of Education of Korea (VMN); and the Russian Foundation for Basic Research projects 12-02-00616 and 14-02-00924 (EGK), and 13-02-00044 (EGK, VMN).
References
Andries, J., van Doorsselaere, T., Roberts, B., et al. 2009, Space Sci. Rev., 149, 3
Anfinogentov, S., Nakariakov, V. M., Mathioudakis, M., Van Doorsselaere, T., & Kowalski, A. F. 2013, ApJ, 773, 156
Aschwanden, M. J. 1987, Sol. Phys., 111, 113 Chen, P. F. & Priest, E. R. 2006, Sol. Phys., 238, 313
Chorley, N., Hnat, B., Nakariakov, V. M., Inglis, A. R., & Bakunina, I. A. 2010, A&A, 513, A27
De Moortel, I. & Hood, A. W. 2003, A&A, 408, 755
De Moortel, I. & Nakariakov, V. M. 2012, Royal Society of London Philosophi-cal Transactions Series A, 370, 3193
Dubinov, A. E., Kolotkov, D. Y., & Sazonkin, M. A. 2012a, Journal of Technical Physics, 57, 585
Dubinov, A. E., Kolotkov, D. Y., & Sazonkin, M. A. 2012b, Plasma Physics Reports, 38, 833
Fleishman, G. D., Bastian, T. S., & Gary, D. E. 2008, ApJ, 684, 1433
Huang, N. E., Shen, Z., Long, S. R., et al. 1998, Royal Society of London Pro-ceedings Series A, 454, 903
Inglis, A. R. & Nakariakov, V. M. 2009, A&A, 493, 259 Jakimiec, J. & Tomczak, M. 2010, Sol. Phys., 261, 233
Khodachenko, M. L., Kislyakova, K. G., Zaqarashvili, T. V., et al. 2011, A&A, 525, A105
Kim, S., Nakariakov, V. M., & Shibasaki, K. 2012, ApJ, 756, L36
Kislyakov, A. G., Zaitsev, V. V., Stepanov, A. V., & Urpo, S. 2006, Sol. Phys., 233, 89
Kliem, B., Karlický, M., & Benz, A. O. 2000, A&A, 360, 715 Komm, R. W., Hill, F., & Howe, R. 2001, ApJ, 558, 428
Kupriyanova, E. G., Melnikov, V. F., Nakariakov, V. M., & Shibasaki, K. 2010, Sol. Phys., 267, 329
Kupriyanova, E. G., Melnikov, V. F., Puzynya, V. M., Shibasaki, K., & Ji, H. S. 2014, Astronomy Reports, 58, 573
Kupriyanova, E. G., Melnikov, V. F., & Shibasaki, K. 2013, Sol. Phys., 284, 559 Li, K. J., Feng, W., Xu, J. C., et al. 2012, ApJ, 747, 135
Li, K. J., Shi, X. J., Liang, H. F., et al. 2011, ApJ, 730, 49
Li, Q., Wu, J., Xu, Z.-w., & Wu, J. 2007, Chinese Astron. Astrophys., 31, 261 Mathioudakis, M., Seiradakis, J. H., Williams, D. R., et al. 2003, A&A, 403,
1101
Mitra-Kraev, U., Harra, L. K., Williams, D. R., & Kraev, E. 2005, A&A, 436, 1041
Murray, M. J., van Driel-Gesztelyi, L., & Baker, D. 2009, A&A, 494, 329 Nagovitsyn, Y. A. 1997, Astronomy Letters, 23, 742
Nakajima, H., Nishio, M., Enome, S., et al. 1994, IEEE Proceedings, 82, 705 Nakajima, H., Sekiguchi, H., Sawa, M., Kai, K., & Kawashima, S. 1985, PASJ,
37, 163
Nakariakov, V. M. 2007, Advances in Space Research, 39, 1804
Nakariakov, V. M., Foullon, C., Myagkova, I. N., & Inglis, A. R. 2010a, ApJ, 708, L47
Nakariakov, V. M., Foullon, C., Verwichte, E., & Young, N. P. 2006, A&A, 452, 343
Nakariakov, V. M., Hornsey, C., & Melnikov, V. F. 2012, ApJ, 761, 134 Nakariakov, V. M., Inglis, A. R., Zimovets, I. V., et al. 2010b, Plasma Physics
and Controlled Fusion, 52, 124009
Nakariakov, V. M. & Melnikov, V. F. 2009, Space Sci. Rev., 149, 119 Nakariakov, V. M., Melnikov, V. F., & Reznikova, V. E. 2003, A&A, 412, L7 Ning, Z. 2014, Sol. Phys., 289, 1239
Ofman, L. & Sui, L. 2006, ApJ, 644, L149 Ofman, L. & Wang, T. 2002, ApJ, 580, L85
Sych, R., Nakariakov, V. M., Karlicky, M., & Anfinogentov, S. 2009, A&A, 505, 791
Terradas, J., Oliver, R., & Ballester, J. L. 2004, ApJ, 614, 435
Van Doorsselaere, T., De Groof, A., Zender, J., Berghmans, D., & Goossens, M. 2011, ApJ, 740, 90
Vecchio, A., Laurenza, M., Meduri, D., Carbone, V., & Storini, M. 2012, ApJ, 749, 27
Wang, T. 2011, Space Sci. Rev., 158, 397