S O F T W A R E
Open Access
BABAR: an R package to simplify the
normalisation of common reference design
microarray-based transcriptomic datasets
Mark J Alston
1,4*, John Seers
2, Jay CD Hinton
1,5, Sacha Lucchini
3Abstract
Background:The development of DNA microarrays has facilitated the generation of hundreds of thousands of transcriptomic datasets. The use of a common reference microarray design allows existing transcriptomic data to be readily compared and re-analysed in the light of new data, and the combination of this design with large datasets is ideal for‘systems’-level analyses. One issue is that these datasets are typically collected over many years and may be heterogeneous in nature, containing different microarray file formats and gene array layouts, dye-swaps, and showing varying scales of log2- ratios of expression between microarrays. Excellent software exists for the normalisation and analysis of microarray data but many data have yet to be analysed as existing methods struggle with heterogeneous datasets; options include normalising microarrays on an individual or experimental group basis. Our solution was to develop the Batch Anti-Banana Algorithm in R (BABAR) algorithm and software package which uses cyclic loess to normalise across the complete dataset. We have already usedBABAR to analyse the function ofSalmonellagenes involved in the process of infection of mammalian cells.
Results:The only input required byBABARis unprocessed GenePix or BlueFuse microarray data files. BABAR provides a combination of‘within’ and‘between’microarray normalisation steps and diagnostic boxplots. When applied to a real heterogeneous dataset,BABAR normalised the dataset to produce a comparable scaling between the microarrays, with the microarray data in excellent agreement with RT-PCR analysis. When applied to a real non-heterogeneous dataset and a simulated dataset,BABAR’s performance in identifying differentially expressed genes showed some benefits over standard techniques.
Conclusions:BABARis an easy-to-use software tool, simplifying the simultaneous normalisation of heterogeneous two-colour common reference design cDNA microarray-based transcriptomic datasets. We showBABARtransforms real and simulated datasets to allow for the correct interpretation of these data, and is the ideal tool to facilitate the identification of differentially expressed genes or network inference analysis from transcriptomic datasets.
Background
DNA microarrays enable the simultaneous measurement of expression levels for many thousands of genes at a given instant in any biological system, revealing the expression state of those features as determined by sta-tistical significance inference [1-3]. By taking many such snapshots over a number of experimental conditions and applying the appropriate analyses (see [4] for an overview), groups of genes with similar expression pro-files can be detected to suggest the function or
regulation of uncharacterised genes. Analysis of such transcriptomic datasets, or compendia [5,6], allows the expression patterns for particular genes to be compared, offering an ideal way to reveal the higher levels of orga-nisation in an organism by a‘systems’-level approach.
Dual experimental approaches have been used for two-colour transcriptomic microarrays: one makes a direct comparison between complementary DNA (cDNA) samples (two-channel experiments), and the other uses a common reference in one channel of every microarray (one-channel experiments) [7]. BABARwas developed to improve the value of data generated by the common reference design which uses the same genomic
* Correspondence: [email protected]
1Foodborne Bacterial Pathogens, Institute of Food Research, Norwich
Research Park, Norwich, NR4 7UA, UK
DNA (gDNA), or pooled RNA, hybridized to every microarray [8]. The power of this design is that it enables the easy comparison between, or within, micro-array datasets [9]. The investigator can assemble any combination of data derived from microarrays, making it possible to test new hypotheses. The common refer-ence design is also ideal for‘systems’-level analyses. For example, the context likelihood of relatedness (CLR) algorithm infers prokaryotic transcriptional regulatory networks from this type of compendium of gene expres-sion profiles, or other one-channel designs such as Affy-metrix arrays, collected under various experimental conditions [10].
For analytical purposes, we consider common refer-ence experiments to be of a pseudo-direct design such that if the intensity values for a pair of common refer-ence microarrays are plotted on a graph of condition 1 (Red1/Green1; R1/G1) versus condition 2 (R2/G2), where Gx is the reference channel, then non-differen-tially expressed genes should map onto a line of slope (R1/G1)/(R2/G2) ~ 1. However, experimental data are usually more complex: the data points can diverge from the ideal line in an intensity-dependent manner resulting in a‘banana-shaped’distribution with a non-zero intercept, with non-differentially expressed genes showing considerable scattering around this line and the scatter patterns varying between microarray slides. The intensity relationship between the microarrays is best seen in an MA-plot [11], which is a scatterplot of the intensity log-ratio M = log2 {(R1/G1)/(R2/G2)} ver-sus the mean log intensity A = log2 √{(R1/G1) × (R2/ G2)}. The focus of the MA-plot is on the symmetrical distribution about the line where M = 0 (i.e. equal expression), but such a plot for a pair of common reference microarrays can show little symmetry due to intensity and spatial variation. Such systematic bias arises from several factors: background effects on the microarray, experimental variation, sample preparation and the fluorescent labelling and printing processes. One example of experimental variation that is of parti-cular relevance to this study involves microarrays that utilize RNA isolated from a challenging environment, such as from bacteria within a mammalian cell. The amount of RNA extracted in such cases is typically small (< 5 μg) [12,13] and the resulting labelled cDNA can give rise to considerable variation between repli-cate spots on different microarrays. This phenomenon manifests itself as low intensity signals, a high back-ground, or both, and results in a reduction of the dis-tribution of log-ratios of expression. A likely reason for the aberrant labelling is the presence of contaminants associated with the RNA sample (e.g. DNA, carbohy-drates or proteins) that can inhibit enzymatic reactions and lead to poor Cy-dye incorporation [14].
Normalisation is the process of removing systematic bias from microarray data. This is achieved by trans-forming the data values as prescribed by a given algo-rithm applied ‘within’ microarrays (applied to each microarray) or ‘between’ microarrays. Two-colour microarrays are often normalised by applying Locally Estimated Scatterplot Smoothing (loess) to the MA-plot for an entire microarray (global loess) or to the MA-plot for each print-tip group of DNA elements upon a given microarray (print-tip loess). In both cases the algorithm fits a line to the local neighbourhood of each data point and combines these lines to generate a loess curve that follows the central trend across the data. Given the assumption that the majority of genes do not respond to a given experimental condition and should therefore be centred about M = 0, the loess curve is used to adjust the values for each feature accordingly. However, the loess normalisation assumes that the M-value is inde-pendent of the A-value. This is not true for common reference microarrays because while the signal for the cDNA channel can vary greatly for each feature, the sig-nal for the gDNA reference channel is more or less con-stantly high. This results in small M-values corresponding to small A-values, and large M-values corresponding to large A-values; hence the loess cannot be applied toindividualcommon reference microarrays.
Therefore, a useful modification of the loess is the cyclic loess normalisation which performs the loess on each unique pair of microarrays in a dataset in order to form the normalising relation [15]. It has been applied to Affymetrix datasets but in principle is equally applic-able to pairs of spotted cDNA microarray datasets [15,16]. Such a ‘complete data method’ [15] appears ideal for simultaneously normalising data across large, heterogeneous common reference datasets, where indivi-dual microarrays can show very different spreads and distributions of M-values.
However, consider the example of a pair of microar-rays (one a‘control’, the other a‘treatment’) each with a median M-value close to zero but with very different spreads in their respective M-values. Is this due to tech-nical or biological variation? If the same gene was the most highly expressed feature on both microarrays then without normalisation it would be incorrectly inter-preted as being differentially expressed, but imparting identical distributional measures to these microarrays may remove the biological variation in which we are interested.
each microarray identical, and cyclic loess normalisation (discussed above) which is less aggressive in its normalisation.
Excellent free software exists for the normalisation and analysis of microarray data; for example, Bioconduc-tor [17] is a collection of R [18] packages and includes
the limmapackage (Linear Models for Microarray
Ana-lysis [19]) which implements global loess, print-tip loess, quantile and scale normalisation. However, working with multiple gene microarray layouts inlimmais very difficult; for example, given a number of GenePix files described by just two gene array layout (.gal) files, each . gal file and its associated microarray results files must be input and normalised separately. Then prior to mer-ging the two resulting MAList objects, the datasets must be aligned by gene ID, must be of exactly the same length and should contain the same gene IDs.
There is a real need for an application that can auto-matically (i.e. easily) handle heterogeneous datasets in a robust way.BABAR implements the cyclic loess algo-rithm, normalising each unique pair of microarrays across the whole dataset. We developed BABARto sim-plify the normalisation process for such datasets by pro-viding a combination of ‘within’ and ‘between’ microarray normalisation steps, allowing scientists with-out a background in statistical programming to focus on the interpretation of results.
Implementation RunningBABAR
BABARis a software package implemented in R and is
available as a zip file (see Additional file 1). Its only dependency is on the limma package. As well as the documentation provided with the package, full instruc-tions and an example of running BABARare given in Additional file 2.
Input and handling of microarray data files
BABARsimply requires the unprocessed microarray data
files generated by GenePix (Molecular Devices, CA, USA) and/or BlueFuse (BlueGnome Limited, Cambridge, UK) microarray image analysis software as its input. For GenePix files, only the median background and median foreground columns are read for both channels, along with the corresponding Block, Column and Row data. For BlueFuse files, the AMPCH1 and AMPCH2 col-umns are read along with the corresponding BLOCK, SUBGRIDCOL and SUBGRIDROW data. In this way, the use of gene array layout files is avoided andBABAR
is able to handle any combination of GenePix and Blue-Fuse files. To ensure thatmixturesof GenePix and Blue-Fuse files were handled correctly, a test-set of microarrays was scanned independently by both imaging software packages. Combinations of GenePix and
BlueFuse-derived microarray data were run through
BABAR and the results compared. No significant
differ-ences were seen between GenePix-only, Bluefuse-only, and datasets that were mixtures of these formats; the few small discrepancies simply reflected the different spot-finding software algorithms used by GenePix and BlueFuse and not the BABAR normalisation itself (results not shown).
TheBABARalgorithm
Here we describe the algorithm and the rationale for normalisation via a number of steps carried out ‘within’ microarrays (steps 1-5) and‘between’microarrays (steps 6-8):
1 - Background correction
(GenePix only) Intensity values for each gene are ground-corrected by subtraction of the median back-ground from the median foreback-ground for both channels. In addition, any feature where the background lies within a user-defined number of standard deviations of the foreground is‘flagged’by BABAR(see below). The BlueFuse scanning software automatically carries out background correction via Bayesian statistical methods. 2 - Removal of‘flagged’features
Features are excluded from the normalisation process if: (GenePix only) they are identified in ‘step 1’ or were flagged by the software as either -50, -75 or -100 (’not found’, ‘absent’ or‘bad’, respectively); (Genepix and BlueFuse) features have names like ‘EMPTY’, ‘empty’, ‘ctrl-’and‘Ctrl-’; (BlueFuse only) they are flagged as ‘E’ (the lowest spot quality measure).
3 - Automatic reference channel detection (optional) The same reference sample is used across our datasets. In our hands, for any given microarray, the reference (gDNA) channel always has a higher median value com-pared to the signal channel. This enables the log2-ratios to be automatically calculated in a consistent fashion, even when dye-swaps are present by accident or design. 4 - Block-by-block median centering
Log2-ratios (signal channel/gDNA channel) are calcu-lated for each sub-array and the median value set to zero as our assumption is that the majority of genes are unchanging. As different gene microarray layouts may be employed, the requisite spatial information is retrieved from the microarray files themselves.
5 - Average any multiple features
Where there are multiple copies of an identical sequence (feature) on a given microarray, the average of the log2-ratios is calculated so that any given feature appears just once in the dataset derived from that microarray.
6 - Cyclic loess normalisation (optional)
amount of data included for each local estimate) may also be user-defined; the default‘span’is 0.3, or 30%. 7 - Average the normalised log2-ratios
The average normalised log2-ratio expression value for each feature across the dataset is calculated (see below).
BABAR also handles the case where, inevitably, the
fluorescent signal representing a given gene may not appear on every microarray (see below).
8 - Correct medians to M = 0 (optional)
The averaged, normalised log2-ratios undergo a final correction such that the median log2-ratio of expression for each microarray is set to M = 0 (i.e. equal expres-sion). Results may be outputted as a text file for the convenience of the user.
To better explain the steps following pre-processing of the data and especially the cyclic loess normalisation step, consider steps 6-8 in more detail with an example whereBABARis applied to a dataset comprised of three microarrays (a,bandc). For each feature on a microar-ray let R be the fluorescent signal channel andG the reference channel. A pair-wise MA-plot global loess normalisation is carried out on the first pair of microar-rays (avs.b) such that for each feature
Mablog {(2 Ra/Ga) / (Rb/Gb)} and Aablog2{(Ra/Ga) (Rb/Gb)}.
The normalised log2-ratio (Nab) for each feature is
cal-culated asNab=Mab- loess (Aab), where loess(Aab) is
the global loess curve. The reverse comparison (bvs.a) is simply given byNba= -Nab.
The global loess step is repeated for the other pair-wise comparisons (avs.c, b vs. c) followed by calcula-tion of the reverse comparisons (cvs.a,cvs.b).
The normalised log2-ratios for each feature are aver-aged such that
N
n N N
a ab ac
1
( ),
wherenis the number of pair-wise comparisons invol-ving microarrayafor which the feature was present. If the feature were present on all three microarrays, thenn
= 2 as two pair-wise comparisons can be made (avs.b,
avs.c); the reverse comparisons are not counted (b vs.
a,c vs.a). If the feature were only present on microar-raysaandb thenn= 1, as only one pair-wise compari-son was made, and the normalised log-ratio for this feature on microarraycwould be assigned NA.
The averaging of the normalised log2-ratios step is repeated for the other comparisons to obtain Nb(i.e.
usingNbaand Nbc) and Nc (i.e. usingNcaand Ncb).
Finally, as it is our assumption that the majority of features are not differentially expressed, the averaged, normalised log2-ratios from each microarray undergo a
final correction such that the median log2-ratio of expression for each microarray has an M- value of zero.
Results and Discussion
BABAR was developed primarily to automate the
nor-malisation of heterogeneous datasets (datasets contain-ing different microarray file formats and gene array layouts). It handles ‘problem’ datasets (marked differ-ences in the scale of M-values between microarrays perhaps due to issues with RNA quality) so they can be directly compared to ‘good’ datasets (M-value scal-ing is more comparable between microarrays due to good quality RNA derived from in vitro-grown organisms).
Validating theBABARalgorithm
We first normalised a heterogeneous‘problem’ dataset and compared our BABAR- normalised log2-ratios of gene expression to published RT-PCR experimental data. Normalising such a dataset with existing methods, if even possible, would have required substantial addi-tional programming. Second, we applied BABAR to a non-heterogeneous ‘good’ dataset and compared the performance of the software in determining differentially expressed genes compared to a combination of limma -implemented‘within’and‘between’arrays normalisation. Finally, we appliedBABARto a modest, non-heteroge-neous simulated dataset so as to compare its perfor-mance (power and type I error rates) with thelimma -implemented methods.
Assumptions
Handling missing normalised data
The results file outputted from BABARis in the form of a matrix of log2 normalised gene expression values for genes (rows) under a variety of experimental conditions (columns). It is inevitable that there will be missing values due to either experimental issues or the different gene array layouts employed between conditions. Miss-ing value reconstruction is therefore necessary as many of the microarray analytical algorithms cannot handle missing values; they are typically replaced with zeros or with a row average. We used a better approach: the K-Nearest Neighbours Impute algorithm (KNNimpute) [21]. This considers the correlation structure of the data, finding and using those genes with the most simi-lar expression profiles to the gene under investigation to impute any missing values.
Putting a‘problem’dataset throughBABAR
BABARwas applied to a heterogeneous ‘problem’
data-set from a study describing the transcriptomic changes
for Salmonella entericaserovar Typhimurium
interna-lised within mammalian host cells (epithelial cells or macrophages) as they adapted to the intracellular envir-onment for different post-infection times [13] (ArrayEx-press accession number E-MEXP-1368). This dataset was derived from RNA samples of varying quality, and generated from 23 common reference design GenePix-scanned microarrays described by a total of three gene microarray layouts. The unprocessed microarray data files are available as Additional file 3.
BABAR was run with the three normalisation steps
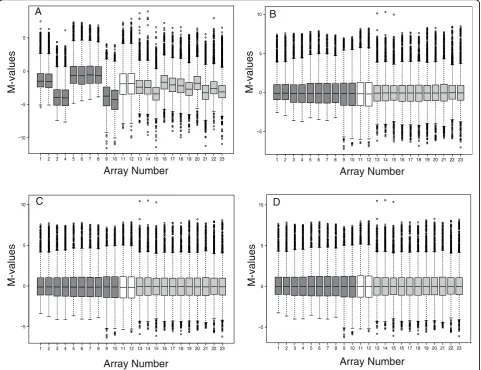
enabled: block-by-block centering of the medians around M = 0, cyclic loess and a final correction of each microarray’s median to M = 0. Four boxplots plotting M-value versus microarray ID were generated to repre-sent the data prior to processing and after each of the three normalisation steps (Figure 1).
Prior to BABAR processing, the microarray data exhibited considerable variation around M = 0 (Figure 1A). Clearly, without normalising these data any gene expression comparisons made between microarrays would be meaningless.
The first steps implemented byBABARin normalising the dataset were background correction and block-by-block data centering (median M-values corrected to zero) for all microarrays (Figure 1B). However, differ-ences in the scale and distribution of M-values between arrays still remained, and were particularly pronounced between the macrophage (light grey boxplots; typical standard deviation, s.d. = 1.71) and control experiments (white boxplots; typical s.d. = 2.33). Another potential problem highlighted in Figure 1B concerned microarrays 1-8 (dark grey boxplots). Even though these data are log-transformed and pre-processed, they exhibit a
(positively) skewed distribution nearly double that of the other microarrays (typical skewness, Sk = 0.96 c.f. Sk = 0.53). Clearly these data must be further transformed before robust comparisons between microarrays can be made.
After applying cyclic loess normalisation to MA-plots for all unique pairs of common reference microarrays,
BABARaverages the log2-ratios (Figure 1C). As a result,
the scale of the normalised M-values and the degree of skewness were made more comparable across the whole dataset; the macrophage (light grey boxplots) and con-trol experiments (white boxplots) now had typical stan-dard deviations of s.d. = 1.75 and s.d. = 2.04, respectively, and the typical skewness values for micro-arrays 1-8 and the remainder of the micromicro-arrays were Sk = 0.87 and Sk = 0.68, respectively (Figure 1C).
As it is assumed that the majority of genes are not dif-ferentially expressed (i.e. M = 0),BABAR carries out a final data centering (Figure 1D) as it may be seen that there has been a slight shift in the medians across the dataset away from M = 0 (highlighted by microarrays 12-13 in Figure 1C).
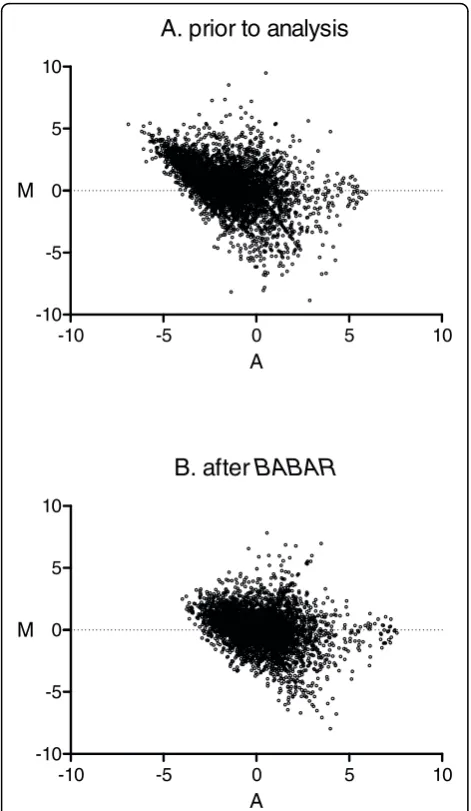
Loess normalisation is a‘within’microarrays normali-sation method that is used to normalise two channels on the same microarray (i.e. a direct comparison design). As described previously, we have conceptualised the comparison of a pair of common reference microar-rays to be pseudo-direct; the loess algorithm is used here to normalise each unique pair of common refer-ence microarrays. The MA-plots of Figure 2 are typical of those obtained from pairs of common reference two-colour microarrays. Figure 2A shows just one of the 253 (i.e. 23(23-1)/2) unique comparisons thatBABARmade for this dataset, and Figure 2B shows that the overall effect of the BABAR algorithm on the same pair of microarrays is to improve the symmetry of the data around M = 0.
The requirement for the microarrays in a dataset to have a similar spread and distribution prior to analysis is often seen as a ‘must’. However, this is an assump-tion and the quesassump-tion of how best to normalise hetero-geneous datasets without removing biological variation is an important one. It has been shown above that
BABAR, by implementing the cyclic loess algorithm (a
‘complete data method’), improves the symmetry of the MA-plot for microarray pairs and makes the distribu-tional measures such as standard deviation and skew-ness closer over the dataset as a whole. Therefore validation was required to demonstrate that BABAR’s
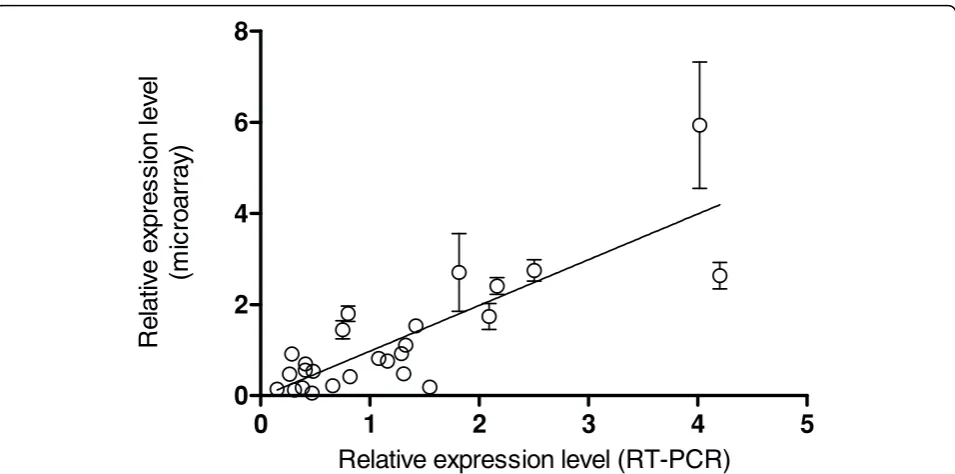
epithelial cells at 2 h and 6 h post infection [13]. These genes, possessing a wide range of expression levels, are representative of those involved in iron uptake (entB), invasion (invF, prgH, sifA, ssaG), metabolism (gapA,
pgi, zwf), the flagellar system (flgL, fliC, fliF, fljB), and included a control (nusG). It may be seen from Figure 3 that the microarray and RT-PCR data are in good agreement (Pearson correlation coefficient = 0.83, p < 0.001).
Additional validation was obtained at the level of protein expression. The results of immunogold and immuno-fluorescent labelling showed that the flagellin proteins FliC and FljB were indeed present in infected epithelial cells at detectable levels [13], and a two-fold
increase in FliC protein was observed inside epithelial cells (6 h c.f. 2 h) which compared to ~three-fold increase for the microarray (3.3-fold) and RT-PCR data (3.6-fold). These findings validated the BABAR -normal-isation of the original dataset because the protein data supported the transcriptomic findings.
Though modest in scale, this dataset presented a real challenge to other existing software because the consti-tuent microarrays were described by three gene array layouts and showed considerable M-value variation. We are unaware of any software that automatically handles such data. Our findings validate the BABARalgorithm for the normalisation of heterogeneous datasets prior to further analyses.
M-values
s
e
ul
a
v-M
1 2 3 4 5 6 7 8 9 10 11 12 13 14 15 16 17 18 19 20 21 22 23 0
5
A
1 2 3 4 5 6 7 8 9 10 11 12 13 14 15 16 17 18 19 20 21 22 23 0
5 10 B
1 2 3 4 5 6 7 8 9 10 11 12 13 14 15 16 17 18 19 20 21 22 23 0
5 10
Array Number
M-values
C
1 2 3 4 5 6 7 8 9 10 11 12 13 14 15 16 17 18 19 20 21 22 23 0
5 10
Array Number
s
e
ul
a
v-M
D
[image:6.595.58.540.90.460.2]Array Number Array Number
Figure 1BABAR-generated boxplots showingSalmonellagene expression for the dataset of Hautefortet al. [13]. The figures plot M-value versus microarray identity. Gene expression M-values were obtained forSalmonellainternalised in epithelial cells (dark grey boxplots), grown in Luria-Bertani broth (LB) control samples (white boxplots) or internalised in macrophages (light grey boxplots) prior toBABARprocessing (A), and after background correction with‘within arrays’block-by-block data centering (B), cyclic loess with averaging of the log2-ratios (C), and final
BABARvs. standard techniques
We next compared the performance ofBABARin deter-mining differentially expressed genes with standard methods as implemented by another R package,limma
(version 2.16.4). We applied both packages to a dataset describing the transcriptomic changes for virulence-related genes at different phases of growth for the wild-type (WT) S. Typhimurium compared to mutants defi-cient in one or both subunits of the DNA- binding pro-tein Integration Host Factor (IHF), IHFa and IHFb[22] (ArrayExpress accession number E-MEXP-2416). As the bacteria were grownin vitro, RNA quality for this data-set was good. This datadata-set was generated from 27 com-mon reference design GenePix-scanned microarrays
described by a single gene array layout (see Additional file 4 for the unprocessed microarray data files and the associated .gal file).BABAR was run with the main nor-malising steps enabled and generated the boxplots seen in Figure 4.
Although still requiring normalising, the IHF dataset is an example of a‘good’non-heterogeneous dataset that was derived from RNA that was of a consistently good quality. Compared to Fig 1A, there is a reduction in the variation about M = 0, skewness (typical SK= 0.32) and variance of the microarrays M-values (Figure 4A). Fol-lowingBABAR’s three normalisation steps (Figures 4B, 4C and 4D) these data were ready for analysis. For
limma normalisation we applied background correction
(normexp) and a‘within arrays’method for data center-ing (printtiploess) followed by a ‘between arrays’ method, either quantile or scale normalisation. The slight median shift away from M = 0 that was apparent afterBABAR’s cyclic normalisation step (Figures 4C and
5A) was also seen following quantile (Figure 5B) or scale normalisation (Figure 5C). This was not‘corrected’ for in the latter two methods as an equivalent step is not implemented by thelimmapackage.
The published IHF study focused primarily on the comparison between the WT and the ihfAB double mutant, with one of the key findings being that the loss of IHF had strong negative effects on virulence genes [22]. Our focus here will therefore be on down-regula-tion of gene expression. To determine the differentially expressed down- regulated genes for BABAR- and
limma-normalised log2-ratios, the outputs from these
methods were analysed via the Qlucore Gene Expression Explorer (QGEE) software (version 1.1; [3]). The QGEE software was used to impute any missing values via its implementation of the KNNimpute algorithm (default number of neighbours used in the imputation = 10) [21] and to identify those down-regulated genes that could separate the WT and double mutant samples with a high degree of confidence (p≤0.01) for each method.
Interestingly, despite the suggestion from the boxplots (Figures 5B and 5C), the results from the QGEE soft-ware analyses after scale or quantile normalisation were very similar. From Figure 6 it may be seen that at p ≤ 0.01 both methods detected 175 down-regulated genes with 151 genes (~86 %) common to both. Comparably,
BABAR detected 214 down-regulated genes with 136
and 135 genes in common with scale and quantile nor-malisation, respectively. For the genes that were the focus for the original IHF study (see below), the quantile normalisation method detected two genes that were absent from the scale normalisation results (results not shown). Therefore, for simplicity only the quantile data was considered further and will be referred to as the
limmadata.
A. prior to analysis
-10 -5 0 5 10
-10 -5 0 5 10
A M
B. after
BABAR
-10 -5 0 5 10
-10 -5 0 5 10
[image:7.595.56.292.88.494.2]A M
Figure 2MA-plots for a pair of microarrays before (A) and after (B)BABAR. For a pair of microarrays (array 1 vs. array 11 - see Figure 1) from [13], the intensity log-ratio M = log2{(R1/G1)/(R11/G11)}
was plotted against the mean log intensity A = log2√{(R1/G1) ×
Our comparison of normalisation methods focused on differences in expression between the WT and double
ihfABmutant for genes encoded by the fourSalmonella
Pathogenicity Islands (SPI1, 2, 4 & 5), chemotaxis and flagellae genes. A summary of the results for the differ-ential gene expression analysis of virulence-associated genes shows excellent agreement betweenBABAR and
limma(Table 1). For example, for the 40 genes encoded
by the SPI1 pathogenicity island, both BABAR and
limma determined 29 genes to be down-regulated, with
28 of those genes common to both. Closer inspection showed the QGEE software analysis detected slightly more down-regulated genes for theBABAR-normalised data (64 genes) compared to thelimma-normalised data (59 genes).
These results show that theBABARalgorithm can be successfully used to normalise datasets prior to further analyses.
Comparison of methods using simulated data
To further validate BABAR we compared its perfor-mance against the limma-implemented methods for normalisation using a simulated dataset. With such datasets, the number of differentially expressed genes is known making it possible to calculate the power of detection and type I errors.SIMAGEwas used to simu-late two-colour DNA microarray data [23], generating 6 simulated microarrays each with 5000 genes arranged in
4 × 4 blocks; SIMAGEdefault settings were otherwise used. Due to the difficulty described previously in ana-lysing heterogeneous datasets these simulated data were treated as consisting of single format result files described by a single array layout. The output files were converted to a .gpr format and normalised via BABAR, print-tip loess, quantile and scale normalisation. Signifi-cance analysis of microarrays (SAM [24]) was carried out using the freely accessible samrR package (version 1.26) [25] to calculate power (1 - false discovery rate) and type I error (false negative) rates for each normali-sation method.
It may be seen from Table 2, that for 118 differentially expressed genes the performance of BABAR (power = 0.62) was comparable to scale normalisation (power = 0.66), and was considerably better than quantile (power = 0.51) or print-tip loess (power = 0.48) normalisation. At higher numbers of differentially expressed genes, scale normalisation appeared to perform best but
BABAR continued to outperform both quantile and
print-tip loess normalisation. It was also seen that the three‘between arrays’methods outperformed the print-tip loess ‘within arrays’ method. One issue with simu-lated datasets is that they can’t inform upon what level of power is required to still obtain the correct biological interpretation for a given dataset; perhaps detecting only the 10% most regulated genes, a power as low as 0.1, may be sufficient for some datasets [26]. When
0
1
2
3
4
5
0
2
4
6
8
Relative expression level (RT-PCR)
R
e
la
ti
ve
ex
p
res
s
io
n
l
e
ve
l
(m
ic
ro
a
rra
[image:8.595.60.538.87.324.2]y)
Figure 3Comparison ofBABAR-normalised microarray data with RT-PCR analyses. The relative expression levels for 13Salmonellagenes from inside epithelial cells (2 h p.i. or 6 h p.i. vs. mid-exponential LB control cultures) as determined by microarray analysis (BABARnormalisation) and RT-PCR are shown (Pearson correlation coefficient = 0.83, p < 0.001; r2= 0.69 via linear regression). For the RT-PCR analyses, RNA was
comparing normalisation methods it is important to analyse real and simulated data, and our findings have shown BABAR’s effectiveness in highlighting
differen-tially expressed genes from real datasets. The perfor-mance of BABAR is impressive given that it was designed with large, heterogeneous datasets in mind (not the modest and uniformly designed simulated data-set described above) and makes limited use of any spa-tial information.
Normalisation comparison summary
We have demonstrated BABAR’s ability to transform microarray data compares well with the standard meth-ods investigated so as to allow for their correct interpre-tation. As BABAR implements an algorithm which
normalises each unique pair of microarrays, the impact on the running time of the analysis was investigated. For a PC running Windows XP with a 2.66 GHz Intel®-Core™ 2 Duo CPU with 2 GB RAM,BABARanalysis of the IHF dataset (27 microarrays) took 40s compared to 15s via thelimma-implemented methods. Cyclic loess is still preferred to quantile normalisation, for example, as it is not as aggressive in its normalisation, but if run time issues are a concern then a faster cyclic loess tech-nique has been developed [16].
In using real and simulated datasets for a direct com-parison ofBABARwithlimma-implemented methods of normalisation, it has been necessary to use non-hetero-geneous datasets. This is due to the fact that the latter methods are unable to handle the heterogeneous 1 2 3 4 5 6 7 8 9 10 11 12 13 14 15 16 17 18 19 20 21 22 23 24 25 26 27
0 5 10 C
Array Number
s
e
ul
a
V-M
1 2 3 4 5 6 7 8 9 10 11 12 13 14 15 16 17 18 19 20 21 22 23 24 25 26 27 0
5 10 D
Array Number
s
e
ul
a
V-M
1 2 3 4 5 6 7 8 9 10 11 12 13 14 15 16 17 18 19 20 21 22 23 24 25 26 27 0
5 10 B
Array Number
s
e
ul
a
V-M
1 2 3 4 5 6 7 8 9 10 11 12 13 14 15 16 17 18 19 20 21 22 23 24 25 26 27 0
5
A
Array Number
s
e
ul
a
[image:9.595.59.540.89.463.2]
V-M
Figure 4BABAR-generated boxplots showingSalmonellagene expression for the IHF dataset[22]. The figures plot M-value versus microarray identity. Gene expression values were obtained for wild-typeSalmonella(white boxplots), IHFamutant (light grey boxplots), IHFb mutant (grey boxplots) and the double IHF mutant (dark grey boxplots) prior toBABARprocessing (A), after background correction with‘within arrays’block-by-block data centering (B), cyclic loess with averaging of the log2-ratios (C), and final centering of the data representing the
1 2 3 4 5 6 7 8 9 10 11 12 13 14 15 16 17 18 19 20 21 22 23 24 25 26 27 0
5 10
A
Array Number
s
e
ul
a
V-M
1 2 3 4 5 6 7 8 9 10 11 12 13 14 15 16 17 18 19 20 21 22 23 24 25 26 27 0
5
Array Number
s
e
ul
a
V-M
B
1 2 3 4 5 6 7 8 9 10 11 12 13 14 15 16 17 18 19 20 21 22 23 24 25 26 27 0
5 10
Array Number
s
e
ul
a
V-M
[image:10.595.60.538.82.670.2]C
datasets for which BABAR was developed. To handle such datasets BABAR makes some assumptions about the data it will receive, butBABAR’s real value comes from handling those datasets that other applications cannot.
Present and future applications ofBABAR
FollowingBABAR-normalisation, it is possible to com-pare the data derived from any microarray with any other for a given dataset with confidence. Other studies have employed very different approaches to the chal-lenge of combining different microarray data into a sin-gle dataset which may then be subjected to further analysis. One study used multivariate linear regression to create a fused and cleaned dataset from data for 9 experiments (178 microarrays), downweighting microar-rays of poor experimental quality [27]. Another study used statistical discrimination to merge two datasets
from different microarray platforms (cDNA and Agilent oligo microarrays) [28]. However, both of these methods require the microarrays to have been normalised prior to merging. In contrast, a further study [29] employed a novel three-step strategy to normaliseandintegrate data arising from five Affymetrix microarray generations. Using a different strategy BABAR also normalises and merges microarray data but is applied to common refer-ence two-colour microarrays with different file formats or array layouts.
Our focus in this paper has been on differential gene expression, which is important for many experimental-ists. We believe that great benefit will be also be obtained when applyingBABARto datasets prior to ‘sys-tems’-level analyses which, for instance, utilise large
BABAR
limma
scale
limma
quantile
68
10
14
11
125
13
[image:11.595.57.291.88.339.2]26
Figure 6A comparison of down-regulated genes detected afterBABAR, scale and quantile normalisation. A Venn diagram showing the relations between down-regulated genes detected by the QGEE software (p≤0.01) for the IHF dataset [22] (WT versus ihfABdouble mutant) following eitherBABAR,limmascale orlimma quantile normalisation. For theBABARprocessing, the QGEE software analyses were run after background correction with‘within arrays’block-by-block centering of the medians,‘between arrays’ cyclic loess with averaging of the log2-ratios, and final centering of
[image:11.595.304.539.126.236.2]the data. For the twolimma-implemented normalisation methods the QGEE software analyses were run after the data were background corrected (normexp) with a‘within arrays’method for data centering (printtiploess), followed by a‘between arrays’ method, either quantile or scale normalisation.
Table 1 Validation ofBABARby comparison withlimma
normalisation for the detection of differentially-expressed genes
Number of down-regulated genes detected
Virulence genes BABARunique Both methods limmaunique
SPI1 (40) 1 28 1
SPI2 (31) 4 10 2
SPI4 (6) 1 4 1
SPI5 (11) 1 3 0
Other genes
Chemotaxis (9) 1 5 0
Flagellae (23) 2 4 1
The number of down-regulated genes detected by the QGEE software (p≤
0.01) for the IHF dataset [22] (WT versusihfABdouble mutant) following either
BABARorlimmaquantile normalisation. The number of genes in each group is given in brackets (120 in total). Chemotaxis genes includecheandmotgenes; flagellae genes includeflg,fliandfljgenes.
Table 2 Comparison of the power and type I errors for a simulated microarray dataset
Normalisation method
Scale BABAR Quantile print-tip
loess
No. of genes
Power Error Power Error Power Error Power Error
118 0.66 0.022 0.62 0.030 0.51 0.032 0.48 0.033 220 0.73 0.034 0.58 0.053 0.57 0.051 0.51 0.056 407 0.77 0.055 0.62 0.088 0.61 0.089 0.56 0.091 756 0.82 0.088 0.67 0.150 0.65 0.158 0.63 0.163 1402 0.87 0.144 0.76 0.260 0.74 0.300 0.71 0.314
[image:11.595.305.540.527.645.2]transcriptomic datasets to infer regulatory or metabolic networks. Like many research groups we have amassed a vast collection of transcriptomic data into a gene expression compendium and network inference techni-ques are now being used to extract high-level informa-tion from these data [10,30]. However, the initial normalisation of these data is critical if meaningful interpretations are to be made.
We are not aware of any software that would handle the heterogeneous datasets that can comprise such gene expression compendia without considerable addi-tional programming. Our recent network analysis of a compendium of heterogeneous two-colour transcrip-tomic data demonstrated the value of theBABAR algo-rithm. At present BABAR accepts only (unprocessed) GenePix and BlueFuse microarray data files; a useful adaptation would allow other data file formats to be processed. In addition, enabling BABAR to handle tables of (un-normalised) data, as might be retrieved from repositories such as ArrayExpress or the Gene Expression Omnibus, would greatly extend the reser-voir of data for analysis.
Conclusions
The development of DNA microarrays for transcrip-tomic analysis has revolutionised many areas of biology and has facilitated the generation of a mass of transcrip-tomic datasets. The normalisation of such datasets remains a challenge as many factors can contribute to the variability that occurs between microarrays, con-founding the biologically-correct interpretation of these data. The challenge is compounded by the heteroge-neous datasets that may be compiled for ‘systems’-level analyses. The surge in interest in deep-sequencing tech-niques (e.g. [31] for a recent review of the area applied to microbial genetics) may seem to have heralded the ‘death of microarrays’[32]. However, given the amount of transcriptomic data that await analysis, microarrays will remain to be a powerful analytical technique for some time. As this is an ideal tool for facilitating robust gene expression and network inference analyses, to obtain maximum insight from valuable transcriptomic data useBABAR.
Availability and requirements
Project name:BABAR
Project home page: http://www.ifr.ac.uk/info/science/ FoodbornePathogens/index.htm
Operating System(s): Windows XP and Red Hat Enterprise Linux 5.
Programming language: R
Other requirements: R-2.9.2 or newer, and limma
2.16.4 or newer.
License: GNU General Public License
BABARis available as a zip file (see Additional file 1)
with detailed installation and running instructions (see Additional file 2).
Additional file 1:BABARsoftware. TheBABARR package. Click here for file
[ http://www.biomedcentral.com/content/supplementary/1471-2105-11-73-S1.ZIP ]
Additional file 2:BABARdocumentation. Vignette detailing the installation and running ofBABAR.
Click here for file
[ http://www.biomedcentral.com/content/supplementary/1471-2105-11-73-S2.PDF ]
Additional file 3: Dataset 1. The unprocessed microarray data files from a heterogeneous‘problem’dataset describing the transcriptomic changes forSalmonellainternalised within mammalian cells. Click here for file
[ http://www.biomedcentral.com/content/supplementary/1471-2105-11-73-S3.ZIP ]
Additional file 4: Dataset 2. The unprocessed microarray data files and the associated .gal file for a non-heterogeneous‘good’dataset describing the transcriptomic changes of virulence genes for wild-typeSalmonella and IHF mutants.
Click here for file
[ http://www.biomedcentral.com/content/supplementary/1471-2105-11-73-S4.ZIP ]
Acknowledgements
This work was funded by the BBSRC Core Strategic Grant to JCDH and a BEP II BBSRC Oasis Database Grant (Ref. BBSB13810) to JS. We are grateful to Isabelle Hautefort for furnishing theSalmonellagene expression data from [13] and to Jack Dainty for assistance with thesamrpackage.
Author details 1
Foodborne Bacterial Pathogens, Institute of Food Research, Norwich Research Park, Norwich, NR4 7UA, UK.2Bioinformatics & Statistics, Institute of
Food Research, Norwich Research Park, Norwich, NR4 7UA, UK.3Integrated Biology of the GI Tract, Institute of Food Research, Norwich Research Park, Norwich, NR4 7UA, UK.4Current address:The Genome Analysis Centre, Norwich Research Park, Norwich, NR4 7UH, UK.5Current address:Department
of Microbiology, Moyne Institute of Preventive Medicine, School of Genetics and Microbiology, Trinity College, Dublin 2, Ireland.
Authors’contributions
JS wrote the source code and created the package. MJA tested the package, analysed and interpreted the data, drafted the manuscript and assisted JS. SL supplied the test data and with JCDH was involved in the conception of this research and finalising the manuscript. All authors read and approved the final version of the manuscript.
Received: 9 July 2009
Accepted: 3 February 2010 Published: 3 February 2010
References
1. Breitling R, Armengaud P, Amtmann A, Herzyk P:Rank products: a simple, yet powerful, new method to detect differentially regulated genes in replicated microarray experiments.FEBS Letters2004,573:83-92. 2. Smyth GK:Linear models and empirical Bayes methods for assessing
differential expression in microarray experiments.Statistical Applications in Genetics and Molecular Biology2004,3:3.
3. Qlucore Gene Expression Explorer 1.1.http://www.qlucore.com. 4. Leung YF, Cavalieri D:Fundamentals of cDNA microarray data analysis.
Trends in Genetics2003,19:649-659.
6. Thompson A, Rowley G, Alston M, Danino V, Hinton JCD:Salmonella
transcriptomics: relating regulons, stimulons and regulatory networks to the process of infection.Current Opinion in Microbiology2006,9:109-116. 7. Yang YH, Speed T:Design issues for cDNA microarray experiments.
Nature Reviews Genetics2002,3:579-588.
8. DeRisi JL, Iyer VR, Brown PO:Exploring the metabolic and genetic control of gene expression on a genomic scale.Science1997,278:680-686. 9. Gadgil M, Lian W, Gadgil C, Kapur V, Wu WS:An analysis of the use of
genomic DNA as a universal reference in two channel DNA microarrays.
BMC Genomics2005,6:66.
10. Faith JJ, Hayete B, Thaden JT, Mogno I, Wierzbowski J, Cottarel G, Kasif S, Collins JJ, Gardner TS:Large-scale mapping and validation ofEscherichia
colitranscriptional regulation from a compendium of expression profiles.PLoS Biology2007,5:54-66.
11. Dudoit S, Yang YH, Callow MJ, Speed TP:Statistical methods for identifying differentially expressed genes in replicated cDNA microarray experiments.Statistica Sinica2002,12:111-139.
12. Eriksson S, Lucchini S, Thompson A, Rhen M, Hinton JCD:Unravelling the biology of macrophage infection by gene expression profiling of intracellularSalmonella enterica.Molecular Microbiology2003,47:103-118. 13. Hautefort I, Thompson A, Eriksson-Ygberg S, Parker ML, Lucchini S,
Danino V, Bongaerts RJM, Ahmad N, Rhen M, Hinton JCD:During infection of epithelial cellsSalmonella entericaserovar Typhimurium undergoes a time-dependent transcriptional adaptation that results in simultaneous expression of three type 3 secretion systems.Cellular Microbiology2008,
10:958-984.
14. Grissom SF, Lobenhofer EK, Tucker CJ:A qualitative assessment of direct-labeled cDNA products prior to microarray analysis.BMC Genomics2005,
6:36.
15. Bolstad BM, Irizarry RA, Astrand M, Speed TP:A comparison of normalization methods for high density oligonucleotide array data based on variance and bias.Bioinformatics2003,19:185-193. 16. Ballman KV, Grill DE, Oberg AL, Therneau TM:Faster cyclic loess:
normalizing RNA arrays via linear models.Bioinformatics2004,
20:2778-2786.
17. Gentleman R, Carey V, Bates D, Bolstad B, Dettling M, Dudoit S, Ellis B, Gautier L, Ge Y, Gentry J,et al:Bioconductor: open software development for computational biology and bioinformatics.Genome Biology2004,5: R80.
18. R Development Core Team:R: a language and environment for statistical computingR Foundation for Statistical Computing, Vienna, Austria 2008http://www.r-project.org.
19. Smyth GK:Limma: linear models for microarray data.Bioinformatics and computational biology solutions using R and BioconductorNew York: SpringerGentleman R, Carey V, Dudoit S, Irizarry R, Huber W 2005, 397-420. 20. Quackenbush J:Microarray data normalization and transformation.Nature
Genetics Supplement2002,32:496-501.
21. Troyanskaya O, Cantor M, Sherlock G, Brown P, Hastie T, Tibshirani R, Botstein D, Altman RB:Missing value estimation methods for DNA microarrays.Bioinformatics2001,17:520-525.
22. Mangan MW, Lucchini S, Danino V, Croinin TO, Hinton JCD, Dorman CJ:
The integration host factor (IHF) integrates stationary-phase and virulence gene expression inSalmonella entericaserovar Typhimurium.
Molecular Microbiology2006,59:1831-1847.
23. Albers CJ, Jansen RC, Kok J, Kuipers OP, van Hijum SAFT:SIMAGE: simulation of DNA-microarray gene expression data.BMC Bioinformatics 2006,7:205.
24. Tusher VG, Tibshirani R, Chu G:Significance analysis of microarrays applied to the ionizing radiation response.Proceedings of the National Academy of Sciences of the United States of America2001,98:5116-5121. 25. samr R package.http://www-stat.stanford.edu/~tibs/SAM/.
26. Jorstad TS, Langaas M, Bones AM:Understanding sample size: what determines the required number of microarrays for an experiment?.
Trends in Plant Science2007,12:46-50.
27. Gilks WR, Tom BDM, Brazma A:Fusing microarray experiments with multivariate regression.Bioinformatics2005,21:137-143.
28. Benito M, Parker J, Du Q, Wu JY, Xang D, Perou CM, Marron JS:Adjustment of systematic microarray data biases.Bioinformatics2004,20:105-114. 29. Kilpinen S, Autio R, Ojala K, Iljin K, Bucher E, Sara H, Pisto T, Saarela M,
Skotheim RI, Bjorkman M,et al:Systematic bioinformatic analysis of
expression levels of 17,330 human genes across 9,783 samples from 175 types of healthy and pathological tissues.Genome Biology2008,9:R139. 30. Yoon HJ, McDermott JE, Porwollik S, McClelland M, Heffron F:Coordinated
Regulation of Virulence during Systemic Infection ofSalmonella enterica
serovar Typhimurium.PLoS Pathogens2009,5(2):e1000306.
31. MacLean D, Jones JDG, Studholme DJ:Application of‘next-generation’ sequencing technologies to microbial genetics.Nature Reviews Microbiology2009,7:287-296.
32. Ledford H:The death of microarrays?.Nature2008,455:847-847.
doi:10.1186/1471-2105-11-73
Cite this article as:Alstonet al.:BABAR: an R package to simplify the normalisation of common reference design microarray-based transcriptomic datasets.BMC Bioinformatics201011:73.
Submit your next manuscript to BioMed Central and take full advantage of:
• Convenient online submission
• Thorough peer review
• No space constraints or color figure charges
• Immediate publication on acceptance
• Inclusion in PubMed, CAS, Scopus and Google Scholar
• Research which is freely available for redistribution
![Figure 4 BABARprocessed output of-generated boxplots showing Salmonella gene expression for the IHF dataset [22]](https://thumb-us.123doks.com/thumbv2/123dok_us/917459.604395/9.595.59.540.89.463/figure-babarprocessed-generated-boxplots-showing-salmonella-expression-dataset.webp)
![Figure 5 Comparing the spread of expression values across the IHF dataset [22]after BABAR and limma-normalisation](https://thumb-us.123doks.com/thumbv2/123dok_us/917459.604395/10.595.60.538.82.670/figure-comparing-spread-expression-values-dataset-babar-normalisation.webp)

